HAL Id: hal-00873944
https://hal.archives-ouvertes.fr/hal-00873944
Submitted on 17 Oct 2013
HAL is a multi-disciplinary open access
archive for the deposit and dissemination of
sci-entific research documents, whether they are
pub-lished or not. The documents may come from
teaching and research institutions in France or
abroad, or from public or private research centers.
L’archive ouverte pluridisciplinaire HAL, est
destinée au dépôt et à la diffusion de documents
scientifiques de niveau recherche, publiés ou non,
émanant des établissements d’enseignement et de
recherche français ou étrangers, des laboratoires
publics ou privés.
Versus Electrocardiogram: A Validation Approach
Dany Obeid, Sawsan Sadek, Gheorghe Zaharia, Ghais El Zein
To cite this version:
Dany Obeid, Sawsan Sadek, Gheorghe Zaharia, Ghais El Zein. Microwave Doppler Radar for Heart
Beat Detection Versus Electrocardiogram: A Validation Approach. Proc. of the MMS 2013, Sep 2013,
Saida, Lebanon. pp.1-6. �hal-00873944�
Microwave Doppler Radar for Heart Beat Detection
Versus Electrocardiogram: A Validation Approach
Dany OBEID
1, Sawsan SADEK
2, Gheorghe ZAHARIA
3, Ghaïs EL ZEIN
31Kaptalia Monitoring, Place Albert Einstein, PIBS Prisme 2, 56000 Vannes, France 2Lebanese University, University Institute of Technology, B.P. 813, Saida, Lebanon 3IETR UMR CNRS 6164 - INSA, 20 Ave. des Buttes de Coësmes, CS 14315, 35708 Rennes, France
Abstract- This paper provides a validation approach for a
microwave Doppler Radar system used for heartbeat detection. The proposed system is tested at 16 GHz with several transmitted power, simultaneously with a pc-based electrocardiogram. Obtained results show accurate detection for the heartbeat signal in terms of heartbeat rate and heart rate variability.
1. Introduction
The utility of microwave Doppler radar has increased recently for several applications. These include home health care applications, urgent conditions, and hospital needs. Traditional electrocardiograms are perturbing for long-duration home monitoring, as well as for patients with conditions such as burn victims or newly born infants. Also, a touch-less technique is a must to detect life signs for people under rubble [1].
Based on the Doppler theory, a target with a quasi-periodic movement reflects the transmitted signal with its phase modulated by the time-varying position of the target [2]. When the target is the person's chest, the reflected signal contains information about the chest displacement due to heartbeat and respiration. However, while holding breath, the reflected signal depends on the chest displacement due to heartbeat alone. At rest, the variation of the chest displacement, caused by respiration, is between 4 and 12 mm [3], and the chest displacement due to heartbeat alone ranges between 0.2 and 0.5 mm [4]. The respiration rate corresponds to a frequency that varies between 0.1 and 0.3 Hz, while the heartbeat rate (HR) corresponds to a frequency that varies between 1 and 3 Hz [5].
Previous works tend to detect life signs [6, 7], respiration rates and heartbeat rates, using fixed frequency and fixed power of the transmitted signal. Direct-conversion Doppler radars, operating at 1.6 GHz and 2.4 GHz, have been integrated in 0.25 mm CMOS and BiCMOS technologies [8]. Heart and respiration activities were detected using a modified Wireless Local Area Network PCMCIA card, and a module combining the transmitted and reflected signals [9]. Other systems operating in the Ka-Band were described in [10] using a low power double-sideband transmission signal. Similarly, quadrature demodulation architecture is used to detect vital signs from distance [11]. A new study showing the possibility of detecting the presence of a person through a wall using Ultra-Wideband (UWB) radar is presented in [12]. Some experiments are performed for the detection of life signs using the 4 –7 GHz
band with 1 mW power and around 7 dB antenna gain [13]. A recent study describes a system operating at 94 GHz that is able to detect the heart and the respiration activities of stationary subjects [14]. Another related published work showed the ability of measuring the heartbeat rate using a Vector Network Analyzer (VNA) and only one antenna [15].
In this paper, a microwave system for heartbeat detection is proposed. The aim of this system is to provide a comparative approach in terms transmitted power. The proposed system, tested for one frequency and several transmitted powers, is validated with an electrocardiogram (ECG) signal.
As the transmission of a signal with minimum power would be safer for both patient and medical staff, measurements are performed for several transmitted power levels between 0 and -25 dBm. Both Heartbeat Rate (HR) and Heart Rate Variability (HRV) are extracted and compared to the values obtained by the ECG.
2. System Description
The proposed system consists of using a vector network analyzer (VNA) and two antennas where the S21 parameter
is considered. Measurements were performed while holding the breath for duration of 15 seconds. This duration may vary in the order of milliseconds in order to sustain synchronization between the VNA and the ECG. The number of points taken for the signals measured with the VNA is 20000. The use of a VNA accommodates a quick and simple installation process. Beside simplicity, many benefits are offered upon the use of a VNA (N5230A); these include the following features:
• Full 4-port S-parameter and balanced measurements up to 20 GHz
• 120 dB dynamic range at 20 GHz • Trace noise < 0.006 dB at 100 kHz IFBW • Sampling period < 4 µs
• Automatic port extension automatically corrects in fixture measurements.
• Advanced connectivity with LAN, USB, and GPIB interfaces
One of the most powerful features gained using a VNA is the possibility of tuning both the operational frequency and the transmitted power. In addition, a VNA allows controlling different parameters such as the sweep time and
the number of points for a specific trace; thus the sampling rate can be pre-determined.
The operational frequency used in these measurements is 16 GHz. The choice of this frequency is made according to two reasons. The first one is to obtain higher phase variation as it is directly proportional to the frequency, and the second reason is due to the equipment’s limits (2 – 16 GHz for the antennas). An extension of the system operating at 60 GHz is described in [16, 17]. The measurements procedure starts by sending a continuous wave signal at the desired frequency. The signal is generated by the VNA and driven to the transmitting antenna, which is directed toward the person’s chest. The transmitted signal is reflected off the person chest and received by an antenna similar to the transmitter. The received signal is driven to the VNA where the phase variation of S21 is computed. This phase corresponds to the
difference between the phase of the received signal and the phase of the transmitted signal. The variation of the phase of S21 is due to the chest displacement. Hence, it contains
information about the cardiopulmonary signals when breathing normally, and about the heartbeat signal when holding the breath.
Since the heartbeat rate is based on the detection of the signal peaks, a smoothing method is applied in order to
reduce the number of surrounding peaks. The smoothing method is based on the Newton relation:
(a + b)
2 m=
C
2 m ka
kb
2 m!k k=0 2 m"
(1)where n = 2m + 1 is the length of the smoothing window and
(2)
3. Heartbeat Signal Detection
This section presents the results obtained upon the detection of the heart activity using the phase of S21 where
two antennas are used to respectively transmit and receive signals. Measurements are performed for several transmitted power values. The phase variation of S21 is
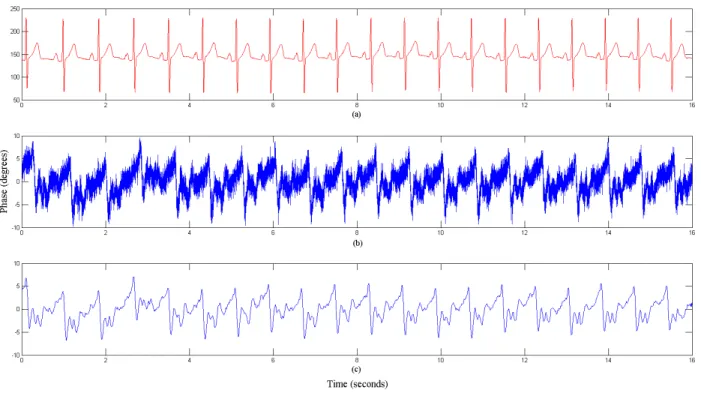
measured. Figure 1 (a) shows the heartbeat signal detected using an ECG, while Figure 1 (b) shows the phase variation of S21 due to heartbeats detected using a transmitted power
of -5 dBm. These two signals are obtained simultaneously for the same patient. Figure 1 (c) shows the heartbeat signal (the phase of S21) after applying a smoothing technique.
Figure 1. ECG signal (a) and phase variations of S21 due to heartbeats detected at 16 GHz and -5 dBm: original signal (b), smoothed signal (c)
!
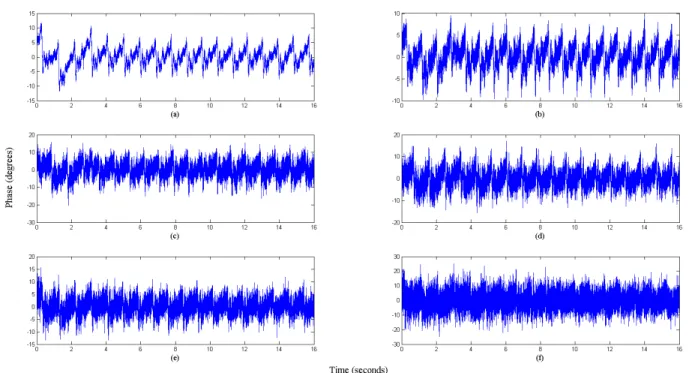
Figure 2 shows the phase variation of S21 due to the
heartbeats detected by the proposed microwave system for
several transmitted powers: 0 dBm (a), -5 dBm (b), -10 dBm (c), -15 dBm (d), -20 dBm (e), and -25 dBm (f).
!
, k,n
, 0
k
n
!(
)!
k nn
C
k n
k
=
!
"
"
#
!
Figure 2. Phase variations of S21 due to heartbeats detected at 16 GHz for 0 dBm (a), -5 dBm (b), -10 dBm (c), -15 dBm (d), -20 dBm (e), and -25 dBm (f)
The signal-to-noise ratio (SNR) decreases as the power of the transmitted signal decreases. The peaks of the signals can still be detected even for low power levels of the
transmitted signal. The effect of smoothing these signals is shown in Figure 3.
Figure 3. Phase variations of S21, after applying the smoothing technique, due to heartbeats detected at 16 GHz for 0 dBm (a), -5 dBm (b), -10 dBm (c), -15 dBm
4. Heartbeat Rate and Heart Rate Variability
Related works tend to extract the average heartbeat rate for a specific window. This does not provide information about the time-variation of the HR, i.e. the HRV. Thus, a peak detection technique is required to track the peaks of the signal. In this work, the heartbeat rate and the
HRV of the signals detected for different power levels are extracted. Values obtained from for original and smoothed signals, are compared to the HR and the HRV obtained from the ECG reference signal.
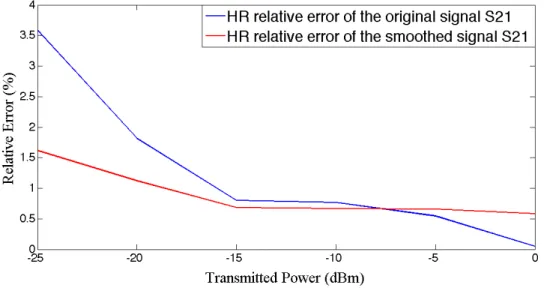
Figure 4 shows the HR relative error of the Doppler radar system with respect to the reference ECG signal. The effects of smoothing the signal are also shown in this figure.
Figure 4. HR relative error of S21 for both original and smoothed signals
It can be noticed that the heartbeat signals can be detected with relative error around 1.5% at 0 dBm, and the extracting of the HR is possible even at -25 dBm, with a relative error around 4%. Smoothing the signal decreases this relative error to 1.5%.
The HRV is a measure of the beat-to-beat variations (R-R interval for the ECG signal). HRV is regarded as an activity indicator of autonomic regulation of circulatory function; notice that controversy exists over whether this is an accurate metric for analyzing cardiovascular autonomic control [18-20]. The extraction of the heartbeat rate requires the use of simple averaging over a specific window. However, this lacks providing the time-variation of the heartbeat rate. On the other hand, the extraction of the heart rate variability requires peak-to-peak detection. Hence,
a Peak Detection Method (PDM) is used. This technique is based on tracking the maximum value in a sliding window, which is greater than a specific threshold. The size of the window is 2 seconds starting at the last peak detected in the preceding window. The minimum and maximum durations between two consecutive peaks are 0.5 and 1.5 seconds respectively. These values correspond to a heartbeat rate between 120 and 40 beats per minute.
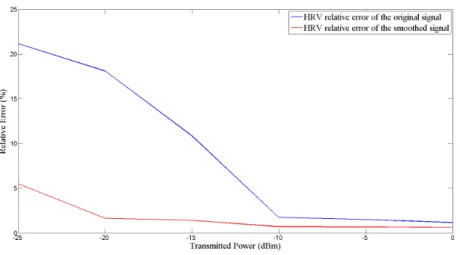
Figure 5 shows the HRV relative error of the Doppler radar system, for the phase of S21
parameter, with respect to the reference ECG signal. The effects of smoothing the signal are shown as well. The proposed system shows the possibility of detecting the peaks of the signal with high accuracy. The HRV relative error for S21
changes between 1.5 and 21%. On the other hand, smoothing the signal changes the HRV error to 1 and 6%.
Figure 5. HRV relative error of S21 for both original and smoothed signals
!
5. Conclusion
A microwave system is proposed in order to detect the heart beatings of a person from a distance of 1 meter. The phase variations of S21 parameter,
obtained with a VNA due to the heart activity, are extracted and compared to a simultaneous ECG signal. Results show the possibility of detecting the heartbeat activity and allow extracting the heartbeat rate and the heart rate variability. Measurements are performed at 16 GHz and for several transmitted power levels between 0 and -25 dBm. Beside its installation simplicity, the VNA provides the opportunity of testing several transmitted powers. Determining the minimum possible transmitted power would be safer for the patient and the medical staff.
Acknowledgments
The authors acknowledge CEDRE (project reference number: 08SciF6/L4), AUF (project reference number: G3-110/1649), and “Région Bretagne” for partially funding this work.
References
[1] H.-R. Chuang, Y. Chen, and K.-M. Chen, “Automatic clutter-canceler for microwave life-detection systems,”
IEEE Transactions on Instrumentation and Measurement, vol. 40, no. 4, pp. 747 –750, Aug. 1991.
[2] J. C. Lin, “Microwave sensing of physiological
movement and volume change: A review,”
Bioelectromagnetics (1992), vol. 13, pp. 557–565.
[3] A. De Groote, M. Wantier, G. Cheron, M. Estenne, and M. Paiva, “Chest wall motion during tidal breathing,”
Journal of Applied Physiology (1997), vol. 83, no. 5, pp.
1531-1537.
[4] G. Ramachandran and M. Singh, “Three-dimensional reconstruction of cardiac displacement patterns on the chest wall during the P, QRS, and T-segments of the ECG by laser speckle interferometry,” Medical and
Biological Engineering and Computing (1989), vol. 27,
no. 5, pp. 525-530.
[5] F. Mohammad-Zahed, F. Taghibakhsh and B. Kaminska, “Contactless Heart Monitoring,” 2007 IEEE,
Session 33: Biomedical Signal Processing-I, pp.
583-585.
[6] K. M. Chen, Y. Huang, J. Zhang, and A. Norman, “Microwave life-detection systems for searching human subjects under earthquake rubble and behind barrier”,
IEEE Trans. Biomed. Eng. Jan. 2000, vol. 47, no. 1, pp.
105–114.
[7] A. D. Droitcour, V. M. Lubecke, J. Lin, and O. Boric-Lubecke, “A microwave radio for Doppler radar sensing of vital signs,” in IEEE MTT-S Int. Microw. Symp. Dig., May 2001, pp. 175–178.
[8] A. D. Droitcour, O. Boric-Lubecke, V. M. Lubecke, and J. Lin, “0.25 mm CMOS and BiCMOS single chip direct conversion Doppler radars for remote sensing of vital signs,” in IEEE Int. Solid-State Circuits Conf. Tech.
Dig., Feb. 2002, pp. 348–349.
[9] O. Boric-Lubecke, G. Awater, and V. M. Lubecke, “Wireless LAN PC Card Sensing of Vital Signs,” IEEE
Topical Conference on Wireless Communication Technology (2003), pp. 206-207.
[10] Y. Xiao, J. Lin, O. Boric-Lubecke, and V. M. Lubecke, “A Ka-band low power Doppler radar system for remote detection of cardiopulmonary motion,” presented at the
27th IEEE Annu. Eng. Med. Biol. Soc. Conf., Sep. 1–4,
2005.
[11] C. Gu, C. Li, J. Lin, J. Long, J. Huangfu, and L. Ran, “Instrument-Based Noncontact Doppler Radar Vital Sign Detection System Using Heterodyne Digital Quadrature Demodulation Architecture,” IEEE Transactions on Instrumentation and Measurement,
Vol. 59, No. 6, pp. 1580-1588, June 2010.
[12] V. M. Lubecke, O. B. Lubecke, A. H. Madsen, and A. E. Fathy, “Through-the-wall radar life detection and monitoring,” in IEEE International Microwave Symposium, 2007, pp. 769-772.
[13] C. Li and J. Lin, “Random body movement cancellation in doppler radar vital sign detection,” IEEE Trans. on
Microw. Theory Techn., vol. 56, pp. 3143-3152, 2008.
[14] I. V. Mikhelson, S. Bakhtiari, T. W. Elmer, and A. V. Sahakian, “Remote sensing of heart rate and patterns of respiration on a stationary subject using 94-GHz millimeter-wave interferometry,” IEEE Transactions on
Biomedical Engineering, Vol. 58, Issue 6, pp. 1671 –
1677, 2011.
[15] A. A. Serra, P. Nepa, G. Manara, G. Corsini, and J. L. Volakis, “A single on-body as a sensor for cardiopulmonary monitoring,” IEEE Antennas and
Wireless Propagation Letters, Vol. 9, pp. 930-933,
[16] D. Obeid, S. Sadek, G. Zaharia, and G. El Zein, “Non-Contact Heartbeat Detection at 2.4, 5.8 and 60 GHz: A Comparative Study,” Microwave Opt. Technol. Lett., vol. 51, no. 3, pp. 666-669, March 2009.
[17] D. Obeid, S. Sadek, G. Zaharia, and G. El Zein, “Multitunable Microwave System for Touchless Heartbeat Detection and Heart Rate Variability Extraction,” Microwave Opt. Technol. Lett., vol. 52, no. 1, pp. 192-198, Jan. 2010.
[18] P. Joseph, U. R. Acharya, C. K. Poo, J. Chee, L. C. Min, S. S. Iyengar, and H. Wei, “Effect of reflexological stimulation on heart rate variability,” ITBM-RBM, vol. 25, pp. 40–45, 2004.
[19] A. Al-Hazimi, N. Al-Ama, A. Syiamic, R. Qosti, and K. Abdel-Galil, “Time-domain analysis of heart rate variability in diabetic patients with and with- out autonomic neuropathy,” Annals of Saudi Medicine, vol. 22, no. Nos 5-6, pp. 400–403, 2002.
[20] D. C. Lin and R. L. Hughson, “Modeling heart rate variability in healthy humans: A turbulence analogy,”
Physical Review Letters, vol. 86(8), pp. 1650–1653,