An Optical Emission Spectroscopy Study of Plasma-Precursor Interactions in Solution Precursor Plasma Spray
Jérôme Menneveux, Jocelyn Veilleux
Université de Sherbrooke, Sherbrooke (Québec), Canada
[email protected], [email protected]
Abstract
In this work, optical emission spectroscopy is used to study plasma-liquid precursor interactions in a plasma spray process. A mapping of the plasma jet is performed with a bundle of seven optical fibers while injecting various liquid precursors. The decomposition of two suspensions containing a titania (TiO2) powder in different solvents and that of one solution containing titanium butoxide are analyzed inside a radio frequency thermal plasma. For each precursor, the evolution of both temperature and titanium density along the plasma jet are observed. Two different plasma compositions were used to study their effects on the precursor decomposition. For each experiment, X-ray diffraction was performed on the collected powder to correlate OES observations with the structure and composition of the powder. Comparing these results brings a new understanding of the precursor decomposition inside the plasma, while the noted contrasts between water and ethanol as solvent, and between the use of a powder and that of an alkoxide as a source of titanium, help to assess the effect of these parameters on the plasma spray process.
Keywords
Solution precursor plasma spray, Suspension plasma spray, Plasma-precursor interactions, Optical emission spectroscopy, Titanium dioxide
Introduction
Solution precursor plasma spray (SPPS) and suspension plasma spray (SPS) are two processes capable of producing nanostructured coatings, resulting in improved properties such as a more durable thermal barrier coating [1]. SPPS is also a convenient process to synthesize nanopowders, with a good control over the nanoparticle composition [2]. Nevertheless, liquid injection brings a new complexity to the process since the injected precursors are undergoing several physical and chemical transformations before impinging the substrate. For example, the solvent evaporation consumes plasma energy and may change its physical properties (e.g. thermal and transport conductivity [3]). Furthermore, in SPPS, the injected precursor droplets are subjected to additional steps: first, the solvent evaporates, increasing the solution concentration, and then, the precursor precipitates, melts and partially evaporates [4]. The resulting coating microstructure highly depends on the history of the droplets inside the plasma and therefore the plasma parameters. For example, it has been shown that the precursor concentration and the solvent type have a strong influence on the porosity of the coating [5]–[8], while spraying distance and power played a role on the phase composition [7], [9]. As such, achieving a better control of SPPS requires a thorough understanding of these mechanisms.
Titanium dioxide is a material used for its photocatalytic property in diverse applications such as water treatment, air purification or biomedicine [10]. The photocatalytic property depends on the rutile and anatase phase ratio, so it is an interesting material to investigate. Three different precursors are studied with two plasma compositions, with and without oxygen. To discern the effect of the solvent, two suspensions containing a TiO2 nanopowder in water and in ethanol will be compared. The third precursor consists in a solution of titanium butoxide in ethanol, enabling the comparison between a suspension and a solution.
Optical emission spectroscopy (OES) being a non-invasive tool, it is used to observe several atomic and molecular emission lines, enabling the study of the precursor transformations inside the plasma through temperature and qualitative composition measurements. A complete OES mapping of the plasma jet is accomplished for these three precursors and subsequent signal processing provides the plasma temperature and its relative composition. Results are discussed in regard to their relevance for the improvement of the understandings of the process which lead to a better reproducibility; it can also be a starting point for modelling work.
Experimental set-up and Methods Experimental set-up
Three different liquid precursors have been studied: two suspensions and one solution. The suspensions contain a TiO2 powder (Aeroxide TiO2 P25 from Degussa), with an average particle size of 21 nm and an anatase to rutile phase ratio of 80:20, dispersed in water and
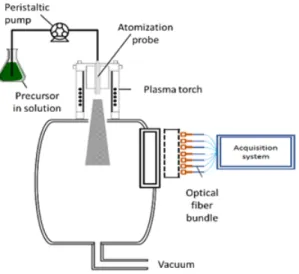
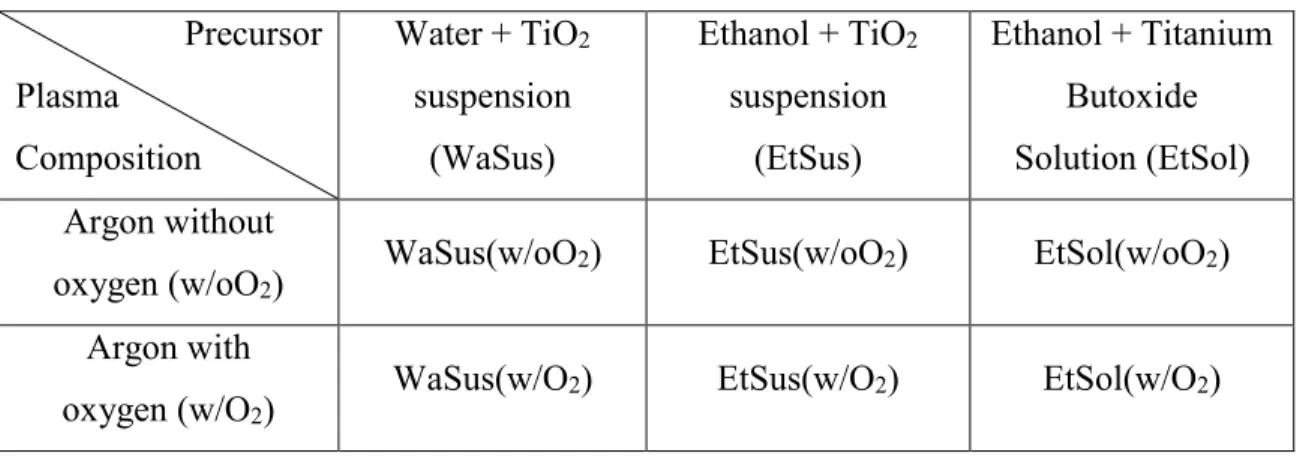
in ethanol. The solution consists of titanium butoxide (Sigma-Aldrich) dissolved in ethanol. Each precursor contains 2 wt. % of titanium. The plasma is generated with a radio frequency torch (Tekna model PL50) connected to a 3 MHz Lepel RF power supply. The suspensions and the solution are axially injected within the core of the plasma jet with an atomizing probe fed by a peristatic pump. To avoid plasma jet perturbations, a small liquid feed rate of 3 mL/min was selected to perform OES studies. The power was set to 25.5 kW, the chamber pressure to 230 torr and two different gas compositions were employed: one of pure argon (21 SLPM for the central gas, 75 SLPM for the sheath gas and 10 SLPM for the atomization gas) and one containing a mixture of argon and oxygen (21 SLPM of Ar for the central gas, 55 SLPM of Ar and 40 SLPM of O2 for the sheath gas and 10 SLPM of Ar for the atomization gas). The experiments are summarized in Table 1.
For the purpose of these OES experiments, there is no substrate onto which a coating would be deposited. Instead, the free stream of precursors will form a powder, which was collected from the wall of the chamber. X-ray diffraction was performed with an X’Pert Pro Multi Purpose Diffractometer from PANanalytical using the CuKα1 radiation (1.541 Å) and a PIXCel detector. The software used for the analysis was HighScore Plus (v3.0.5) by PANanalytical.
Optical Emission spectroscopy material and procedures
OES is performed with an IsoPlane SCT 320 spectrograph (Princeton Instruments) connected to a PIXIS:256E CCD camera. The grating has 1800 grooves/mm, allowing a resolution of 0.037 nm and covering a spectral range of 38 nm. Wavelength and relative
intensity calibration have been performed with the Intellical lamp (Princeton Instruments). The light is collected with a fiber bundle (Leoni) containing 7 optical fibers spaced vertically from each other with a distance of 1.5 cm (see Fig. 1). At the end of each fiber, a collimating lens captures a straight beam of light with an estimated radius of 1.5 mm. The upper fiber is located at the nozzle exit height. Due to the lack of axisymmetry, no Abel inversion was performed; the measured values correspond to an average along a cord. Because the precursor injection is pulsed (peristaltic pump), the plasma conditions alternate between periods without and with precursor injection. Therefore, to record a whole sequence, a long acquisition time was used (roughly 200 ms, depending on the experiment) and 20 images were averaged for each spectrum.
The intensity of a line detected with OES is a function of the corresponding element density and of its excitation temperature. Assuming that the excitation distribution of the atomic element follows a Boltzmann distribution, the emitted intensity is defined by the equation 1: 𝐼𝑝𝑞 = ℎc 4𝜋λ𝐴𝑝𝑞 𝑛0(𝑇) 𝑍(𝑇) 𝑔𝑝𝑒 −𝐸𝑝𝑘𝑇 (eq.1)
with the intensity Ipq corresponding to a transition from the upper level p to the lower level q, λ is the wavelength, gp the statistical weight, Apq the transition probability, Ep the energy
level, k the Boltzmann constant, T the excitation temperature, Z(T) the partition function,
n0(T) the total density of the element, c the speed of light and h the Planck constant. The value of gp and Apq are taken from the NIST database [11] and the partition function is
method to measure the excitation temperature [13]–[15] and was used in this study. Briefly, the method consists in reorganising the equation (1) as follows:
ln (𝐼𝑝𝑞λ𝑝𝑞 𝑔𝑝𝐴𝑝𝑞) = − 𝐸𝑝 𝑘𝑇𝑒𝑥𝑐+ ln ( 𝑛0(𝑇)ℎ𝑐 4𝜋𝑍(𝑇)) (eq. 2)
Considering many titanium lines from the wavelength interval 400-600 nm, it is possible to draw a diagram of the left term of equation 2 as a function of Ep, and to measure Texc
from the slop of the resulting line (see fig. 2). The uncertainty of the temperature is evaluated using the quality of the fit. In this survey, the R2 of each spectrum is about 0.9.
To study the decomposition of the precursor inside the plasma, it is important to measure the evolution of the elemental density inside the plasma jet. To do so, knowing the temperature and rearranging again the equation 1, it is possible to isolate the density n0:
𝑛0(𝑇) ∝ 𝑍(𝑇)𝜆𝑝𝑞 𝐴𝑝𝑞𝑔𝑝 𝑒 𝐸𝑒𝑥𝑐 𝑘𝑇 ⁄ (eq. 3)
Only titanium lines coming from the neutral and first ionization states have been observed, so the total titanium density is assumed to be the sum of the Ti I and the Ti II densities. Because only a relative intensity calibration has been performed, it is possible to qualitatively examine the evolution of the density, as opposed to obtaining an absolute value.
To probe the gas temperature of the precursors, when possible, a fitting of the diatomic molecular emission bands coming from C2 and TiO was performed. To simulate their spectrum, the vibrational and rotational temperature were supposed equal and the method and spectroscopic data of Parigger [16] were employed. Once the spectrum was simulated, the following quantity was minimized to find the molecular temperature [17]:
𝜒2(𝑇) = ∑ (𝐼𝑖 𝑒𝑥𝑝 − 𝐼𝑖𝑡ℎ(𝑇))2 𝑁 𝑖=1 𝑁(𝑁−1) (eq. 4) With 𝐼𝑖𝑒𝑥𝑝and 𝐼
𝑖𝑡ℎ(𝑇) corresponding to the experimental and to the simulated intensity of the spectrum at the wavelength i, respectively. N is the number of points (or wavelengths) considered for each fit and T is the temperature. For the C2 molecule, the swan band with Δν=0 was chosen, whereas for the TiO molecule, the γ-band Δν=0 was used. Figure 3 shows examples for the two molecules. Here again, the uncertainty was evaluated with the quality of the fit.
Results and discussions
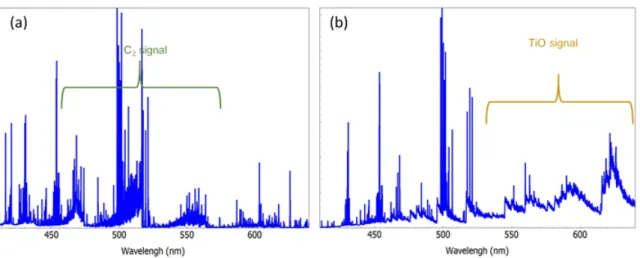
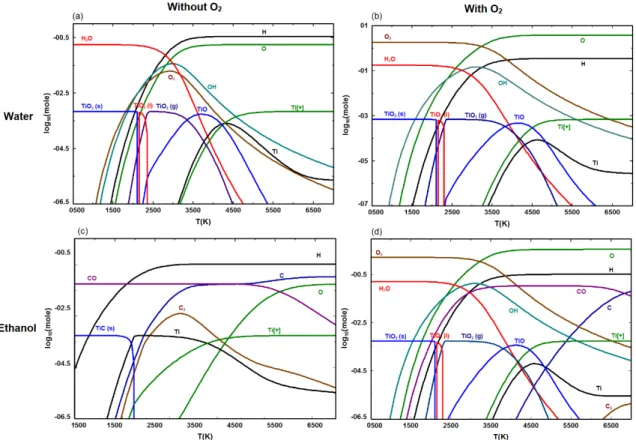
For all experimental conditions (precursors and gases), the titanium lines were visible from the exit of the nozzle, meaning that the evaporation of the solvent was complete and that at least a portion of the precursors had begun to decompose. Oxygen is a parameter having a strong influence on the recorded spectra. Indeed, for the experiment with ethanol as solvent without oxygen (EtSus(w/oO2) and EtSol(w/oO2)), it can be seen on figure 4(a) that there is a strong signal coming from the emission of the C2 molecule. On the other hand, when oxygen is added (EtSus(w/O2) and EtSol(w/O2)), this signal vanishes (fig. 4(b)) and a signal coming from the TiO molecule appears. To understand this observation and to get a better insight of the physicochemical dynamics occurring inside the plasma, it is possible to compute the expected plasma composition at thermodynamic equilibrium by minimizing the Gibbs free energy of the system, knowing the exact amount of the different species injected. This computation was carried with the module EQUILIB of the software FactStage (version 7.2), with the elemental composition of the experiments WaSus(w/oO2), WaSus(w/O2), EtSus(w/oO2) and EtSup(w/O2) (see fig. 5). The diagrams
of experiments EtSol(w/oO2) and EtSol(w/O2) are similar to the EtSus(w/oO2) and EtSus(w/O2) diagrams, respectively, and are not presented. Although the hypothesis of thermodynamic equilibrium is, most likely, not met, the simulations can be used as an indication of which physical phenomena and chemical reactions are occurring. For the case WaSus(w/oO2) and WaSus(w/O2) (fig. 5 (a) and (b)), the major difference resides in the stability of the TiO and TiO2 molecules. Indeed, the excess of oxygen maintains TiO2 and TiO stable at higher temperature ranges, over 2400-3600 K and 3600-4500 K, respectively. Without oxygen, these temperature ranges are lowered to 2400-3200 K for TiO2 and to 3200-4200 K for TiO. Consequently, with oxygen, the titanium atomic density increases only at higher temperatures. When ethanol is the solvent (fig. 5 (c) and (d)), the differences become more important. Even if the thermodynamic database misses the liquid and vapor phase of titanium carbide (the exact state of titanium may not be accurate), the evolution of the carbon-containing species provides useful information. Without oxygen, the thermodynamically stable phase for titanium becomes TiC, and it is energetically favorable for the oxygen to bind with carbon. As such, the CO density stays constant up to 4500 K and remains equivalent to the amount of oxygen injected. For carbon atoms unable to bind with an oxygen atom, one of the preferred form is the C2 molecule, explaining the signal on figure 4 (a). When oxygen is added in excess, C2 is no longer the most stable molecule and its density becomes negligible; all the carbon atoms easily bind to one or two oxygen atoms, and TiO2 and TiO appear as the most stable forms for titanium at temperatures below 4500 K. This thermodynamic argument explains quite well the observation made on figure 4 (b).
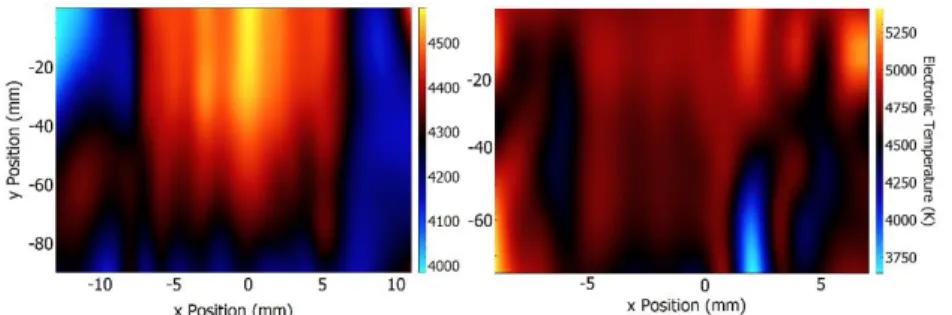
Another interesting remark concerns the evolution of the titanium density. Without oxygen, TiO and TiO2 are not the stable phases and decompose very rapidly and the amount of elemental titanium increases very quickly, even at low temperature (under 2000 K). As such, when the precursor evaporates inside the plasma, whether it is TiO2 coming from the powder (EtSus(w/oO2)) or pyrolyzed titanium butoxide (EtSol(w/oO2)), TiO2 will not be stable and will have the tendency to form elemental titanium immediately. This titanium density stays constant up to 3700 K, where the ionized form appears. With oxygen, TiO and TiO2 molecules are more stable and decompose only after 4500 K. In this case, the dynamic is different: the TiO2 vapor surrounded by the excess of oxygen will not immediately break down into Ti and oxygen but will continue to be warmed by the surroundings. The immediate effect is that titanium density is lower in this range of temperatures when compared to the case without oxygen. This statement agrees with experimental observations (see fig. 6). Indeed, considering that the maximum excitation temperatures are in the same range (around 4500 K for EtSol(w/oO2) without oxygen, and 5000 K for EtSus(w/O2) with oxygen), the acquisition time for the experiments EtSus(w/O2) and EtSol(w/O2) had to be almost twice as long compared to EtSus(w/oO2) and EtSol(w/oO2) to obtain roughly the same intensity values for Ti I and Ti II, which are the brightest lines in the wavelength range 410-640 nm (fig. 4). The two mappings of figure 6 are completely different. For the EtSol(w/O2) case, a hot central part is distinguishable and the x and y dimensions are larger than in the EtSol(w/O2) case because in this area, the signal coming from Ti I and Ti II were sufficiently higher than the noise to perform the OES temperature measurements. Only a small portion near the edges gives aberrant values. In comparison, the excitation temperatures in EtSol(w/O2) are between 4500-5000 K, and
it appears to be constant almost everywhere, except on a bottom part where the value seems too small. To explain these differences, data from figure 5 and the fact that the plasma is likely out of thermodynamic equilibrium must be considered. When in flight, the precursors keep being evaporated, breaking into smaller molecules and getting warmed by the surroundings; not all the vapor coming from the precursor has thermalized. At equilibrium, the temperature range where the elemental titanium can exist in the experiment EtSol(w/O2) is reduced (from 4500 K to 5500 K), a range probably quite high for the plasma power used (25 kW). It implies that only a small amount of this vapor effectively reaches this temperature range, explaining the smaller intensity of the Ti I line observed and the uniform temperature map, without a hot region in the center. For the experiment EtSol(w/oO2), it is the opposite: Ti I exists over a large temperature range (1200 K to 4800 k) which allows the temperature to be measured over a broader vapor phase region.
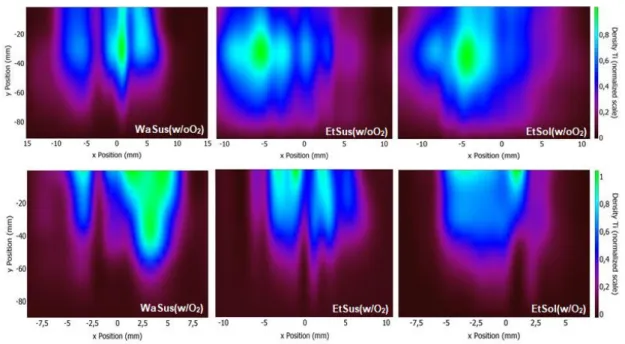
Knowing the excitation temperature, the titanium density was computed using the equation 3 for the 6 experiments and is represented on figure 7. Confirming the above discussion, it is clear that the titanium density is maximum for the EtSus(w/O2) and EtSol(w/O2) experiments at the upper part of the stream, where the plasma temperature is the hottest (see fig 8) and where the titanium vapor phase can reach a temperature high enough to prevent its immediate recombination with an oxygen atom. Downstream, when the temperature decreases, the density drops. For the case of WaSus(w/oO2), EtSus(w/oO2) and EtSol(w/oO2), because of the lack of oxygen, the titanium atom cannot recombine
easily, so the density keeps growing with the decomposition of the precursor and reaches a maximum further downstream.
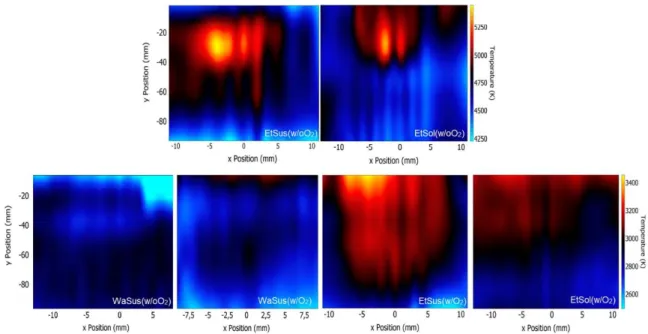
To study the evolution of the gas temperature, figure 8 represents the temperature maps for the cases EtSus(w/oO2) and EtSol(w/oO2) as obtained using a C2 molecular fit. Two main comments can be made: i) the temperature for the case EtSus(w/oO2) seems slightly higher than the EtSol(w/oO2) one, probably because it takes more energy to break the titanium butoxide than the TiO2 powder; ii) in both cases, the maximum temperature is not at the nozzle exit but in the middle of the plasma stream. If the highest temperature for the C2 molecule is reached in the middle of the stream, it means that there is an energy balance between the heat received from the hot plasma gas and the energy lost by radiation or transferred to the precursor. When the temperature of the argon becomes too weak, the C2 starts to lose more energy than it receives. Plus, following the remarks made for figure 7, the decomposition of the precursor continues at this distance, freeing oxygen atoms that can recombine with carbon and bring a source of energy. For the cases WaSus(w/oO2), WaSus(w/O2), EtSus(w/O2) and EtSol(w/O2), the measurements have been performed with the TiO molecular fit. Similarly, the highest temperature is EtSus(w/O2), because ethanol requires less energy to evaporate than water and because the TiO2 powder takes less energy than the titanium butoxide to decompose. When the solvent is water, the temperature is noticeably lower since water takes more energy to evaporate than ethanol. To explain why the plasma temperature (with and without oxygen) is higher with a suspension as the precursor, a reasonable explanation would be to consider the precursor molar injection rate. For the suspension, 5.4 × 10⁻⁴ mole/min of TiO2 is injected compared to 5.5 × 10⁻⁴ mole/min
of C16H36O4Ti (titanium butoxide) for the solution. As such, there is much more to heat, decompose, dissociate, and ionize with titanium butoxide than with TiO2. That consumes energy and lowers the temperature. Future work will investigate higher precursor concentrations to better highlight this effect. With the current concentration, the temperature differences are likely within the range of the measurement uncertainty. For the cases with oxygen and ethanol as solvent, one observes of figure 8 that the maximum temperature is located at the upper part of the plasma, likely because carbon is oxidized very rapidly into CO and CO2 in presence of an excess of oxygen. Although the injection of oxygen changes the properties of the plasma and there is no reason for the experiment EtSus(w/oO2)-EtSus(w/O2) and EtSol(w/oO2)-EtSol(w/O2) to have the same temperature profiles, one should note that there is a strong difference between the C2 and the TiO temperature maps. This could be explained by noticing that most of the C2 comes from the solvent and starts to be vaporized and excited by the plasma sooner than the TiO coming from the solid or alkoxide precursors.
Lastly, a powder was collected for all experiments (except for WaSol(w/oO2), where not enough powders were produced) and has been analyzed by X-ray diffraction. Figure 9 shows the diffractograms for the cases without and with oxygen. The reference powder is the powder used for the suspensions. When no oxygen was added, the powders coming from the experiment EtSus(w/oO2) was altered: the TiO2 anatase phase was transformed and new phases were created such as a carbide (TiC) and reduced oxides (Ti3O5 and Ti2O3). Part of the decomposed titanium dioxide has failed to recombine in a stoichiometric proportion with oxygen, and some of it did recombine with carbon. The case EtSol(w/oO2)
is surprising because it seems that the collected powder is composed only of rutile and TiC, but no other oxide was formed. These two results confirm the previous observation that TiO2 was not thermodynamically stable and decomposed. For the case with oxygen, the three experiments produced only TiO2, with a presence of the two main phases (anatase and rutile). This result is consistent with the observation of the TiO molecule and the result of figure 5, demonstrating that TiO2 was stable at this temperature. Using a formula proposed elsewhere [18], it is possible to quantify the percentage of anatase and rutile phases in the powder:
𝐴𝑛𝑎𝑡𝑎𝑠𝑒% = 79𝐼𝑎
𝐼𝑟+0.79𝐼𝑎 (eq. 5)
Where Ia is the (101) peak of anatase and Ir is the (110) peak of rutile. For the suspension
with water as solvent, the anatase content is 71%, while it is 65% with ethanol. The original anatase content of the powder is 80% according to Degussa, while calculations performed with equation 5 indicated 84% for that reference powder. It is known that anatase is a metastable phase formed at high temperature and that it needs a rapid quench to be observed at room temperature [19]. With ethanol as solvent (EtSus(w/O2)), the plasma was hotter than with water (WaSus(w/O2)). One can expect to observe more of the powder in suspension to be melted and evaporated, but due to gas recirculations surrounding the plasma jet, the quench was not fast enough to reform as much anatase as in the original powder. Therefore, the global amount of anatase dropped more for EtSus(w/O2) than for WaSus(w/O2). Following that argument, the amount of anatase in the powder resulting from EtSol(w/O2) was 61%. In that case, TiO2 is entirely formed within the plasma from the decomposition of titanium butoxide, and much less than 80% of the formed TiO2 is quenched fast enough to form anatase. From those correlated OES-XRD observations, it is
possible to infer information about the final product based on the OES observation of diatomic molecules.
Conclusion
Interactions between three different liquid precursors and an argon plasma with and without oxygen have been studied using OES. Using thermodynamic computations to predict the composition of the system at different temperatures, it has been possible to explain the observation made with OES and to bring a new understanding of the evolution of a liquid precursor inside a plasma for the SPS and SPPS processes. In particular, it has been shown that observing the emission bands of diatomic molecules and correlating those observations to their predicted densities over a given temperature range is a viable way to study the physicochemical dynamics of such a complex system. The effect of the solvent and that of the precursors on the plasma temperature maps have been studied and it was concluded that using a metal alkoxide costs more energy than a nanopowder suspension, in addition to the anticipated result that water significantly cools the plasma when compared to ethanol. It has also been shown that using ethanol as a solvent brings carbon atoms to the system and leads to new chemical reactions within the plasma. Future works will investigate the effect of plasma power to build composition versus temperature maps using OES and correlating those results to simulations. The characterization of the final product (synthesized powder and eventually deposited coatings) is essential to bridge OES observations with the resulting material microstructure and properties.
Acknowledgements
The financial support by the Fonds de recherche du Québec - Nature et technologies (FRQNT), the Natural Sciences and Engineering Research Council of Canada (NSERC), and Université de Sherbrooke is gratefully acknowledged. The authors also appreciate the technical support from Kossi Béré.
References
[1] M. Gell, L. Xie, X. Ma, E. H. Jordan, and N. P. Padture, “Highly durable thermal barrier coatings made by the solution precursor plasma spray process,” Surf. Coat.
Technol., 2004, 177–178, p 97–102.
[2] S. Bastien and N. Braidy, “Controlled synthesis of nickel ferrite nanocrystals with tunable properties using a novel induction thermal plasma method,” J. Appl. Phys., 2014, 114(21), p 1–8.
[3] B. Pateyron, N. Calve, and L. Pawlowski, “Influence of water and ethanol on transport properties of the jets used in suspension plasma spraying,” Surf. Coat.
Technol., 220, 2013, p 257–260.
[4] P. Fauchais, A. Joulia, S. Goutier, C. Chazelas, M. Vardelle, A. Vardelle, and S Rossignol “Suspension and solution plasma spraying,” J. Phys. D. Appl. Phys., 2013,46(22).
[5] D. Chen, E. H. Jordan, and M. Gell, “Effect of solution concentration on splat formation and coating microstructure using the solution precursor plasma spray process,” Surf. Coatings Technol., 2008, vol. 202(10), p 2132–2138.
[6] D. Chen, E. H. Jordan, M. Gell, and X. Ma “Dense TiO2 Coating Using the Solution Precursor Plasma Spray Process,” Am. Ceram. Soc., 2008, 91(3), p 865–872. [7] D. Chen, E. H. Jordan, and M. Gell, “Porous TiO2 coating using the solution
precursort plasma spray process,” Surf. Coatings Technol., 2008, 202(24), p 6113– 6119.
[8] D. Chen, E. H. Jordan, and M. Gell, “The solution precursor plasma spray coatings: Influence of solvent type,” Plasma Chem. Plasma Process., 2010, 30(1), p 111–119. [9] L. Du, T. W. Coyle, K. Chien, L. Pershin, T. Li, and M. Golozar, “Titanium Dioxide Coating Prepared by Use of a Suspension-Solution Plasma-Spray Process,” J.
Therm. Spray Technol., 2015, 24(6), p 915–924.
[10] D. A. H. Hanaor and C. C. Sorrell, “Review of the anatase to rutile phase transformation,”, J. Mater Sci, 46(4), p 855–874.
[11] “National institute of standards and technology http://physics.nist.gov/PhysRefData/ASD/lines_form.html.”.
[12] A. W. Irwin, “Polynomial partition function approximation of 344 atomic and molecular species,” Astrophys. J. Suppl. Ser., 1981, 45, p 621–633.
[13] N. K. Joshi, S. N. Sahasrabudhe, K. P. Sreekumar, and N. Venkatramani, “Variation of axial temperature in thermal plasma jets,” Meas. Sci. Technol., 1997, 8(10), p 1146–1150.
[14] F. Bourg, S. Pellerin, D. Morvan, J. Amouroux, and J. Chapelle, “Study of an argon-hydrogen RF inductive thermal plasma torch used for silicon deposition by optical emission spectroscopy,” Sol. Energy Mater. Sol. Cells, 2002, 72(1–4), p 361–371. [15] G. Mauer and R. Vaßen, “Plasma Spray-PVD: Plasma Characteristics and Impact
on Coating Properties,” J. Phys. Conf. Ser., 2012, 406, p 1-12.
[16] C. G. Parigger, A. C. Woods, D. M. Surmick, G. Gautam, M. J. Witte, and J. O. Hornkohl, “Computation of diatomic molecular spectra for selected transitions of aluminum monoxide, cyanide, diatomic carbon, and titanium monoxide,”
Spectrochim. Acta - Part B At. Spectrosc., 2015, 107, p 132–138.
[17] J. Hermann, A. Perrone, and C. Dutouquet, “Analyses of the TiO-γ system for temperature measurements in a laser-induced plasma,” J. Phys. B At. Mol. Opt.
Phys., 2001, 34(2), p 153–164.
[18] R. A. Spurr and H. Myers, “Quantitative Analysis of Anatase-Rutile Mixtures with an X-Ray Diffractometer,” Anal. Chem.,1957, 29(5), p 760–762.
[19] Y. Li and T. Ishigaki, “Thermodynamic analysis of nucleation of anatase and rutile from TiO2 melt,” J. Cryst. Growth, 2002, 242(3), p 511–516.
Figures
Figure 4: Examples of spectrum coming from the upper part of the plasma for the experiments (a) EtSol(w/oO2) and (b) EtSol(w/O2).
Figure 5: Compositions at thermodynamic equilibrium of the plasma (a) WaSus(w/oO2) (b) WaSus(w/O2), (c) EtSus(w/oO2) and (d) EtSus(w/O2) as a function of temperature.
Figure 6: Excitation temperature mapping of Ti I for the experiment EtSol(w/oO2) (left) and EtSol(w/O2) (right).
Figure 8: C2 molecular temperature for EtSus(w/oO2) and EtSol(w/oO2) (at the same scale) and TiO molecular temperature of WaSus(w/oO2), WaSus(w/O2), EtSus(w/O2) and EtSol(w/O2) measured (at the same scale).
Figure 9: Diffractograms of the collected powder without oxygen (left) and with oxygen (right). (a) EtSus(w/oO2), (b) EtSol(w/oO2), (c) WaSus(w/O2), (d) EtSus(w/O2) and (e) EtSol(w/O2).
Table 1: Identification of the different precursor and plasma compositions Precursor Plasma Composition Water + TiO2 suspension (WaSus) Ethanol + TiO2 suspension (EtSus) Ethanol + Titanium Butoxide Solution (EtSol) Argon without
oxygen (w/oO2) WaSus(w/oO2) EtSus(w/oO2) EtSol(w/oO2) Argon with