Geoff K Nicholls
1(corresponding) and Robin J. Ryder
21 Statistics Department, University of Oxford, 1 South Parks Road, Oxford
OX13TG, UK, nicholls@stats.ox.ac.uk
2 Centre De Recherche ´Economie et Statistique, ENSAE
Abstract:Kitchen et al. (2009) analyze a data set of lexical trait data for twenty five Semitic languages, including ancient languages Hebrew, Aramaic and Akka-dian, modern South Arabian and Arabic languages and fifteen ethiosemitic lan-guages. They estimate a phylogenetic tree for the diversification of lexical traits using tree and trait models and methods set up for genetic sequence data. We reanalyze the data in a homplasy-free model for lexical trait data. We use a prior on phylogenies which is non-informative with respect to some of the key scien-tific hypotheses (concerning topology and root time). Our results are in broad agreement with those of Kitchen et al. (2009), though our 95% HPD for the root of the Semitic tree (the branching of Akkadian) is [4400,5100]BP and we place Moroccan and Ogaden Arabic in the Modern South Arabian Group.
Keywords: Bayesian Phylogenetics, Cultural traits, Languages
1
Data and problem statement
Kitchen et al. (2009) give a Bayesian phylogenetic analysis of lexical trait data for L = 25 Semitic languages: Ugaritic, Ge’ez, and the languages shown in Figure 2. The data are homology classes of words from the core vocabulary, allowing just a small variation in meaning within a class. Thus the English ‘all’ and Dutch ‘alle’ meaning all are homologous, but in a dis-tinct class from Spanish ‘todas’ and Italian ‘tutte’. They gathered words in K = 96 meaning categories and grouped these words in N = 673 homology classes. They find evidence that Akkadian is an outgroup. This supports an independent hypothesis that these languages diversified from a ‘home-land’ in the north west of modern Syria. Our analysis is consistent with this result. However, the uncertainty is substantial.
Bayesian phylogenetic studies of this data type (Gray et al. (2003)) use models and software from genetics. Model assumptions, including the tree itself, are rejected by historical linguists (McMahon et al. (2005)). Cri-teria related to parsimony are applied in tree and network visualisation tools (Ringe et al. (2002), Bowern (2010)). These tools support the com-parative method, allowing the user to intervene in the analysis, and are assumed to be free from modeling assumptions. There are few attempts to quantify uncertainty numerically. They work with heterogeneous data
types, including traits for word phonology and morphology. Most Bayesian analyses (including our own) model just the lexical traits.
Kitchen et al. (2009) register the data as a 25 × 673 binary matrix D, with Di,j = 1(0) if language i possesses (lacks) a word in homology class j, and
Di,j =? if this is not known. Obvious loan words have been removed from
the data. The published data fill empty meaning categories with a missing value. Ringe et al. (2002) register loan words as isolated cognates, while Bowern (2010) leaves identified loan words in the data. This is preferred. The reconstructed phylogeny is constrained to fit historically known dates (calibration data). The Akkadian vocabulary data come from Assyrian texts from 2700-2900 years Before Present. The biblical Aramaic is 1700-1900BP, Ge’ez is 1600-1800BP, ancient Hebrew 2500-2700BP and Ugaritic 3300-3500BP. The times at which some vocabularies branched from their parent is fixed: the origin of ancient Hebrew is 3200-4200BP, the origin of Ugaritic 3400-4400BP, Aramaic 2850-3850BP and Amharic 700-1700BP. Kitchen et al. (2009) cite sources. Modern languages have age zero. The substitution model which Kitchen et al. (2009) fit allows a single word to come into existence with the same meaning independently in several locations, and ancient words to be revived, at relative rates which are not controlled by the data. It is a finite sites model for character substitution developed as a model for character substitution in DNA base character sequences, adapted for generic traits by Lewis (2001). We check their results using a homoplasy-free model for trait evolution and check goodness of fit.
2
Models and Methods
We model the core vocabularies as sets, and the tree as a branching process of sets, with set elements (words) undergoing a birth and death process. The stochastic Dollo model of Nicholls et al (2008) has word birth according to a Poisson process of constant rate λ. Words are copied into child languages when a language branches. Each word in each language dies at constant rate µ. Ryder et al (2011) add rate heterogeneity via a catastrophe process. Point-like catastrophes are realized on the tree in a Poisson process with rate ρ. When a vocabulary enters a catastrophe, each word in the set dies with probability κ. A Poisson number of words with mean ν are born. If ν = κλ/µ, then one catastrophe equals − log(1 − κ)/µ years in the birth death process. Ryder et al (2011) show how to sum over missing data. In this model, the probability that we cannot determine whether language i = 1, 2, ..., L contains a word in homology class j = 1, 2, ..., N is ξi. This
parameter varies from one language to another.
The parameters are the tree g = (E, t, k) (edge set E, node ages t = (t1, ..., t2L−1), and k = (k1, ..., k2L−2) the number of catastrophes on each
edge), the rates λ, µ and ρ, and the probabilities ξi, i = 1, 2, ..., L and
uniformly distributed up to U a fixed maximum (our U = 16000BP is very conservative). The distribution over topologies is approximately uniform. This weighting is available in MrBayes (Huelsenbeck et al. (2001)) also. Let Γ be the set of all trees g consistent with the calibration data. Fix a tree g = (E, t, k), and let Tg = {t′; (E′, t′) ∈ Γ, E′ = E} be the set of
admissible node age vectors. For ancestral node i, s+i (g) = sup{ti; t ∈ Tg}
and s−
i (g) = inf{ti; t ∈ Tg} give the greatest and least ages node i can take
given g. Let F (g) = {i ∈ 1, 2, ..., 2L − 1; s+i (g) = U, i 6= R}. These are the
‘free’ nodes in g with ages in g bounded only by U . Let Z(g) be the number of distinct complete orderings ti1 < ti2< ... < ti2L−1 achievable for t ∈ Tg.
The probability density on trees g ∈ Γ given by
fG(g) ∝ Z(g) Y i∈F(g) tR− s − i (g) U − s− i (g) −1
has marginal distributions on topologies and root age that are approxi-mately marginally uniform. Topology is conditionally approxiapproxi-mately uni-form given root age and vis versa. These results are exact if all leaves have equal fixed time and there are no calibration constraints. Probability pa-rameters have U (0, 1) priors. The catastrophe rate ρ has a Gamma prior. It varies from 1/1000 (the scale of edge length), and 1/25000 years (the scale of tree length), in the prior 90% interval. The λ- and µ-priors are proportional to 1/µλ. The unknown birth and death times of words on the tree, and λ, are integrated analytically, and the remainder using MCMC. We check for model mispecification. First, we simulate posterior predic-tive distributions for ’singleton’ columns of the data. These are cognates displayed in just a single language. We remove singletons and correct the likelihood, fit the remaining data and then predict singletons and com-pare predictions with the reserved data. Secondly, we remove historically attested constraints and check that we can recover them, using the Bayes factor to compare models with and without the constraint. Ryder et al (2011) give a stable estimator related to the Savage-Dickey ratio. Thirdly, we check that results are insensitive to omitting leaves. The model error arising where language i has loan words from language j is removed if lan-guage j is removed. We fit data simulated out of model (including loan words). We found date estimation to be fairly robust, tree topology less so.
3
Results and Conclusions
A Bayesian cross validation analysis of the ten calibration constraints on the full data (KEAM-25) showed problems with the fit. The historically attested constraints on the branching of Biblical Aramaic and the leaf ages for Ugaritic and Ge’ez were rejected. There was strong support for catas-trophe events on the branches above Ugaritic. There was very little rate
heterogeneity elsewhere on the tree (except above Ge’ez). These catastro-phes are artifacts of model misfit. We treat the Ugaritic and Ge’ez data as outliers and remove them (KEAM-23). This improves the fit. We found little evidence for rate heterogeneity in these data. The posterior probabil-ity for zero catastrophes is 0.33 against 0.01 in the prior. As part of our goodness of fit we drop eight more languages from the tree (KEAM-15, with Tigre, Tigrinya, Amharic, Argobba, Geto, Chaha, Zway, Walani, He-brew, Aramaic, Akkadian, Moroccan Arabic, Ogaden Arabic, Jibbali and Soqotri) and check results are robust.
Cross-validation of the KEAM-23 data gave Bayes factors in favor of the constraint as follows: ’All’ 3.9, ’Akkadian’ 0.5, ’Amharic branching’ 2, ’Ara-maic’ 0.3, ’Aramaic branching’ 6, ’Hebrew’ 1.8, ’Hebrew branching’ 1.8. See Figure 1. The least Bayes factor is 0.3 so we reject no historically attested
2000 4000 6000 8000 10000 12000 14000 All Akkadian Amharic branching Aramaic Aramaic branching Hebrew Hebrew branching age [years BP] 5 10 15 20 25 −50 −40 −30 −20 −10 0 10 20 30 40 50
# languages displaying cognate
frequency, predicted − observed
FIGURE 1. (Left) Bayesian cross-validation check on the model for KEAM-23 data. (top thin bars) Calibration constraint. (bottom thick bars) 95% HPD in-terval for constrained age estimated in an analysis with the single constraint removed. (centre long bars) 95% highest prior density interval estimated in a prior simulation with the single constraint removed. (Right) Posterior predictive distributions (predicted-observed, with 95% envelope) for the number of traits displayed at two, three up to twenty three leaves.
constraint. The bottom bar for ’All’ gives the posterior HPD interval for the age of the root. The 95% HPD for the root age in Semitic (KEAM-23) is [3800, 5100]BP. Kitchen et al. (2009) report [4400, 7400]BP. There is an extra bound of [4350, 8000]BP. With this we have [4400, 5100].
Posterior predictive 95% HPD intervals for the data for traits at single leaves show that 11 of the 23 reserved singleton counts fall below the 95% HPD predictive interval. The conflation of loan words with unidentified missing data depletes the number of singletons. We remove the singleton
data, as it is unreliable. The fit to the frequency distribution of the more commonly occurring cognates, in Figure 1 (Right), is good. There is a small excess of high frequency words: a small number of words evolve at rates lower than the bulk rate. Unidentified loan words inflate the number of frequently occurring words and must be rare.
The consensus tree for KEAM-23 (Figure 2) is very like the consensus tree
Gafat Argobba Amharic
Harari Zway Walani Soddo Mesmes Mesqan Innemor Chaha Geto Tigrinya Tigre
Akkadian
OgadenArabic MoroccanArabic Mehri Harsusi Jibbali Soqotri
Hebrew Aramaic 82 69 98 99 79 67 0 1000 2000 3000 4000 5000
FIGURE 2. Consensus tree for the KEAM-23 data. Edge lengths are proportional to posterior mean time to branching. Edges thresholded at support 50% posterior probability. Numbers on nodes give posterior probability for the edges above. Unnumbered edges have posterior support equal one.
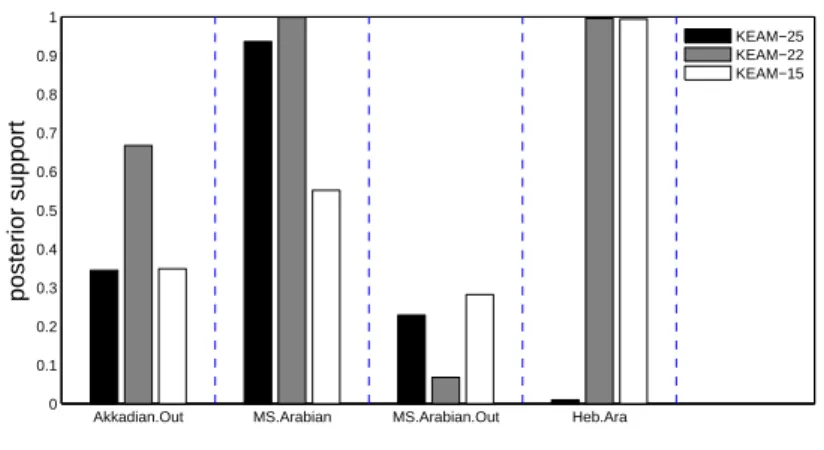
in Kitchen et al. (2009). Akkadian is an outgroup with posterior ity 0.67 and prior probability 0.04. Figure 3 shows the posterior probabil-ities for a few clades of interest. There is evidence for an Akkadian out-group (Akkadian.Out) in KEAM-22/15. The Arabic languages out-group with Modern-South-Arabian (MS.Arabian). The evidence for a Modern-South Arabian outgroup (MS.Arabian.Out) is at a similar level to Akkadian in KEAM-25 and KEAM-15, but these are dominated by bias and variance respectively. Hebrew and Aramaic are split by Ugaritic in the unreliable KEAM-25 analysis (Heb.Ara). Posterior distributions for ages and topology are in agreement between KEAM-23 and KEAM-15.
To conclude, the overall tree structure in Figure 2 is very close to that reported in Kitchen et al. (2009). It is supported by our goodness-of-fit tests. The main point of difference is in the position of the two Arabic languages and the narrowed posterior distribution of the root time.
Akkadian.Out MS.Arabian MS.Arabian.Out Heb.Ara 0 0.1 0.2 0.3 0.4 0.5 0.6 0.7 0.8 0.9 1 posterior support KEAM−25 KEAM−22 KEAM−15
FIGURE 3. Posterior probabilities for selected clades in the three analyses.
References
Bowern, C. (2010). Historical linguistics in Australia: trees, networks and their implications, Phil. Trans. R. Soc. B 365, 3845-3854
Gray, R. and Atkinson, Q. (2003). Language-tree divergence times support the Anatolian theory of Indo-European origin, Nature 426 435–439. Huelsenbeck, J.P. and Ronquist, F. (2001). MRBAYES: Bayesian inference
of phylogeny, Bioinformatics 17 754–755.
Kitchen, A., Ehret, C., Assefa, S., and Mulligan, C.J. (2009). Bayesian phy-logenetic analysis of Semitic languages identifies an Early Bronze Age origin of Semitic in the Near East, Proc. Roy. Soc. B, 276, 2703–2710. Lewis, P.O. (2001). A likelihood approach to estimating phylogeny from discrete morphological character data, Systematic Biol. 50 913–925. McMahon, A. and McMahon, R. (2005). Language Classification by
Num-bers, Oxford University Press
Nicholls, G.K., and Gray, R.D. (2008). Dated ancestral trees from binary trait data and its application to the diversification of languages, J. Roy. Statist. Soc. B, 70, 545–566.
Ringe, D., Warnow, T. and Taylor, A. (2002). Indo-European and Com-putational Cladistics, Trans. Philological Soc. 100 59–129.
Ryder, R.J., and Nicholls, G.K. (2011). Missing data in a stochastic Dollo model for binary trait data, and its application to the dating of Proto-Indo-European, Applied Statistics, 60, 71–92.