ANALYSE DE PERFORMANCE DE L'INTERPRETEUR
D'ALGEBRE DE PROCESSUS EB
3PAI
par
Moulay El Mehdi Ettouhami
Memoire presente au Departement d'informatique
en vue de l'obtention du grade de maitre es sciences (M.Sc.)
FACULTE DES SCIENCES
UNIVERSITE DE SHERBROOKE
1*1
Library and Archives Canada Published Heritage Branch 395 Wellington Street OttawaONK1A0N4 Canada Bibliotheque et Archives Canada Direction du Patrimoine de I'edition 395, rue Wellington Ottawa ON K1A 0N4 CanadaYour file Votre reference ISBN: 978-0-494-61434-1 Our file Notre r6f6rence ISBN: 978-0-494-61434-1
NOTICE: AVIS:
The author has granted a
non-exclusive license allowing Library and Archives Canada to reproduce, publish, archive, preserve, conserve, communicate to the public by
telecommunication or on the Internet, loan, distribute and sell theses
worldwide, for commercial or non-commercial purposes, in microform, paper, electronic and/or any other formats.
L'auteur a accorde une licence non exclusive permettant a la Bibliotheque et Archives Canada de reproduire, publier, archiver, sauvegarder, conserver, transmettre au public par telecommunication ou par I'lnternet, preter, distribuer et vendre des theses partout dans le monde, a des fins commerciales ou autres, sur support microforme, papier, electronique et/ou autres formats.
The author retains copyright ownership and moral rights in this thesis. Neither the thesis nor substantial extracts from it may be printed or otherwise reproduced without the author's permission.
L'auteur conserve la propriete du droit d'auteur et des droits moraux qui protege cette these. Ni la these ni des extra its substantiels de celle-ci ne doivent etre imprimes ou autrement
reproduits sans son autorisation.
In compliance with the Canadian Privacy Act some supporting forms may have been removed from this thesis.
Conformement a la loi canadienne sur la protection de la vie privee, quelques
formulaires secondaires ont ete enleves de cette these.
While these forms may be included in the document page count, their removal does not represent any loss of content from the thesis.
Bien que ces formulaires aient inclus dans la pagination, il n'y aura aucun contenu manquant.
• • •
Le 26 novembre 2009
lejury a accepte le memoire de Monsieur Moulay El Mehdi Ettouhami
dans sa version finale.
Membres du jury
Professeur Marc Frappier
Directeur de recherche
Departement d'informatique
Monsieur Benoit Fraikin
Codirecteur de recherche
Departement d'informatique
Professeur Bernard Colin
Membre
Departement de mathematiques
Professeur Richard Egli
President rapporteur
Departement d'informatique
Sommaire
Un des interets d'utiliser des methodes formelles de specification dans le developpe-ment des systemes d'information, est de pouvoir se concentrer sur les etapes d'analyse et de conception et de ne plus se preoccuper des details d'implementation. Le projet APIS utilise la methode de specification EB3, basee sur une algebre de processus, pour decrire le
comportement fonctionnel des systemes d'information. Le coeur du projet APIS est
l'inter-preteur d'algebre de processus EB3PAI; cet interpreteur implemente un ensemble de regies
permettant l'execution efficace des actions d'une specification. Un systeme specifie a l'aide de cette methode est genere automatiquement a l'aide de 1'interpreteur.
Ce memoire presente l'approche utilisee pour etudier les problemes de performance dont souffre EB3PAI. L'essentiel de cette approche, se base sur des techniques de tests de
performances et sur les outils de profilage (profiling en anglais) pour recuperer des infor-mations concernant les temps d'execution et l'utilisation de memoire. L'analyse statistique
des resultats demontre que les performances de EB3PAI sont conformes aux performances
prevues a partir des algorithmes. Trois modeles lineaires sont valides pour estimer le temps
d'execution de EB3PAI. L'approche utilisee pour conduire cette analyse de performance
Remerciements
Je remercie mon directeur de recherche, le Professeur Marc Frappier, pour son implica-tion dans ce travail de maitrise
Je remercie mon codirecteur de recherche, Benoit Fraikin, dont les remarques et le sou-tien m'ont aide tout au long de ce travail.
Je remercie le Professeur Bernard Colin pour ses precieux conseils et directives. Je remercie egalement mes camarades du GRIL pour leur soutien continu.
Je remercie aussi mes parents, mes freres, mes soeurs et toute la famille pour leur support moral et affectif inconditionnel.
Enfin je remercie toutes les personnes qui ont contribue de pres ou de loin a l'aboutisse-ment de ce travail.
Abreviations
APIS Automatic Production of Information Systems AST Abstract Syntax Tree
BD Base de Donnees
CPU Central Processing Unit
EB3 Entity-Based Black Box
EB3TG Entity-Based Black Box Transaction Generator
EB3PAi Entity-Based Black Box Process Algebra Interpreter
EP Expression de processus ER Entite-Relation
GRIL Groupe de Recherche en Ingenierie du Logiciel IDE Integrated Development Environment
IDG International Data Group
IEEE Institute of Electrical and Electronics Engineers IS Information System
JVM Java Virtual Machine
JVMPI Java Virtual Machine Profiler Interface
NP-EB3PAI Non Persistent EB3PAI
OODBMS Object Oriented Data Base Management System OS Operating System
ABREVIATIONS
PE Process Expression RPM Revolutions Per Minute
SGBDOO Systeme de Gestion de Bases de Donnees Orientees Objet SI Systeme d'information
TC Test Case TP Test Plan
Table des matieres
Sommaire i Remerciements ii Abreviations iii Table des matieres v Liste des figures viii
Liste des tableaux x Introduction 1 Contexte 1 Problematique 2 Objectifs 2 Methodologie 3 Organisation du memoire 3 1 Notions de base 5 1.1 Methode EB;i 5 1.2 ProjetAPlS 7 1.3 EB3PA1 8 1.4 Un exemple 8
TABLE DES MATIERES
2 Analyse des performances d'EBJPA l 10
2.1 Introduction 12 2.2 Background 13 2.2.1. EB3 Process Algebra 13 2.2.2 EB3PAI 13 2.3 Performance Testing 14 2.3.1 Methodology 14 2.3.2 Documentation 16 2.3.3 Profiling 16 2.4 Test Plan 17 2.4.1 Application Context 17 2.4.2 High-Level Test Plan 18 2.4.3 Detailed Test Plan 22
2.5 Test Execution 25 2.5.1 Input configuration 26 2.5.2 Output type 27 2.5.3 Output organization 28 2.6 Results analysis 28 2.6.1 Profiling analysis 29 2.6.2 Regression analysis 32 2.6.3 Overall time distribution 40 2.6.4 Performance prediction 41
2.7 Conclusion 43
Conclusion 46 A Organisation des donnees et exemples de scripts PL/R 49
A.l Base de donnees des resultats 49
A.2 Le langage R 50 A.2.1 Introduction 50 A.2.2 Exemple 50 A.3 Le langage de procedure PL/R 51
TABLE DES MATIERES
A.3.2 Syntaxe 51 A.3.3 Exemple 52 A.4 Calcul de regression 52
A.4.1 Temps par classe d'action 53 A.4.2 Temps par longueur du chemin . . . . ; 55
Liste des figures
1.1 Composants du systeme APIS 7
1.2 Diagramme ER de la gestion de lits 9
1.3 Expression de processus en EB3 : Gestion des lits '. 9
2.1 Performance testing in V-Model 15
2.2 Test execution process 15 2.3 AST representation of an execution 18
2.4 Test organisation based on IEEE 829-1998 19
2.5 Class diagram of test plan 3 21 2.6 Class diagram of test plan 4 22 2.7 Process expression used in test plan 3 25
2.8 Process expression used in test plan 4 26 2.9 ER diagram of result data base 29 2.10 CPU profiling : methods calls 30
2.11 Performance leek on the early version of EB3PAI 31
2.12 EB3PAI performance after optimization 32
2.13 Memory usage (NP-EB3PAI) 33
2.14 Memory usage (P-EB3PAI) 34
2.15 Regression line for time per class (NP-EB3PAI) 36
2.16 Regression line for time per class" (P-EB3PAI) 37
2.17 Regression line for time per path length (NP-EB3PAI) 38
2.18 Regression line for time per path length (P-EB3PAI) 39
LlSTE DES FIGURES
2.21 Time distribution on P-EB3PAI : TC 3-3 42
2.22 Overall time distribution on P-EB3PAI 43
Liste des tableaux
2.1 Test Plan 1 23 2.2 Test Plan 2 24 2.3 Test Plan 3 24 2.4 Test Plan 4 27
Introduction
Contexte
Les systemes d'information (SI) sont de plus en plus utilises dans divers domaines comme les hopitaux, les telecommunications, le transport et le commerce electronique. Ces SI se caracterisent par de larges bases de donnees generalement distribuees avec des schemas complexes et un nombre important de relations entre les entites. Ces bases de donnees vont etre sujettes a des requetes de consultation ou de modification envoyees par plusieurs utilisateurs avec des acces concurrentiels et ceci a partir d'une ou plusieurs inter-faces graphiques offertes par le SI.
Le processus de developpement des SI passe generalement par une approche semi-formelle ou insemi-formelle a l'aide de plusieurs outils. On peut alors creer des diagrammes de classes ou des modeles entites-relations et les traduire en langage Java ou SQL. Ceci dit, le comportement du SI reste a developper et a implementer manuellement, ce qui demande des ressources importantes, augmente le risque d'erreurs et necessite des tests exhaustifs. Le projet APIS offre une boite a outils complete pour pouvoir construire des SI a partir
de specifications formelles ecrites en EB3. Ces specifications decrivent le comportement
attendu du SI.
L'interpreteur de l'algebre de processus EB3, EB3PAI, represente le coeur d'APls. II a
ete realise entierement en langage Java. Son role est de verifier si les actions envoyees par l'utilisateur sont acceptees par le SI. Chaque action verifiee par l'interpreteur provoque un changement de Fetat courant du systeme. Cet etat est memorise de maniere persistante en utilisant un systeme de gestion de bases de donnees orientees objet (SGBDOO) appele
INTRODUCTION
Problematique
L'un des enjeux majeurs du cycle de developpement d'un SI est de pouvoir respecter les limites materielles et logicielles prescrites. Ceci dit, le but est de reduire le temps d'exe-cution au minimum afin d'offrir une bonne experience a l'utilisateur et, ainsi, promouvoir l'image du commerce. En plus des differents types de tests de fonctionnalites, l'analyse de performance doit faire partie des instruments de verification pour chaque iteration du cycle de vie du developpement.
Une etude theorique, realisee lors du developpement d'EB3PAI, soutient que les
per-formances de celui-ci devraient etre etroitement liees a la taille de la specification utilisee. Ceci dit, ces performances ne doivent pas etre influencees par le nombre de donnees utilise lors de l'execution d'EB3PAl. Pour chaque action a executer, l'interpreteur doit recuperer
l'etat courant du systeme, executer Taction demandee par l'utilisateur et enfin mettre a jour l'etat du systeme. On a pu relever, lors de quelques executions de l'interpreteur, que l'execution de certaines actions prenait quelques secondes (de 2 a 4 secondes), ce qui est tres problematique pour un SI. Ceci peut avoir deux causes potentielles : soit que la struc-ture de donnees utilisee lors de l'execution est assez lourde a parcourir, ou bien que PSE
Pro prend un temps considerable pour creer, lire, modifier et memoriser l'etat du systeme
sur le disque dur. Le ramasse-miette (garbage-collector) et 1'implementation des methodes peuvent aussi etre a l'origine du probleme.
II existe deux versions d'EB3PAl: avec et sans persistance. La version avec persistance
utilise le SGBDOO Objectstore PSE Pro pour memoriser sur le disque dur les objets crees lors de l'execution de l'interpreteur. Le role de PSE Pro est de modifier le bytecode des classes generees afin que la persistance des objets soit effective. Par contre, les objets crees
lors de l'execution de la version sans persistance d'EB3PAl se situent au niveau de la
me-moire vive seulement.
Objectifs
Le but de ce memoire est de fournir une demarche afin d'analyser le comportement
INTRODUCTION
memoire sont les suivants :
1. Reflechir aux sources possibles du probleme : poser des hypotheses sur les origines de la perte de performance d'EB3PAl.
2. Faire une analyse de performance de l'interpreteur : recuperer les temps d'execution des mefhodes ainsi que l'utilisation de la memoire et l'activite du ramasse-miette. 3. Analyser les resultats : etablir une comparaison entre les resultats issus de la version
non persistante et ceux de la version avec persistance, ainsi qu'estimer, de maniere statistique, la linearite des performances d'EB3PAI par rapport a la taille de la
speci-fication.
Methodologie
II est important de suivre une demarche precise pour pouvoir realiser ce projet. Pre-mierement, il est indispensable de se familiariser avec EB3PAI. II faut etudier de pres la
methode EB3 pour pouvoir comprendre le fonctionnement de l'interpreteur et ses resultats.
Deuxiemement, il est important d'etudier les differents types de tests, en se concentrant sur les methodologies de tests de performance ainsi que sur les techniques d'analyses des resultats. La selection de l'outil de tests vient en troisieme lieu, en comparant les profilers les plus utilises et en choisissant celui qui repondra le mieux a nos besoins. En quatrieme lieu, il faut delimiter les objectifs des tests, en creant des plans de tests repondant a chaque scenario possible d'execution. En dernier lieu, faire l'analyse adequate pour toutes les don-nees recoltees, tout en se basant sur des approches statistiques pour evaluer et estimer les
performances d'EB3PAl.
Organisation du memoire
Le reste du memoire est organise comme suit. Le chapitre 1 introduira la methode
EB3, un concept important pour la comprehension de celui-ci. Ce chapitre parlera aussi
du projet APIS et plus specifiquement d'EB3PAl. Le chapitre 2 presente un article intitule
« Performance Analysis of the EB3 Process Algebra Interpreter ». Cet article presente la
INTRODUCTION
que l'approche statistique suivie pour analyser les resultats recoltes. En conclusion, on fera le point sur la contribution de ce travail ainsi que les critiques et les travaux futurs. L' annexe A presente l'organisation des donnees recoltees lors de l'execution d'EB3PAI, les
outils utilises pour les exploiter ainsi que quelques scripts ecrits en PL/R qui permettent de calculer la regression.
Chapitre 1
Notions de base
1.1 Methode EB
3Definition
EB3 (entity-based black-box) [••!, ? ] est une methode formelle de specification des SI,
se basant sur des traces d'entree-sortie structurees et a ete specialement concue par M. Frappier et R. St-Denis, elle est composee d'une notation formelle et d'un processus sys-tematique permettant de decrire une specification du comportement externe d'un systeme d'information. Une trace valide est une succession d'evenements pouvant etre acceptes par
le systeme. Une specification en EB3 consiste en un diagramme de classes representant les
besoins de Futilisateur, incluant les entites, les associations et leur attributs respectifs, une expression de processus (EP), denotee par main, definissant des traces d'entree valides, des fonctions recursives, qui attribuent des valeurs aux entites et aux attributs, des associations et des regies d'entree-sortie, pour attribuer une sortie a chaque trace d'entree valide.
Le diagramme ER
Le diagramme entite-relation utilise le principe des modeles de donnees et des nota-tions graphiques d'UML pour representer les entites et les associanota-tions qui decrivent le SI. Chaque entite renferme les informations concernant ses propres attributs et ses fonctions.
1.1. METHODE EB3
L'algebre de processus
L'essentiel de la syntaxe d'EB3 repose sur une algebre de processus, dont la notation est
inspiree de CSP d'Hoare. Une expression de processus est construite a partir d'operateurs
appliques a des actions. Les operateurs supportes par la methode EB3 sont decrits comme
suit:
• La sequence denotee par ".".
• La fermeture de Kleene denotee par "*". • Lechoix denote par "|".
• U entrelacement denote par " 111".
• La composition parallelle denotee par "||". • La garde denotee par ==• .
• Le choix et 1'entrelacement quantifie sont definis respectivement par | x : [1, n] et par HI x : [1 : n] .
Les expressions de processus se definissent en quatre formes : • Elementaire : A et a, une action.
• Binaire : E1.E2, El| E2, E1|[A]| E2.
• Box : 0 denote un processus qui a complete son execution avec succes. • Unaire : | x : [1, n] : E, ||| x : [1 : n] : E, E*.
Definitions d'attributs
En EB3, la representation d'une base de donnees necessite, en plus du diagramme ER,
une fonction de definition pour chaque attributs. Une definition d'attribut est une fonction recursive sur les traces valides acceptees par 1'expression de processus main. Cette fonction calcule la valeur d'un attribut selon l'etat courant du systeme. Plus de details peuvent etre trouves dans [ ] .
1.2. PROJET APIS
Regies d'entree-sortie
Les regies d'entree-sortie attribuent une sortie a chaque trace valide du systeme pour y recuperer rinformation demandee. En d'autres termes, ces regies permettent d'extraire les donnees d'affichage pour chaque action de l'utilisateur en se basant sur un langage formel de requetes.
1.2 ProjetAPis
L'objectif d'APIS (Automated Production of Information System) [ ] est de developper un outil de generation automatique de SI executables a partir de specifications formelles
ecrites en EB3. Le but est aussi de liberer le programmeur des details d'implementation,
pour mieux se concentrer sur les phases d'analyse et de specification.
SolmaiL J-iiLiiiiea
4,
IS Spcciticution GUI Spec. Web Interface ->• limui / uutmit ->• Generate -> hxcccutc LR ^ PClAVcb ! Etfn; \ Upiiatc Transactions3
Attribute j ; i'O i Process Definitions I i Rules j K\ press ions
7=
-y»Ci>Bj
IS Execution Environment
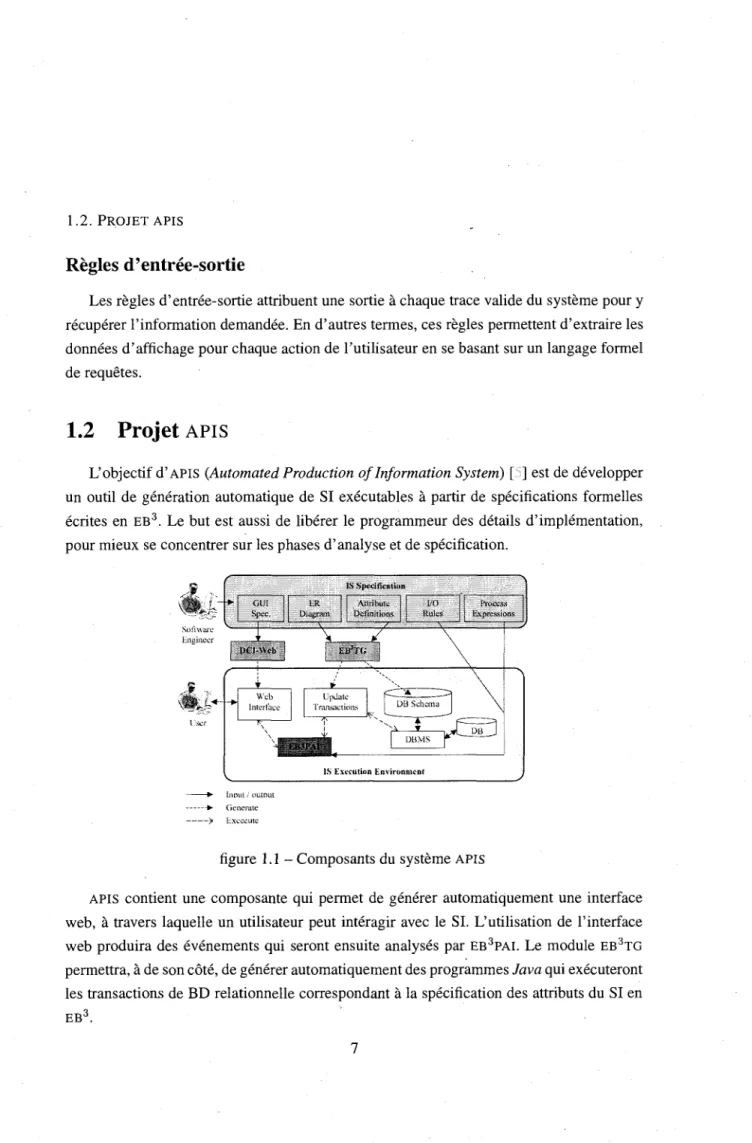
figure 1.1- Composants du systeme APIS
APIS contient une composante qui permet de generer automatiquement une interface web, a travers laquelle un utilisateur peut interagir avec le SI. L'utilisation de l'interface
web produira des evenements qui seront ensuite analyses par EB3PAI. Le module EB3TG
permettra, a de son cote, de generer automatiquement des programmes Java qui executeront les transactions de BD relationnelle correspondant a la specification des attributs du SI en
1.3. EB3PAI
1.3 EB
3PAI
Comme indique precedemment, le projet EB3PAI (Entity-Based Black-Box Process
Al-gebra Interpreter) fait partie du projet de recherche APIS ([ ••]). EB3PAI est un interpreteur
d'expressions de processus EB3. II execute une action en appliquant les regies de
tran-sitions correspondantes a une semantique definie pour Talgebre de processus d'EB3. Les
transitions sont du style E —> E' et sont interpreters par EB3PAI pour determiner si E peut
accepter Taction b et produire £". E et £" sont, respectivement, les etats du systeme avant et apres 1'execution de Taction b.
La premiere version des regies de transitions definie pour EB3 avait besoin de
re-maniement, puisqu'elles n'etaient pas adequates pour une interpretation symbolique ef-ficace. Ces regies presentaient plusieurs problemes, parmi ces problemes on compte le non-determinisme, ou une action peut etre executee par plusieurs transitions provoquant des resultats differents. La solution qui a ete implemented est un ensemble de nouvelles regies plus complexes, mais proposant une interpretation plus efficace. Cette implementa-tion est faite en Java, gerant aussi la persistance de larges arbres syntaxiques abstraits qui representent les expressions de processus en utilisant ObjectStore PSE Pro qui est aussi implements en Java.
1.4 Un exemple
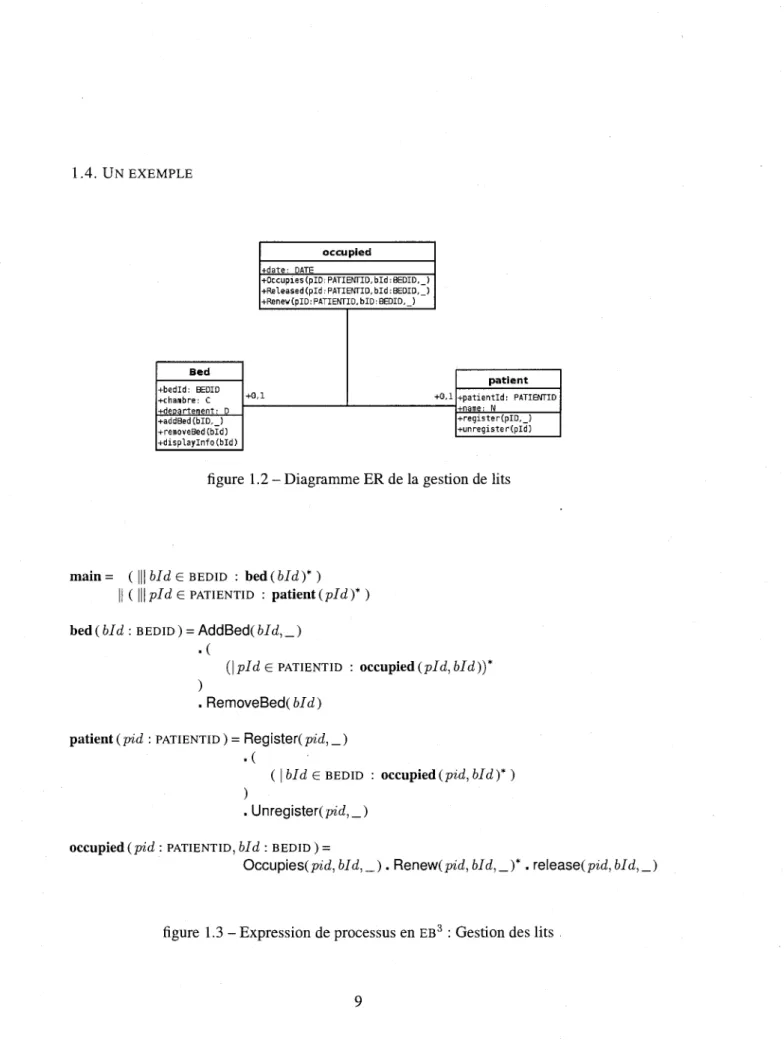
Un exemple simple de SI est la gestion des lits dans un hopital. Ce systeme permet d'ajouter ou de supprimer des lits, ainsi que d'inscrire ou desinscrire des patients pour un traitement. La figure 1.2 represente un diagramme de classe utilise pour la construction de la specification. On y retrouve deux entites, bed et patient, et une association occupied avec leurs attributs et fonctions respectives.
La figure 1.3 decrit le processus main qui fait appel aux expressions de processus de Tentite bed et de Ventite patient. Ces EP decrivent le comportement attendu du systeme. Ainsi un patient doit pouvoir s'enregistrer, puis occuper un lit, le liberer et enfin se des-enregistrer. Un lit peut etre cree, puis occupe, libere et finalement supprime. On notera que les deux expressions de processus sont synchronisees sur le processus occupied.
1.4. U N E X E M P L E B e d +bedld: BEDID +chafibre: C +departement: D occupied +date: DATE
•(•Occupies (pID i PATIENTID,bid:BEDID,_) +Released(pld.' PATIENTID, b i d : BEDID, _) +R£nev(pID:PATIENTID.bID:BEDID,_) +addBed(bID,_! removeBed(bld) +display!nfo(bId) patient + p a t i e n t l d : PATIEMTID +name; N +register(pID,_) +unregister(pld)
figure 1.2 - Diagramme ER de la gestion de lits
main = ( ||j bid e BEDID : bed(bld)* ) || ( \\\pld 6 PATIENTID : patient (pld)* ) bed (bid : BEDID) = AddBed( bid, _)
• (
(| pld £ PATIENTID : occupied (pld, bid))* )
. RemoveBed(6/d) patient (pid : PATIENTID) = Register(pzd,_)
• (
( | bid e BEDID : occupied (pid, bid)* ) )
. Unregister(pid,_) occupied (pid : PATIENTID, bid : BEDID) =
Occup\es(pid,bId,_). Renew(pid,bld,_)*. re\ease(pid,bld,_)
Chapter 2
Amelioration de la gestion de persistance
dans
EB
3PAI
Resume
Cet article developpe l'approche de test appliquee a l'interpreteur EB3PAI, dans le
but de detecter les problemes de performance que ce dernier rencontre. U article presente les methodologies, documentations ainsi que les outils necessaires pour le processus de test de performance et explique les approche theoriques et
pra-tiques qui repondront au mieux au cas d'EB3PAI. De plus, il expose une analyse
statistique complete des resultats obtenus lors du profilage d'EB3PAl. Commentaires
Ma contribution au sein de cet article consiste dans le developpement d'une ap-proche de test adaptee et applicable sur EB3PAI, la creation des plans de tests et
leurs documentations, la realisation des tests sur l'interpreteur et 1'analyse des resultats, de plus je suis le redacteur principal de 1'article.
Performance Analysis of the EB
3Process Algebra
Interpreter
Moulay El Mehdi Ettouhami, Benoit Fraikin, Marc Frappier and Bernard
Colin
Departement d'informatique, Universite de Sherbrooke, Sherbrooke, Quebec, Canada J1K 2R1
{Moulay.EL.Mehdi.Ettouhami,Benoit.Fraikin,Bernard.Colin, Marc.Frappier}
@usherbrooke.ca
Abstract
This paper describes a performance analysis case study for a process algebra interpreter called EB3PAI. This interpreter is used for the automatic synthesis of
information systems from formal specifications. The paper proposes a method-ology for conducting the performance tests and analyzing their results using sta-tistical techniques. A very large volume of data has been collected, stored in a relational database and analyzed using PL/R, a powerful open source statis-tical package integrated with Postgres. A number of statisstatis-tical tests have been conducted to determine if the implementation satisfies the predicted algorithmic
2.1. INTRODUCTION
2.1 Introduction
Information systems (IS) have become largely used in several areas. However the devel-opment process remains informal or semi-formal. The behavior of the IS must be im-plemented manually, which requires significant resources and increases the risk of errors. Formal methods [ ] use abstracts languages that cover the phases from specification to im-plementation. They provide notations, techniques and tools based on mathematical models that help to check that an implementation satisfies a specification. To free the program-mer of the implementation details, the Automated Production of IS (APIS) project [ ] was launched in 2000, providing a toolbox to automatically generate an executable IS from
a formal specification written using the Entity-Based Black-Box (EB3) method [4]. This
specification describes the expected behavior of the IS, by defining the valid traces of input events that the IS must accept.
The core of the generated IS is the EB3 Process Algebra Interpreter (EB3PAl) [••!]. Its
role is to verify if a user input satisfies the specification and can be executed, if not the input is automatically rejected and the state of the IS preserved. This interpreter is coded in
Java. Usually IS must meet the hardware and software limits on which it runs, providing
acceptable performance for database access and processing queries. The IS generated us-ing the APIS framework must also meet these criteria and provide users with performance similar to conventional IS.
For each action to be executed, the interpreter retrieves the current state of the system,
executes the action if it is acceptable, and return the new updated system state. EB3PAI
is completely written in Java, the system state is represented as an abstract syntax tree (AST) and stored using an object-oriented database management system (OODBMS), Ob-ject Store PSE Pro, (which is also implemented in Java).
An algorithmic complexity analysis has concluded that the performance of EB3PAI must
be linearly related to the size of the formal specification used, and must not be influenced by the amount of data used. But according to some preliminary tests conducted on the interpreter, some performance issues have been detected. Our intended contribution in this paper is to identify in which cases these problems occurs, by proposing a structured test plan and an analysis of its execution results. The present work is based on performance testing approaches and profiling techniques, to create test plans and gather useful
informa-2.2. BACKGROUND
tions on the tests execution. This paper also proposes a technique that estimates execution time depending on the size of the specification. This will help us to identify the source of the performance costs on EB3PAI.
2.2 Background
The EB3 specification language is a formal, object-oriented, executable specification
lan-guage for IS. An EB3 specification consist of four elements; a user requirements class
diagram which includes entities, associations, and their respective actions and attributes; a process expression which defines valid input traces of actions, denoted by main; recursive functions on traces that assign values to entity and association attributes; and input-output rules, which assign an output to each valid input trace.
2.2.1 EB
3Process Algebra
The EB3 process algebra is inspired from well-known process algebra like CSP, CCS, ACP
and Lotos. For more details, the reader is referred to [ , , , ]. Process expressions (PE) are divided in two types, elementary PE and compound PE. An elementary process expression is either an action a(xi,...,xn) with a the label of the action and ir* a term, or
an internal action denoted by A. A compound PE is a combination of one or more PE using
the following operators: Kleene closure E*, sequence (also called concatenation) E\ . E2
, choice Ei \ E2, interleave |||, synchronization £a|[A]| E2 (with A a set of action labels)
and guard p ==£> E, where p is a formula. A PE can also include quantified versions of the choice and the interleave.
2.2.2 EB3PAI
An EB3 process expression describes the set of valid traces that represents the expected
be-havior of an IS. To execute an action, EB3PAI uses symbolic computation on the operational
semantics of the EB3 process algebra. For instance, the PE a . (b . c) can execute a and
gives as a result the PE (b . C). This transition can be represented by a . (b . c) -^ (b . c). It is computed with EB3PAI using inference rules of the operational semantics. The current
2.3. PERFORMANCE TESTING
state of a specification is the process expression obtained from computing a transition. It is represented in EB3PAI by the abstract syntax tree (AST) of the process expression. EB3PAI
implements the persistence of ASTs using Object Store PSE Pro.
2.3 Performance Testing
According to IDG Research [;'••], eighty percent of software products developed with Java do not meet the required performance. The principal cause is that the industry gives more importance to functional testing than performance testing, and invests more money in hard-ware equipments to mask performance leeks. Softhard-ware performance testing [6] is con-ducted to determine how fast some aspect of a system performs under a particular work load. This testing process can serve different purposes: it can demonstrate that the system meets performance criteria, compare two systems and find out which one performs better, or measure which component causes the system to perform badly. Load testing [K] must not be confused with performance testing. The aim of a load test is to determine if a system gives the right result even on high load scenarios, while a performance test returns time consumption and memory usage of an execution.
2.3.1 Methodology
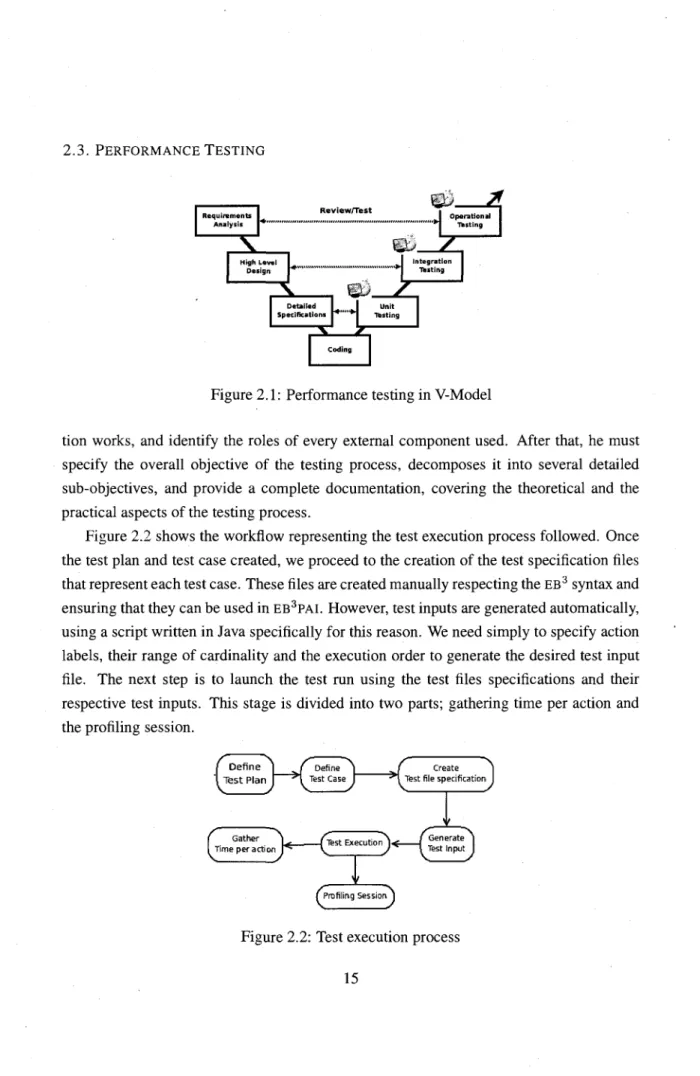
In the industry, performance testing is usually conducted at the end of the software devel-opment life cycle. This practice increases the cost of debugging, and may delay the release of the product. The adoption of a more efficient process becomes an emergency for several organization. This methodology, known as the early performance testing [•, ], maintains that the performance tests must be applied during the first stages of the development. The goal is to associate one or more performance tests to each functional test conducted (unit test, integration test...), in order to detect performance leeks as early as possible. Figure 2.1 is an example of performance testing integration into a V-model development process [ ].
In our case, since the development process of EB3PAI is already done, there is no other
choice but to apply the performance tests on the current version of the interpreter.
Before starting the testing process, a detailed methodology must be described and ap-plied in a logical way. In other words, the tester must first understand how the
applica-2.3. PERFORMANCE TESTING Requirements Analysis \ Review/Tes High Level Design ^ Detailed Specifications
^i
H
v v
Coding sp-; * 1 Operational 1 ,.„„„„r„„.,r,„.,„„..+f Testing 1r
Unit testing7"
tegration TestingFigure 2.1: Performance testing in V-Model
tion works, and identify the roles of every external component used. After that, he must specify the overall objective of the testing process, decomposes it into several detailed sub-objectives, and provide a complete documentation, covering the theoretical and the practical aspects of the testing process.
Figure 2.2 shows the workflow representing the test execution process followed. Once the test plan and test case created, we proceed to the creation of the test specification files that represent each test case. These files are created manually respecting the EB3 syntax and
ensuring that they can be used in EB3PAI. However, test inputs are generated automatically,
using a script written in Java specifically for this reason. We need simply to specify action labels, their range of cardinality and the execution order to generate the desired test input file. The next step is to launch the test run using the test files specifications and their respective test inputs. This stage is divided into two parts; gathering time per action and the profiling session.
f Define l Test Plan
\__Jj Define ] f
* 1 Test Case J *\ Te
G
Gather Time per actionCreate Test file specification
Test Execution ^ W / G e n e r a t e ^ !
_J* I Test Input J
( Profiling Session J
2.3. PERFORMANCE TESTING
2.3.2 Documentation
The testing process uses and generates a lot of informations, so it is important to provide detailed documentations covering the modeling and the application of the required tests. The IEEE proposes the 829-1998 standard [ '] that describes a set of basic software test documents. Their purpose is to facilitate communication between different actors by using a common frame of reference. The test manager is not forced to use all test documents described in this standard; they can be adapted to meet the desired context.
Organizing the documentation is very important, in order to follow the logic of the test-ing process. Fist of all, we must create the main test plan. It is a document that specifies the objective of the test, and describes also the items being tested, the features to be tested, the testing tasks to be performed, their order and in which environment they will be per-formed. A test plan must describe several test cases, each one defining a sub-objective to be verified. A test case must also describe how to satisfy its objective, and that includes the inputs required, the output expected and the execution procedure of the test case. After the execution of a test, we can use two kinds of documents. A test log document providing a chronological record of details about the executions of tests, and test incident reporting any event that occurs during the testing process and needs investigation.
2.3.3 Profiling
To quantify the behavior of a program during its execution we need a profiler. It helps to gather information on the frequency and duration of function calls. To complete this task, the profiler uses a variety of techniques such as hardware interrupts, code instrumentation, and a fishing system of the operating system. The output may be a record of all events occurred, or a statistical summary.
When it come to profile Java application, the majority of profilers available on the
market use the Java Virtual Machine Profiler Interface (JVMPI)1. JVMPI is a two-way
function call interface between the Java virtual machine and an in-process profiler agent that monitors the behavior of the virtual machine. In other words, with this interface it is possible to analyze all events that can occur during program execution. Analyzers that implement this interface are running at the same time as the Java application, and use the
2.4. TEST PLAN
same virtual machine. This can affect the normal execution of the application, that's why these profilers must be selected according to their accuracy and effectiveness.
The Netbeans development environment includes, since the 6th version, an interesting profiler. Developed by Sun Microsystems, it has the advantage to be stable, precise and well
documented. Netbeans profiler2 allows the analysis of processor and memory usage with
different levels of accuracy. The profiling can be applied on a Java package, a class or on a piece of source code. We can also monitor in real-time the interventions of the garbage collector.
We have selected Netbeans profiler for analyzing the execution of our test cases for many reasons: first of all, the profiler is included in Netbeans IDE, this allows to run profiling session and interact with the Java code easily. In comparison with other profiler
{Eclipse Profiler1 and AppPerfect4), Netbeans profiler imposes relatively low overhead and
it's even more precise (up to one thousandth of a millisecond).
2.4 Test Plan
In our case, the objective of the test phase is to cover the behavior of EB3PAI, by specifying
the maximum (within the resources available) of plausible scenarios organized in test plans. The preparation of test plans first requires an understanding of the context in which the application will run.
2.4.1 Application Context
EB3PAI is a process algebra interpreter for the EB3 process algebra; it takes as an argument
a formal specification describing the actions permitted by the system denoted by main.
main — ||| x G [1..10] : a ( x ) . b(x) ,c(x)
The above example accepts three actions, a,b and C. This system uses a quantified version of interleave that begins at 1 and ends at 10; this means that for each value of x we can execute the three actions. After being lanched, EB3PAI is waiting for a user input to verify
//eelipsecolorer.sou reeforge.net/index_profiler.html //www.appperfecr..com/products/Java-profiler.html
2.4. TEST PLAN
if it is executable or not. If we execute the action a( 1) on this example, the result will be: ( t x = l ] : b ( x ) . C ( x ) )
(|||x€[1..10]\[l] : a(x).b(x).C(x))
This result is the new state of the system, it is represented in Figure 2.3 as an AST The leaves of the tree are the elementary actions of the PE and internal nodes represent
operators. At the moment there are two versions of EB3PAI. The first one supports the
bfl) c(l) a(x)
/
b!x)
\
c(x)
Figure 2.3: AST representation of an execution
persistence of ASTs with ObjectStore PSE Pro, which will store on the hard disk the AST. A second version that does not use persistence and keeps the AST in main memory only. The aim is to test every scenario on the two versions and retrieve the result of their profiling. This will help us in the future to determine the impact of the persistence on execution time.
2.4.2 High-Level Test Plan
We've had to take into consideration that the development of EB3PAI is already done, and
we can not apply an approach based on an early performance testing. In fact, we have to apply a performance testing process on the final application. We start by describing
execu-tion scenarios using the maximum of funcexecu-tionality supported by EB3PAI. These scenarios
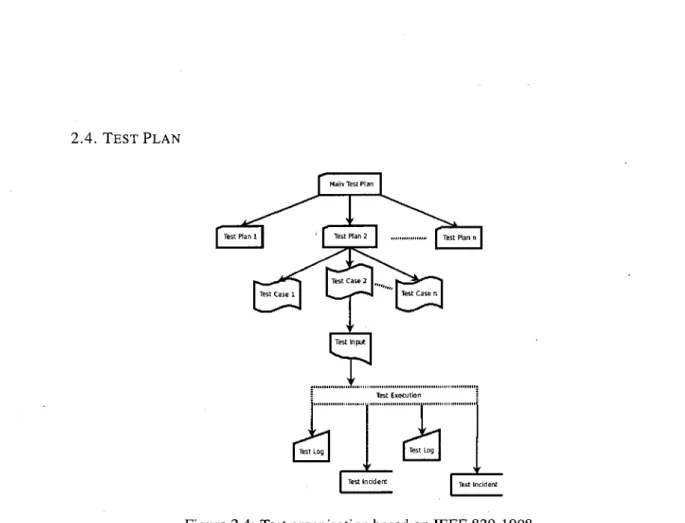
are ordered according to their size, and organized according to common objectives in test plans. Figure 2.4 shows an overview of the testing organization used in our case. This pattern is based on the IEEE 829-1998 standard.
2.4. TEST PLAN [lest
h
Log | > Test Executton 1 Test Log 1 f Test Incident > ' Test IncidentFigure 2.4: Test organisation based on IEEE 829-1998
The first step was to define the master test plan that allows us to determine the over-all objective and provide some informations on the global context. This informations are detailed in the sub test plans and test cases.
Main test plan.
Test objective: Evaluate EB3PAI performance, by comparing the two versions of the
in-terpreter (with and without persistence), and analyzing its behavior when using different operators. We also have to use realistic examples to understand the impact of large
spec-ifications on the interpreter's performance, and to find the source of EB3PAI performance
leeks.
Feature to be tested: Analyzing the behavior of the operators supported by EB3PAI will
help us to understand the impact of each one on a specification. Quantification management and treatment of large PE by the interpreter must also be verified, and compared between
2.4. T E S T PLAN
Test order: The testing process should follow a logical order to meet the specified objec-tives. In our case, tests are conducted according to their size and algorithmic complexity. First of all, we evaluate basic operators supported by EB3PAI (*, ., |, |||) and then we test
quantification management of the interpreter (| x G z : E and ||| x G z : E). To analyze the impact of large PE execution, we use specifications that implement entities and rela-tions. We can then increase the complexity of the specification, by adding more entities or associations.
Environment: Hardware environment: • CPU: Intel Quad Core Q6600 2,4GHz. • Memory: 2Go DDR2.
• Hard disk: 500Go 7200rpm. Software environment:
• OS: Vista Pro 32bit SP1 (Fresh install, NOD32 Antivirus). • IDE: Netbeans 6.
• Java: JVM 1.5.
• Profiler: Netbeans Profiler.
It is necessary to separate the overall objectives of the master test plan in several ob-jectives and order them into test plans. In our case, each test plan covers a test feature to
check. The details about the proposed test plans are the following: Test plan 1.
Objective: Evaluate the behavior of basic operators.
Features to be tested: Concatenation and choice management.
Approach: Define test cases using the features to be tested and increment the com-plexity of the specification. These tests will be run on both versions in order to
2.4. T E S T PLAN
Test plan 2.
Objective: Evaluate the behavior of quantification management of the interpreter. Features to be tested: Interleave and synchronization operators, and quantified ver-sions of HI and |.
Approach: Define test cases using, first, simple specifications with interleave and synchronization operators. Then we will focus on their quantified versions and com-pare their impact on the persistent and non-persistent version of EB3PAI.
Test plan 3.
Objective: Determine the impact of the number of associations and their cardinali-ties on the performance of EB3PAI.
Features to be tested: Execution of large PE implementing associations, entities and cardinality management.
Approach: First, we use the library example, represented by two entities (book and member). Then, we increase the number of associations between these entities, and determine the impact of each case. The class diagram shown in Figure 2.5 is used in this test plan. We create four test cases, using from one to four associations between entities book and member.
book +bookld: BOOKID + T i t l e : T +Section: S +Acquire(bID, ) +Se"ll(bld) +Discard(bld) +0,1 Sales +SaleO +TakeO +Return() +0,1 +0, n l o a n +Lend() +Take() +Return() +0,n +0,n +U,n orders +0rder() +Take() +U,n reservation +Reserve() +Take() u member +mTd: HFMBERID +nane; N +adresse: A +Join{mID,_) +Leave(inld)
2.4. TEST PLAN
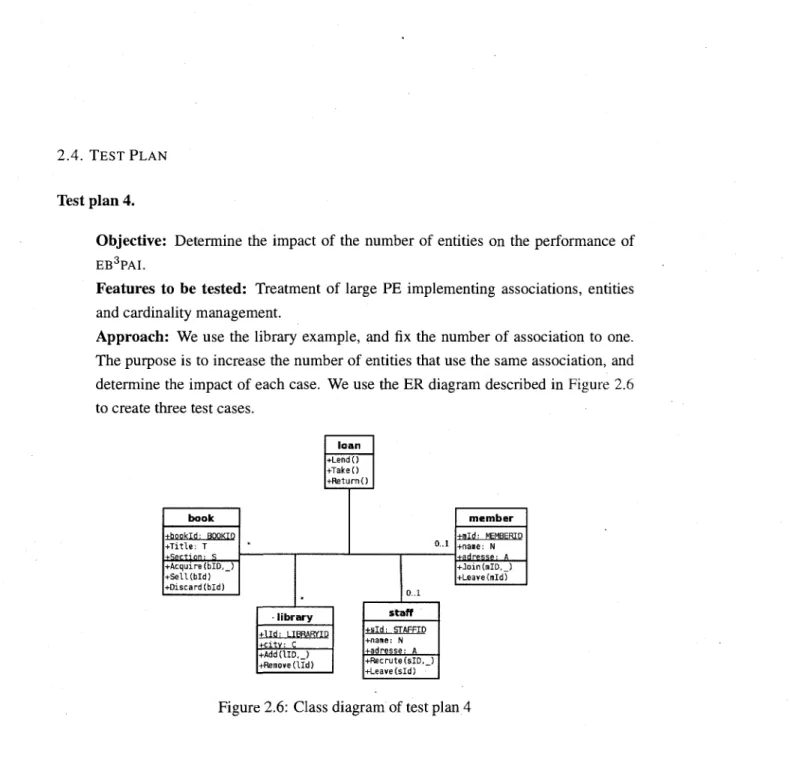
Test plan 4.
Objective: Determine the impact of the number of entities on the performance of
EB3PAI.
Features to be tested: Treatment of large PE implementing associations, entities and cardinality management.
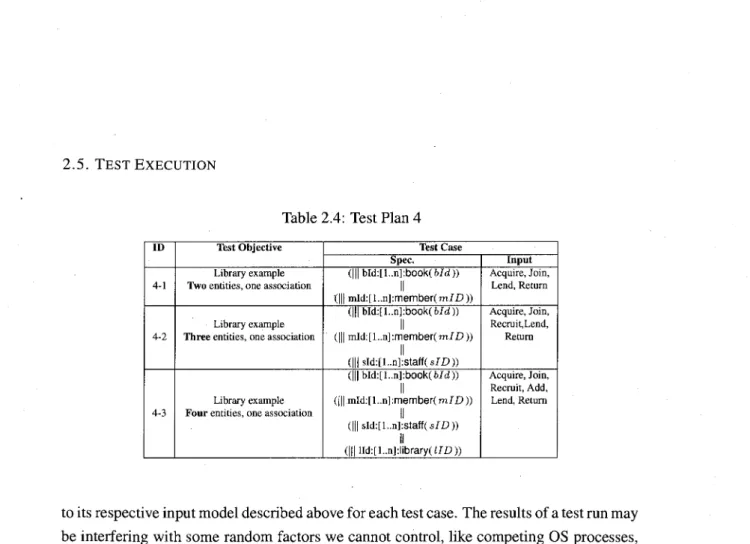
Approach: We use the library example, and fix the number of association to one. The purpose is to increase the number of entities that use the same association, and determine the impact of each case. We use the ER diagram described in Figure 2.6 to create three test cases.
book +b00kld: BOOKID + T i t l e : T +Sprt;jprt: ^ +Acquire(bIDJ ) +Sel\(bld) +Diseard(bld) l o a n +LendC) +Take£) +Return() fc 0..1 * - library + c i t v : C +Add£UDJ_) +RemO¥e(lId) staff +sld: STAFFID +name: N +adresse: A +Recrute(sID,_) member +mld; MEMBERID -t-nane: N +adresse: A +Join(raID,_3 +Leave(mld)
Figure 2.6: Class diagram of test plan 4
To meet the objectives described earlier, we create multiple scenarios for each test plan. These scenarios are represented as test cases. In the next section we will discuss the ex-perimental application of performance testing, by defining test cases and test input thats correspond to each test plan.
2.4.3 Detailed Test Plan
2.4. T E S T PLAN
way. In our case, several test cases must be extracted from* the test plan that have been defined before, Each test case represents an execution scenario of the interpreter. These scenarios must be in relation with the objective to verify.
As said before, the objective of test plan 1 is to evaluate the behavior of the basic oper-ators supported by EB3PAI. Table 2.1 details the test cases required to meet this target. The
Test Case column describes the EB3 specification that implements the test case objective,
and the actions that will be passed as input to the interpreter. In the first place we test the sequence operator, using a simple specification that allow the execution of a followed by b. To test the Kleene closure, we use a specification that implements a P.M.C (producer-modifier-consumer) configuration, which often occurs in IS, that allows us to execute a once, then an arbitrary number of b and finally C. To evaluate the choice operator, we can use a specification that give us the choice to execute either a or b. We add a Kleen closure to be able to execute this specification as many time as we need.
Table 2.1: Test Plan 1
ID 1-1 2-2 3-3 Test Objective Sequence operator P.M.C configuration Choice operator Test Case Spec. ( a . b ) * a. b*.c (a | b ) ' Input a,b,a,b,..,a,b a,b,b,..,b,c a,b,a,b,..,a,b
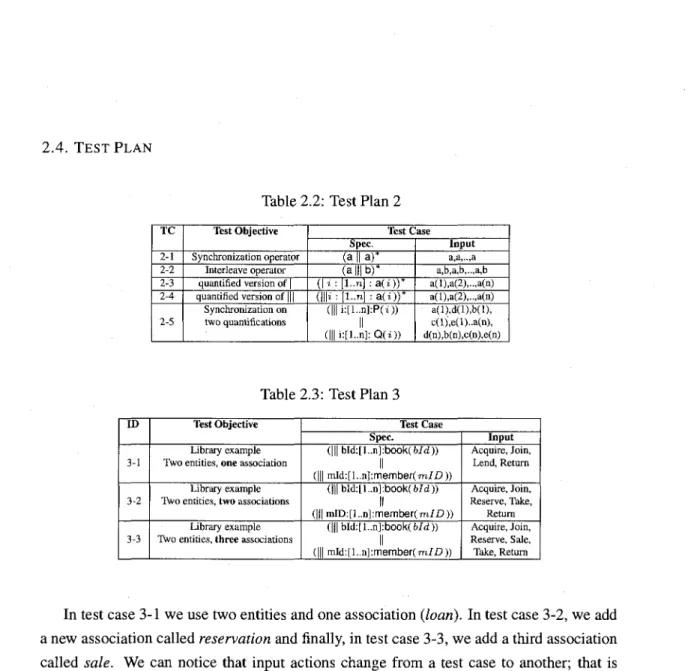
Table 2.2 introduces test cases that meets the objective of the second test plan. The purpose is to evaluate some scenarios where interleaved ID aa<^ synchronization (||) are used.
In test cases 2-land 2-2, we want to test these operators using their basic versions. Using test cases 2-3 and 2-4, we can evaluate the impact of the quantified version of choice (|) and interleave (|||). In test cases 2-5 and 2-6, we want to increase the complexity of the specification. Process P( i) is defined as a( i). b( i). c( i), and the process Q( i) is defined as d( i). b( i). e( i). In 2-5, the two processes will be synchronized on action b( i).
Most of the time, EB3PAI will be used for specifications describing IS. That's why we
should evaluate the behavior of the interpreter in such cases. Test plan 3 uses the library example, as an IS, that implements two entities, book and member. The purpose of the test cases described in Table 2.3, is to see if increasing the number of associations between these two entities will affect the behavior of EB3PAI. The specification used in test plan 3
2.4. TEST PLAN
Table 2.2: Test Plan 2
TC 2-1 2-2 2-3 2-4 2-5 Test Objective Synchronization operator Interleave operator quantified version of | quantified version of ||| Synchronization on two quantifications Test Case Spec. (a II a ) ' ( a | | | b ) * ( | i : [ l . . n ] : a ( i ) ) * ( | | | i : [ l . . n ] : a ( i ) ) * (|||i:[l..n]:P(i)) II (|||i:[l..n]:Q(i)) Input a,a,..,a a,b,a,b,..,a,b a(l),a(2),..,a(n) a(l),a(2),..,a(n) a(l),d(l),b(l), c(l),e(l)..a(n), d(n),b(n),c(n),e(n)
Table 2.3: Test Plan 3
ID 3-1 3-2 3-3 Test Objective Library example Two entities, one association
Library example Two entities, two associations
Library example Two entities, three associations
Test Case Spec. (|||bId:[l..n]:book(6Id)) II (||| mId:[l..n]:member(m/D)) (|||bId:[l..n]:book(6/d)) II (||| mID:[l..n]:member(m7L>)) (|i|bld:[l..n]:b00k(6/d)) II (||| mld:[l..n]:member(m7£>)) Input Acquire, Join, Lend, Return Acquire, Join, Reserve, Take, Return Acquire, Join, Reserve, Sale, Take, Return
In test case 3-1 we use two entities and one association (loan). In test case 3-2, we add a new association called reservation and finally, in test case 3-3, we add a third association called sale. We can notice that input actions change from a test case to another; that is because these associations add new actions to the specification.
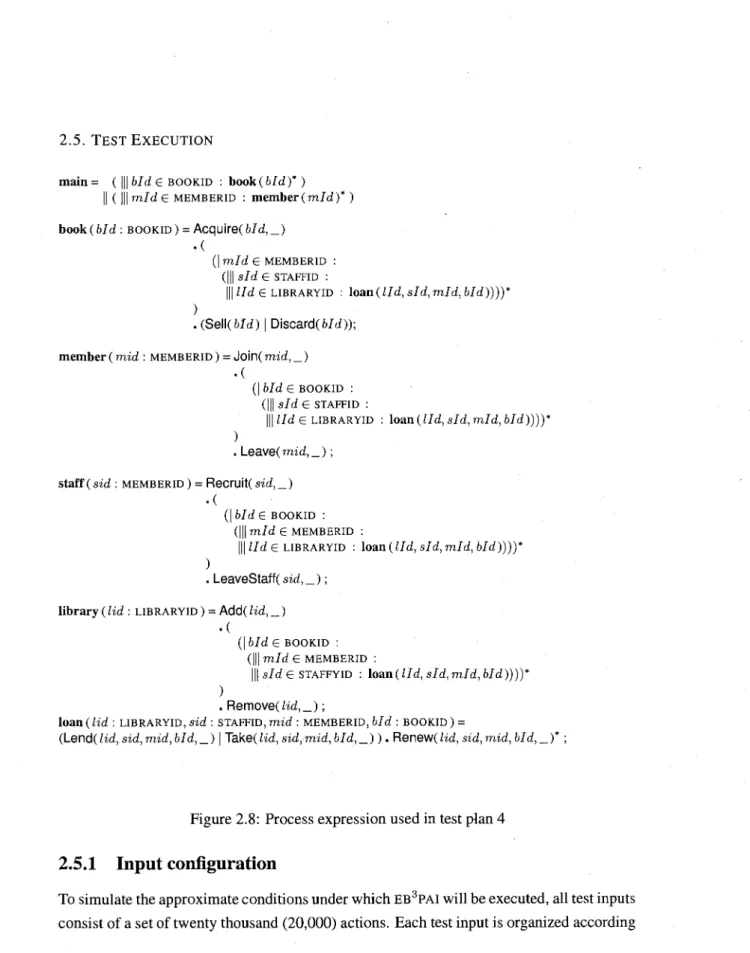
In test plan 4, we increase the number of entities in each test case, using just one as-sociation between them. Figure 2.8 presents the full specification used in test plan 4. We can notice in Table 2.4 that test case 4-1 uses two entities and one association; it's exactly the same configuration as TC 3-1. Test cases 4-2 and 4-3 use, respectively, three and four entities and one association.
Test inputs are generated automatically using a tool created specifically for this purpose. In the next section, we will present the test execution process, and the output organization.
2.5. TEST EXECUTION
main= ( ||| bid e BOOKID : book(bld)* ) || ( HI mid e MEMBERID : member ( m i d )* )
book(fc/d: BOOKID) = Acquire(Wc(,_)
• (
(| mid e MEMBERID : Ioan(m/d, bid))*
(HI mid € MEMBERID : reservation(mid, bid))*
(HI mid £ MEMBERID : sales(mid, bId))* )
.(Sell(Wd) | Discarded));
member (mid : MEMBERID) = Join( mid, _)
• (
(HI bid € BOOKID : \ooa(mld,bld))* (III bid G BOOKID : reservation(mld,bld))*
(HI bid e BOOKID : sales(mld,bld))* )
. Leave(rmd,_) ; loan (mid : MEMBERID, bid : BOOKID) =
(Lend(mid,bld,_) I Take(m«d, bld,_)). Renew(mid,bld,_)* . Relum(mid,bld,_);
reservation (mid : MEMBERID, bid : BOOKID ) =
Reserve(rmd,bld,_). (Take(mid,bld,_) \ Cance\(mid,bld,_));
sales (mid : MEMBERID, bid : BOOKID) =
(Take( mid, bid, _) | Sale( mid, bid, _))
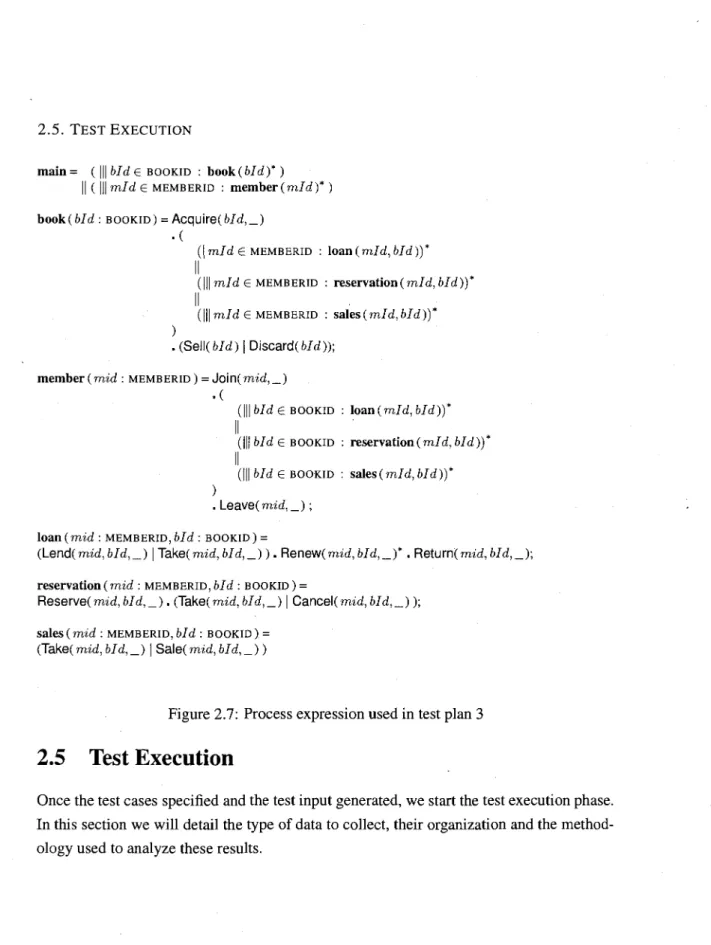
Figure 2.7: Process expression used in test plan 3
2.5 Test Execution
Once the test cases specified and the test input generated, we start the test execution phase. In this section we will detail the type of data to collect, their organization and the method-ology used to analyze these results.
2.5. T E S T E X E C U T I O N
m a i n = ( ||| bid £ BOOKID : b o o k ( W d ) * )
|| ( I mid £ MEMBERID : m e m b e r (mid)* ) book(6/d: BOOKID) = Acquire(6/d,_)
• ( (| mid £ MEMBERID : (||| sld £ STAFFID : \\\lld £ LIBRARYID : loan(Hd, sld,mld,bld))))* ) .(Sell(M"d)|Discard(b/d));
m e m b e r ( m i d : MEMBERID) = Join( mid, _ )
• (
(\blde BOOKID :
(||| sld £ STAFFID :
HI lid £ LIBRARYID : loan(Hd, sld,mid, bid))))*
)
. Leave(rmd,_); staff (sid : MEMBERID) = Recruit( sid, _)
• (
(\bld € BOOKID : ( | | | m / d € MEMBERID :
HI lid e LIBRARYID : losm(Ud,sId,mId,bId))))*
)
. LeaveStaff(sid,_); l i b r a r y (lid : L I B R A R Y I D ) = Add( lid, _)
• ( (| bid £ BOOKID : (||| mid £ MEMBERID : HI sld £ STAFFYID : \oan(Ud,sId,mId,bId))))* ) . Remove(lid,_);
l o a n e d : LIBRARYID, s i d : STAFFID, mid : MEMBERID, bid : BOOKID) =
(Lend( lid, sid, mid, bid, _) | Take( lid, sid, mid, bid, _ ) ) . R e n e w ( lid, sid, mid, bid, _ )* :
Figure 2.8: Process expression used in test plan 4
2.5.1 Input configuration
2.5. TEST EXECUTION
Table 2.4: Test Plan 4
ID 4-1 4-2 4-3 Test Objective Library example Two entities, one association
Library example Three entities, one association
Library example Four entities, one association
Test Case Spec. (|||bId:[l..n]:bOOk(Wd)) II (HI mld:[l..n]:member(m/i3)) (|||bId:[l..n]:book(6/d)) II (||| mId:[l..n]:member(m/£>)) II (|||sId:[l..n]:staff(s/D)) (|||bld:[l..n]:b00k(6/d)) II (HI mld:[l..n]:member(rnlD)) II {||| sId:[l..n]:staff(s/£>)) II (HI lld:[l..n]:library(J/25)) Input Acquire, Join, Lend, Return Acquire, Join, Recruit, Lend, Return Acquire, Join, Recruit, Add, Lend, Return
to its respective input model described above for each test case. The results of a test run may be interfering with some random factors we cannot control, like competing OS processes, disk access, etc. To reduce these factors, every test case is executed at least five (5) times.
To collect the execution of each action, we insert time collection instructions in appro-priate place in the source code of EB3PAI, and write these times into a text file. The test
execution process can take a lot of time, depending on the test case. We have measured in average five (5) to eight (8) days to execute a single test case on the early version of EB3PAI.
We will see later a performance comparison after applying some improvements.
2.5.2 Output type
There are several kinds of outputs that we will be interested in after each test run, these outputs will help us to make a behavioral analysis of the interpreter. The profiling session will gather relevant informations on the execution of the interpreter. CPU profiling allows us to analyze the number of methods calls and their respective time execution. This will help discovering CPU bottlenecks. With the analysis of memory usage, we will asses
the memory management of the JVM, and the impact of garbage collector on EB3PAl's
performance.
Since a test case input contains twenty thousand (20,000) actions and will be executed five times, we will gather up to one hundred thousand (100,000) executions time for each
2.6. RESULTS ANALYSIS
test case. A good way to handle this large amount of data is to store it in a database, in order to facilitate access and manipulation.
2.5.3 Output organization
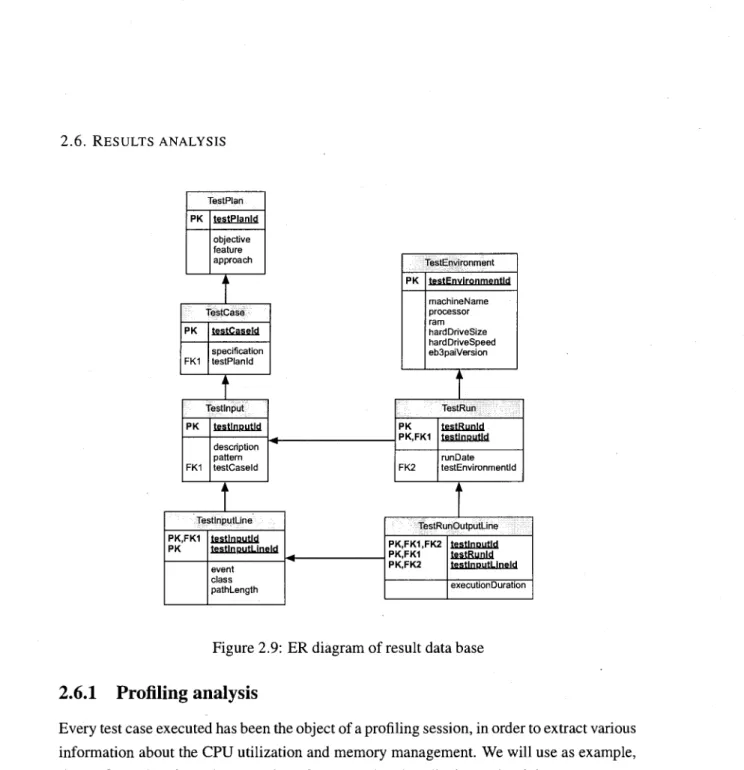
An important step after finishing collecting informations on the performance, is to organize everything in a coherent and structured way. We have decided to store all the results into a PostgreSQLr database to be able to access these data easily and quickly. The entity relationship diagram of this database is shown in Figure 2,9; this diagram is based on the test organization described in Figure 2.4. The TestlnputLine table contains the list of actions used in every test case, and TestRunOutputLine contains the execution time for each one of these actions.
In order to analyze the results, we use a powerful statistical tool called R6. The R
lan-guage is a programming lanlan-guage and a mathematical environment for data processing and statistical analysis. R also offers powerful tools for graphs generation that we will use to present our conclusions. To create a link between the PostgreSQL and the R tool we will
use PUR1. PUR is a procedural language that can create PostgreSQL functions with the
capacity to trigger functions of the R language, in other words, PL/R allows the interaction with the database (using queries) and use the results as inputs for R functions. Using this set of tools, we can proceed to a deep analysis of all the results available on the database.
2.6 Results analysis
In this section we will analyze the informations collected after the completion of each test. Firstly, we will begin with an overview of the EB3PAI performance based on profiling data,
given the large number of test cases used, we will illustrate these results using a single test case as example. The next step is to analyze overall EB3PAl's performance statistically, and
to find a way to predict its behavior.
5http://www.postgresql.org/ 6http://www.r-project.org/
2.6. RESULTS ANALYSIS TestPlan PK testPlanld objective feature approach i 1 TestCase PK FK1 testCaseld specification testPlanld i 1 Testlnput PK FK1 testlnputld description pattern testCaseld i L TestlnputLine PK.FK1 PK testlnputld testlnputLineld event class pathLength TestEnvironment PK testEnvironmentld machineName processor ram hardDriveSize hardDriveSpeed eb3paiVersion i , TestRun PK PK.FK1 FK2 testRunld testlnputld runDate testEnvironmentld i , TestRunOutputLine PK,FK1,FK2 PK.FK1 PK.FK2 testlnputld testRunld testlnputLineld execution Duration
Figure 2.9: ER diagram of result data base
2.6.1 Profiling analysis
Every test case executed has been the object of a profiling session, in order to extract various information about the CPU utilization and memory management. We will use as example, the profiling data from the execution of test case 3-3 described on Table 2.3.
CPU usage
In our case, the primary purpose of applying CPU profiling was to determine the impact
of persistence management on the execution of EB3PAI. We need then to extract time
informations about all methods invoked during an execution, and calculate their percentage. The Netbeans profiler can do all the job for us, and organize the results by methods, classes
2.6. RESULTS ANALYSIS
or packages. We have used the packages sorts option to distinguish the EB3PAI methods
call from those of PSE Pro, responsible for the persistence capability.
• PSE Pro ll EB3PAI
Figure 2.10: CPU profiling: methods calls
The graph in Figure 2.10 shows the percentage of time spent in methode calls when running the test cases 3-3. The package PSE Pro uses 69 per cent of total running time, this includes the initialization of the database and all disk accesses. The remaining 31 per cent concern the EB3PAI package; it includes the initialization of the AST, the reading of
the inputs, execution of actions and outputting the result and log files.
We have also detected, using performance testing, a major bug which affected directly the performance of EB3PAI. Figure 2.11 shows execution time per action using the test case
3-3 on the first persistent version of EB3PAI. We can notice that the execution time start
to evolves dramatically, and go up to two seconds per action. In this case, we can see that the number of actions executed have a direct impact on the time consumption, specially when these actions are in the scope of a synchronization. Following the initial algorithmic complexity analysis in [/!], this behavior is not expected. An investigation have been done, and found that the source of the problem was in a module called processManager. This module was supposed to optimize the overall performance by storing in a hashmap all visited nodes and use it for the following executions. The implementation was, such that the same hash key was used for each node, causing a linear increase in execution time. However, after reviewing the benchmarks produced by this study, the module shows no more interest since the gain is negligible.
2.6. RESULTS ANALYSIS
3000
Figure 2.11: Performance leek on the early version of EB3PAI
significantly improved. Figure 2.12 shows the execution of test cases 3-3 on the persistent version of the interpreter. We can notice a stable behavior comparing with the first version for the same number of actions.
Memory usage
At this stage, we will be interested in three major informations; the total heap size allocated by the JVM (in bytes), the heap used during the execution of EB3PAI (in bytes) and the
rel-ative time spent in garbage collecting (in percentage). We will apply the memory profiling on both versions of EB3PAI, with and without persistence.
Figure 2.13 shows the evolution of informations concerning the memory profiling on
the non persistent version of EB3PAI (NP-EB3PAI). We can notice that both the allocated
and the used heap size evolves almost linearly during the execution. Garbage collector remains relatively stable except some times where it uses almost 45 per cent of the JVM resources.
Figure 2.14 shows the results of the memory profiling applied on the persistent version
of EB3PAI (P-EB3PAI). We can notice the same linear evolution as the non persistent
ver-sion. Therefore the maximum heap size used on the persistent version of the interpreter for this execution goes up to fifty megabytes (50Mb), versus the non-persistent version that
2.6. RESULTS ANALYSIS
3000
2500
20CO
Figure 2.12: EB3PAI performance after optimization
stops at twenty four megabytes (24Mb). The relative time spent on garbage collection does not exceed five percent, and it is stable throughout the execution.
In the next section, we use the data gathered for the execution of each action to un-derstand the behavior observed by the profiling analysis. We will also discuss different statistical approaches that can serve as a basis to predict EB3PAI end behavior.
2.6.2 Regression analysis
Many studies are trying to explain the relationship between a variable and other variables. The sought relation is written as follows:
Y=f(X
u..,X
n)
with• Y is called the explained, or response variable. • X\, ..,Xn the explanatory variables or factors.
2.6. RESULTS ANALYSIS 25 100 90 80 70 60 50 40 30 20 10 0 1 4 7 10131619222528313437 404346495255586164677073767982 Timestamp Heap Size Used Heap
Relative Time Spent in SC
Figure 2.13: Memory usage (NP-EB3PAI)
In practice, linear model [! ] are largely used. For instance, if we consider the relation
Y = f(Xi, X2) described as Y — j30 + fi\Xi + /32X2, we can conclude that this model
is a polynomial and belongs to the linear models class. The p coefficients $ (/ = 1, ...,
p) are unknown parameters and their values must be assessed. If the relationship between Y, X\ and X2 was perfectly correct, it would suffice to know the values of Y, Xi and X2
factors for m gathred observations and solve a system equation with/? unknowns to deliver the values of parameters $ .
However, a relationship chosen to explain a given phenomenon is rarely accurate. First, a model is generally an approximation of a phenomenon much more complex. In addition, any experiment repeated twice under conditions believed to be identical, gives rarely the same result. The variations are usually caused by a multitude of external factors that we do not control (ex: Garbage Collector). It is therefore reasonable to attach to any model, supposed to reflect a complex phenomenon, a random term that represents the difference between the theoretical model chosen and the gathered observations. The term called ran-dom error term (e), will be added to die model as shown by the following relationship:
Y = p0 + ^1X1(32X2 + e.
In our case, the objective is to describe a model that can characterize the execution time of EB3PAI. We will analyze three models, each model will try to explain the execution time
2.6. RESULTS ANALYSIS 70 60 50 5 40 £ a 30 -20 10 0
y^
• i t & - • - • , 1 * H < N < f ) " s tiL n o r ~ « ^ © T - < r * i m « t u i o r - o o c n o r H < ' * j m ^pu ^ o H d H H H H d H H d N N n l N N N N T i m e s t a m p - 100 <- 90 80 70 60 50 40 30 20 10 - 0 Heap Size - U s e d HeapRelative Time Spent in GC
Figure 2.14: Memory usage (P-EB3PAI)
path length and the third is a combination of the first and the second factor. The estimation of parameters of these models will require the use of statistical methods. The proposed technique called regression analysis [ ] can calculate estimates for the parameters, using series of observations of the response and explanatory factors. We will use as observations the data gathered on the execution of EB3PAI, and do the analysis for the non-persistent and
the persistent version of the interpreter.
To evaluate the precision of a model, we need to look to the R-square (or the coefficient of determination) that has been calculated at the same time as the regression using this equation:
D2 _ E,;(£-F)2
with
R2 is the coefficient of determination.
• yi is a predicted value using the regression. • yi is a real observation.
2.6. RESULTS ANALYSIS
This value can be interpreted in the following manner; if we have an R-square of 0.3, then we conclude that the variability of the explained values around the regression line is 1-0,3 times the original variance; this means that we have explained 30 per cent of our original variability.
Time = /(Class)
The purpose of this model is to analyze the impact of the action class on the execution time of EB3PAI. An action belong to the class Cq if this action appears within the scope of q
quantified interleaves. In the example below, the action a belong to the class C2. An action
of class C0 means that this action is not in the scope of any quantified interleave.
main = \\\x e [1..10] : (|||y G [11..20] : a(x,y) : )
The linear model for this case is as follow:
Ti = j30 + faCjj + €i withi=l,2,..,«
with
• Ti is the execution time observed for the action i. • Cjti is the class j of the action i.
• (30 is the constant term, or the average value of T where Cjti is 0.
• fix is the coefficient of Cjti.
• €i is the random error term on the action i. • n is the total number of observations.
To calculate the linear regression on this model, we extract the necessary information from the database and then ask the R language to calculate all the coefficients. Since each test case is executed five times, we use the average of these five results in our calculations. Figure 2.1.5 shows the regression line that explains the general approximative evolution of execution time per class of action, the observations used come from the non persistence execution of EB3PAI. Instantiating the model with the calculated coefficients, we obtain the
2.6. RESULTS ANALYSIS
• *
I | , | | i l ,,». • • j
class
Figure 2.15: Regression line for time per class (NP-EB3PAI)
following equation: T{ = 0.21 + 0.16(7^ + e*. In this case the coefficient of determination calculated is 0,58, this means that the regression line has covered up to 58 per cent of observations used.
The graph in Figure 2.16 shows the regression line calculated using observations of
persistent executions of EB3PAI. Replacing f30 by 127,33 and /?i by 7,77 in the model
equation, will give us the regression line equation Tj = 127, 33 + 7, 77Cjti + e* with 57 per
cent of explained observations according to the R-square.
Time = f(PathLength)
The aim of this second model is to determine whether the size of a specification may cause a relatively high execution time. A file specification written in EB3 is represented in EB3PAI
as an AST, this tree is subject to change during the execution. The variable pathlength, that we use, represents the number of nodes to visit before executing the desired action; in other words it is a variable describing the depth of the action to execute in the AST.
2.6. RESULTS ANALYSIS
class
Figure 2.16: Regression line for time per class (P-EB3PAI)
per class analysis it's time per path length analysis, this model is as follow:
Ti — A) + fixln + €i with i=l,2„„n
with
• Ti is the execution time observed for the action i. • Li is the path length to the action i.
• j30 is the constant term, or the average value of T$ where Li is 0.
• j3\ is the coefficient of Li.
• €j is the random error term on the action i. • n is the total number of observations.
The equation Ti — —0,0028 + 0,039L; + e* represents the regression line showed in Figure 2.17. This result is calculated using observations of the non-persistent execution of
2.6. RESULTS ANALYSIS
r
o tiiiliiii i— i i i' i U h—>
path
Figure 2.17: Regression line for time per path length (NP-EB3PAI)
EB3PAI, and explain more than 65 per cent of these observations. The value of /?i (0,039)
is positive, and prove that the regression line grow slightly.
Figure 2.18 shows the regression line that represents the model equation after the coef-ficients resolution, the resulting equation is Ti — 121, 5 + 1, 351/;+e; and explain more than 56 per cent observations of the persistent execution of EB3PAI. According to the slope of the
regression line of 1,35 (coefficient (3{), we can deduce that the evolution of the execution time is quite stable and not dramatic.
Time = f'(Class + PathLength)
This third model describes the execution time using the class action to be performed and the path length to be discovered. This will allow us to understand the evolution of the execution time depending on the specification complexity parameters, the proposed model is as follows: