1
Enhancing Knowledge for Renewed Policies against Poverty
Working Paper n° 30
Do aid donors specialize and coordinate
within recipient countries? The case of
Malawi
Peter Nunnenkamp, Albena Sotirova, Rainer Thiele
ifW
This project is funded by the European Union under the 7th Research Framework Programme (theme SSH) Grant agreement nr 290752. The views expressed in this press release do not necessarily reflect the views of the European Commission.
Do Aid Donors Specialize and Coordinate within Recipient Countries? The Case
of Malawi
Peter Nunnenkamp, Albena Sotirova, Rainer Thiele
August 2015
Abstract: Acknowledging that aid proliferation and a lack of coordination impair aid effectiveness, donors have repeatedly promised to specialize and better coordinate their aid activities, most notably in the Paris Declaration of 2005. We exploit geocoded aid data from Malawi to assess whether the country’s bilateral and multilateral donors have acted accordingly at the district and sector level. We do not find compelling evidence for increased aid specialization after the Paris Declaration, and the regional division of labor among donors may even have deteriorated. Our within-country evidence thus broadly corroborates what previous studies found at the national level of recipient countries.
Keywords: foreign aid, aid proliferation, donor coordination, Malawi JEL code: F35
Acknowledgement: Michaela Rank provided superb research assistance in handling the database and presenting stylized facts. Funding from the European Commission under the 7th Research Framework Program (NOPOOR, grant agreement no. 290752) is gratefully acknowledged.
1.
Introduction
Aid proliferation, donor fragmentation and lack of coordination are widely recognized as serious problems impairing aid effectiveness. Proliferation and fragmentation impose high transaction costs on the recipient countries, especially the poorest among them, with multiple donor missions, different sets of policy conditions and inconsistent reporting requirements absorbing scarce administrative resources (Acharya et al. 2006). Bigsten and Tengstam (2015) provide evidence suggesting that huge reductions in
transaction costs could be achieved through better donor coordination via concentration on fewer partner countries and a shift from project aid to program-based approaches. Knack and Rahman (2007) show that aid fragmentation impairs bureaucratic quality in recipient countries. For a broad cross-section of aid recipients, Kimura et al. (2012) find a negative impact of aid fragmentation on economic growth. Donors have repeatedly promised to specialize and better coordinate their aid activities, most notably in the Paris Declaration on Aid Effectiveness of 2005, which includes an explicit commitment to a division of labor based on donors’ comparative advantage at sector or country level (OECD 2005). Yet, there appears to be a wide gap between the rhetoric of political declarations and donors’ actual aid allocation. Davies and Klasen (2013) show that bilateral donors respond to aid flows from other donor countries by increasing their own aid funds. According to Aldasoro et al. (2010), hardly any donor specialized on a limited set of recipients and aid sectors, and coordination remained elusive during the period 1995-2006. Nunnenkamp et al. (2013) find that coordination among donors even weakened after the Paris Declaration.1
All these studies consider aid fragmentation and duplication of donor activities at the national level of recipient countries. Hence, they can only provide an incomplete assessment of the extent to which donors specialize and coordinate as it is not taken into account that a notable share of aid projects is sector-specific and targeted to sector-specific locations within recipient countries.2 If donors specialized within recipient countries by engaging in specific sectors and regions, and if their specialization profiles within countries differed, then coordination failure would be less of a problem than the existing cross-country studies suggest. Conversely, if donors failed to coordinate both at the national and sub-national level, the costs of failed coordination would be even higher than currently estimated.
The need for coordination within countries has been officially acknowledged by the international donor community, for instance in the Accra Agenda for Action in 2008 (OECD 2008). Since little was known until recently about the regional distribution of aid projects, it has been difficult so far to assess whether these declarations were again mere rhetoric or whether the division of labor among donors within recipient
1
Fuchs et al. (2015) argue that competition for export markets and political support prevents donor countries from coordinating their aid activities more closely.
2
According to Öhler (2013), even in a relatively small country such as Cambodia, only about half of all projects by official donors in the period 2000-2007 could be considered nation-wide projects.
countries has indeed improved. However, regional aid data are now available for selected recipient countries, mainly due to the comprehensive geocoding of project-level information by the AidData initiative (Findley et al. 2011).3 In the following, we focus on the case of Malawi, which “became the first country in the world to capture the near-universe of official development aid activities at the subnational level” (Weaver et al. 2014: ix). We cover the regional and sectoral aid activities of Malawi’s bilateral and multilateral donors during the period 2000-2011.
After briefly reviewing the previous literature and showing how our own analysis relates to it in Section 2, we provide some stylized facts based on AidData’s project-level information for Malawi in Section 3. In Section 4, we present our empirical results on aid specialization and donor coordination within Malawi. Section 5 concludes.
2.
Related literature and own approach
The previous literature typically ignores the regional heterogeneity within aid recipient countries by addressing aid fragmentation and (lack of) donor coordination at an aggregate level and considering recipient countries as the unit of observation. Varying need for aid due to differences in poverty levels within countries represents an important aspect of regional heterogeneity. Within-country variations in poverty can be large. Sumner (2012) observes that about 75 percent of the world’s absolutely poor now live in middle-income countries such as China, India and Brazil, often concentrated in specific regions, even though average income levels in these countries are well above subsistence levels. To capture this kind of heterogeneity, evaluations of donor behavior at the regional or even local level within recipient countries are required.
Until recently, the question of whether the allocation of aid within recipient countries actually targets regional and local needs could not be addressed in a systematic way due to a lack of information on donors’ geographic location choices. This started to change in 2010 when “the World Bank Group, struggling to demonstrate the impact of its own development programs to the general public, launched the Mapping for Results initiative (M4R) to geocode the lending portfolios of the International
Development Association and International Bank for Reconstruction and Development” (Weaver et al. 2014: 2-3).4 Likewise, the African Development Bank (AfDB) geocoded AfDB-financed aid projects approved in the years 2009 and 2010 for a number of African recipient countries.
Using the geocoded data on World Bank and AfDB projects, Öhler and Nunnenkamp (2014) analyze the motives governing regional aid allocation of the two multilateral donors within up to 27 African recipient countries. They do not find any evidence supporting the claim of more aid being given to regions that are needier in terms of higher infant mortality, worse maternal health and more serious malnutrition. Rather, regions where political leaders were born are likely to receive more multilateral aid, in particular for physical infrastructure projects, which suggests that political favoritism plays an important role.
The same geocoded data are employed by Powell and Findley (2012) to perform a sub-national analysis of coordination between the World Bank and the AfDB in six African recipient countries. Powell and Findley distinguish two cases with different implications for donor coordination: If need is concentrated within a country, it may be desirable to have multiple donors clustering in the needy area. Conversely, within a country in which need is diffuse, donors would coordinate effectively if they spread out their activities in different geographic areas. Based on this definition, Powell and Findley find a lack of coordination between the World Bank and the AfDB in four out of the six African countries studied.
In contrast to our analysis for Malawi, data limitations prevented Powell and Findley (2012) from considering the sectoral dimension of donor coordination as well as possible changes in the degree of donor coordination over time. Furthermore, Powell and Findley’s study provides only very limited insights with regard to donor coordination given that other donors active in the same recipient countries could not be taken into account. The limits of mapping the aid activities of single or just a few selected donors are also stressed by Weaver et al. (2014: 3): “To get traction on key issues such as donor division of labor, to better assess aid allocation patterns, and to identify gaps in service delivery, it was necessary to capture all donor aid activities.” As explained in more detail in Section 3 below, Malawi served as the pilot study for AidData to achieve comprehensive donor coverage, which enables us to overcome the above noted limitations of previous research.
In terms of donor coverage, sectoral breakdown and regional disaggregation of aid activities, our own analysis below most closely resembles Öhler (2013). Öhler uses project-related aid data for various donors - including non-DAC donors such as China and non-governmental organizations (NGOs)5 - that were active in Cambodia over the period 2000-2007. He performs logit estimations to evaluate whether donors take active projects by other donors into account when deciding on whether to start a new project in a specific sector and region. Donor coordination turns out to be limited before as well as after the Paris Declaration, in particular among bilateral donors. NGOs are found to be mainly active in the same regions and sectors as official donors, pointing to an additional coordination problem between these two groups of donors. Unlike Öhler (2013), we follow a two-step approach to analyze changes in the degree of (i) donor specialization and (ii) donor coordination, both along the sectoral and regional dimension. In line with Aldasoro et al. (2010), the first step of our analysis accounts for the possibility that donors specialize unilaterally by being active in only a subset of sectors and regions within recipient countries. Increasing unilateral specialization of this sort might imply that the need for coordination among donors is less pressing than widely thought – but only if donors specialized in different sectors and regions. Consequently, the second step of our analysis focuses on the sectoral and regional ‘overlaps’ of aid activities by different donors. In addition, we take up the point made by Powell and Findley (2012) that clustering of donors may be justified if it takes place in poor regions by looking at whether donors are more likely to be active in regions with higher poverty incidence.
Our measures of specialization and coordination resemble those used in the OECD-DAC’s own assessments of the division of labor among donors. For instance, Bürcky (2011) provides a detailed account of aid fragmentation and donor proliferation at the level of recipient countries.6 Bürcky finds that aid fragmentation increased from 2005 to 2009, as measured by the number of donors with activities in a particular aid sector of a given recipient country. Donor proliferation, as measured by the average number of sectors in which donors are engaged in a given recipient country, also increased during the same period. Furthermore, we draw on Fuchs et al. (2015) who propose alternative measures of donor
5
DAC stands for the OECD’s Development Assistance Committee, which currently has 29 members.
6
See Dreher and Michaelowa (2010) for details on the underlying methodology to measure the within-country division of labor among donors.
coordination, including a dummy variable that is set to one if both donors of a pair grant aid to a particular recipient in a particular year. Aldasoro et al. (2010) discuss specialization and coordination measures in more detail. Importantly, none of these studies addresses donor specialization and coordination at the regional level within recipient countries.
3.
Aid data and stylized facts
AidData’s geocoding of project-level information covers approximately 80 percent of total foreign aid reported by the government of Malawi during the period 2000-2011.7 The database lists more than 540 projects financed by various aid agencies, including major DAC donor countries, some non-traditional donors such as China and India, and multilateral institutions such as the World Bank.8 About 44 percent of all projects operate at the national level, with aid granted to the central government in the form of general budget support falling into this category. In contrast, the database specifies regional operations for more than half of all projects; project locations are available at the level of Malawi’s 28 districts.9 In addition, the database typically provides information on project-level aid commitments and disbursements.10 Projects are also categorized by aid sectors, based on the purpose codes of AidData and the OECD-DAC’s Creditor Reporting System.11
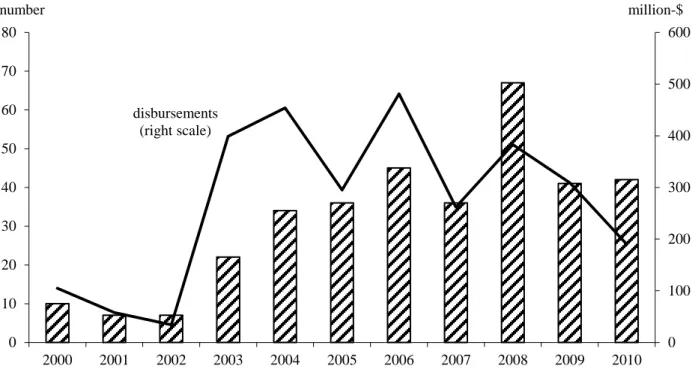
Figure 1 portrays aid developments since 2000, in terms of the number of projects started in year t and the related aid amounts.12 The number of projects clearly increased when comparing the sub-period after the Paris Declaration of 2005 with the earlier sub-period. Project-related disbursements peaked around the Paris Declaration, but continued to exceed the low levels in 2000-2002 at the end of our period of observation. Taken together, these two developments imply that the average size of projects was relatively small at the end of the period of observation (4.5-7.5 million US$ in 2007-2010), compared to
7
The data are available from: http://aiddata.org/geocoded-datasets (accessed: February 2015).
8
Taken together, all projects involved aid commitments in the order of US$ 5.3 billion; total disbursements amounted to US$ 3.7 billion.
9
For various projects, finer regional divisions are available within districts. However, our analysis focuses on the district level.
10 We use disbursements in the following in order to minimize missing observations. 11
The sector codes of OECD-DAC’s Creditor Reporting System are available at:
http://stats.oecd.org/index.aspx?DataSetCode=CRS1 (accessed: February 2015).
12
It should be noted that the date of agreement is missing in the database for about one third of projects, involving 16 percent of total disbursements.
before the Paris Declaration (4.9-18.1 million US$ in 2000-2004). This provides a first hint that aid in Malawi was more, rather than less fragmented after the Paris Declaration.
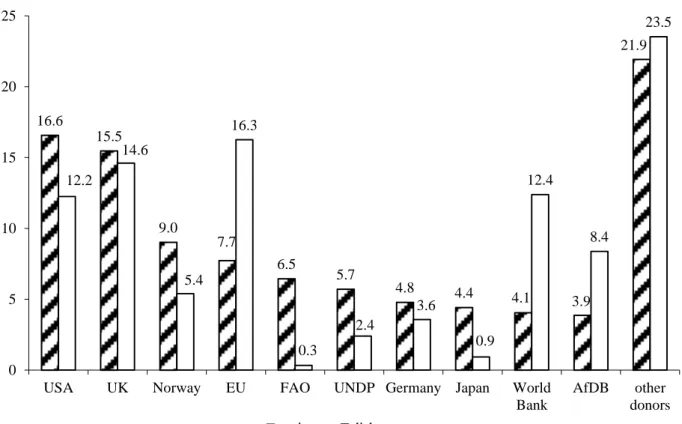
The ten most important donors in Malawi accounted for 78 percent of all projects listed in the database.13 As shown in Figure 2, two bilateral donors – the United States and the United Kingdom – stand out in terms of the number of projects. The top-10 also includes several multilateral donors, among which the FAO has the highest number of projects. It should be noted, however, that the ranking of donors differs when based on aid disbursements, rather than on the number of projects. On the one hand, the top-10 in Figure 2 includes several donors with particularly small projects (notably the FAO, Japan and UNDP). On the other hand, some donors were involved in few projects (and are thus not listed separately in Figure 2), while these projects were relatively large. For instance, China was engaged in just two projects, but contributed 3.4 percent to overall disbursements. Likewise, multi-donor trust funds financed just two projects, but contributed 4.5 percent to overall disbursements.14
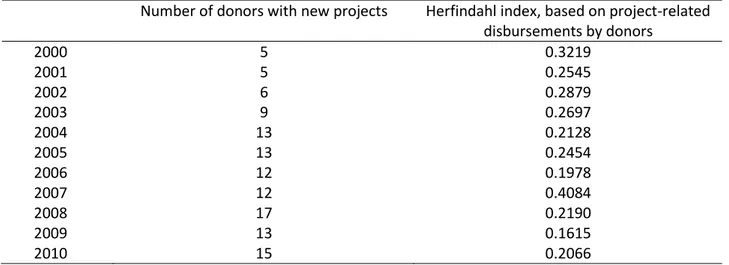
During our period of observation, the number of donors agreeing to new projects tripled from five in 2000 and 2001 to 13-17 in 2008-2010 (Table 1). Both bilateral and multilateral donors contributed to this rise in active donors in Malawi. Strikingly, the Paris Declaration in 2005 does not appear to have reversed this development. In other words, the number of donors engaging in new projects provides no indication of reduced donor proliferation in the more recent past. Furthermore, the Herfindahl index calculated on the basis of donors’ shares in new project-related disbursements does not point to less fragmented aid relations.15 As shown in Table 1, the index typically takes lower values for the most recent past, compared with prior to the Paris Declaration, indicating more fragmented aid relations.16 Importantly, this development is not just due to the increasing number of donors (extensive margin). The index was lower
13
In terms of project-related disbursements, the share of the ten donors listed in Figure 2 was slightly lower (76 percent). The database lists seven projects agreed earlier than 2000; these projects are included in Figures 2 and 3.
14
The activities of multi-donor trust funds in Malawi do not point to an increasing role of co-financing after the Paris Declaration. Both projects financed by multi-donor trust funds started before the Paris Declaration (in 2003 and 2004, respectively). This is important for the validity of our analysis below because a rise in the importance of co-financing arrangements could be an indication of better donor coordination which would not be captured by our aid overlaps.
15 The Herfindahl index would reach its maximum of one if just one donor accounted for all new project-related
disbursements in year t. Lower index values indicate more fragmented aid relations, with a minimum value of 1/N where N stands for the number of donors in year t.
16
The index value of 0.4084 in 2007 provides a major exception. This outlier is almost exclusively due to an outstandingly large World Bank project (of about US$ 103 million).
in 2009 than in 2004, even though the number of donors with new projects was the same in both years (intensive margin).
Figure 3 shows the sectoral composition of aid projects and disbursements.17 The ten sectors listed in the figure account for 78 percent of all projects. Apart from agriculture, sectors subsumed under social infrastructure & services by the OECD-DAC dominate the distribution of projects (government & civil society, health, population policies & reproductive health, and education). The share of these ten sectors in overall disbursements is slightly smaller (74 percent). Specifically, projects classified in government & civil society, other social infrastructure, and general environment protection are, on average, small compared to projects in education, health, and transport & storage. It should also be noted that some sectors not listed in Figure 3 because of a rather small number of projects belong to the top-10 in terms of disbursements. In particular, this applies to the 15 projects classified as general budget support, accounting together for 16.8 percent of overall disbursements. Interestingly, however, general budget support does not play an increasingly important role over time. While disbursements in this aid category peaked immediately after the Paris Declaration (about US$ 230 million in 2006/07), annual disbursements were considerably lower in subsequent years (average of US$ 47 million in 2008-2010).
Figure 4 depicts the number of project locations by district against the district’s poverty headcount to provide an indication of whether donors take local need into account. In a simple regression that controls for district-level population, the coefficient of the poverty headcount turns out to be insignificant, suggesting that donors are not clustering in poor areas.18 This result continues to hold when we perform the estimations in logs or exclude Lilongwe, the district around the capital city that represents a clear outlier in terms of the number of project locations (not shown).
17
Several projects did not have an aid purpose code but still could be attributed to specific sectors based on the national sector classification. For 15 projects (2.8% of all projects) with disbursements of about US$ 50 million (1.6% of total disbursements), no classification was possible.
18
The regression line shown in Figure 4 is based on. (robust standard errors in parentheses): Number of project locations = 0.07185 x poverty headcount + 0.0000707 x population + 17.131,
(0.2356) (8.16e-06) (15.336) with population set equal to the median (324941).
4.
Results on specialization and coordination
Donor specializationIn Table 2, we compare the degree of specialization across the ten major (bilateral and multilateral) donors in Malawi. In the first column, we present the number of sector-specific project activities at the district level. The maximum number of project activities is 616 for an extremely diversified donor active in all 28 districts and 22 aid sectors. At the other extreme, a highly specialized donor would be active in just one district and sector throughout the period of observation. Japan and Germany appear to be most specialized among Malawi’s bilateral donors, while the FAO is most specialized among its multilateral donors. The number of project activities is almost four times higher for the AfDB than for the FAO, which is hardly surprising considering the FAO’s narrowly defined mandate. More strikingly perhaps, Norway and the United States are much less specialized than the other bilateral donors when simply counting the number of project activities at the district-sector level.
However, the donor ranking with regard to specialization changes considerably when accounting for the different size of donors. In the second column of Table 2, we divide the number of project activities by the donor’s project-related disbursements throughout the period of observation. We now consider a donor to be more specialized when the number of district-sector combinations with project activities per million US$ of overall disbursements is relatively low. According to this relative measure, the European Union is most specialized among the bilateral donors, followed by Germany and Japan. The United Kingdom stands out as the least specialized bilateral donor in terms of district-sector activities per million US$ of disbursements. The World Bank and the AfDB are much more specialized multilateral donors by this criterion than the FAO (in spite of its narrow mandate) and UNDP.
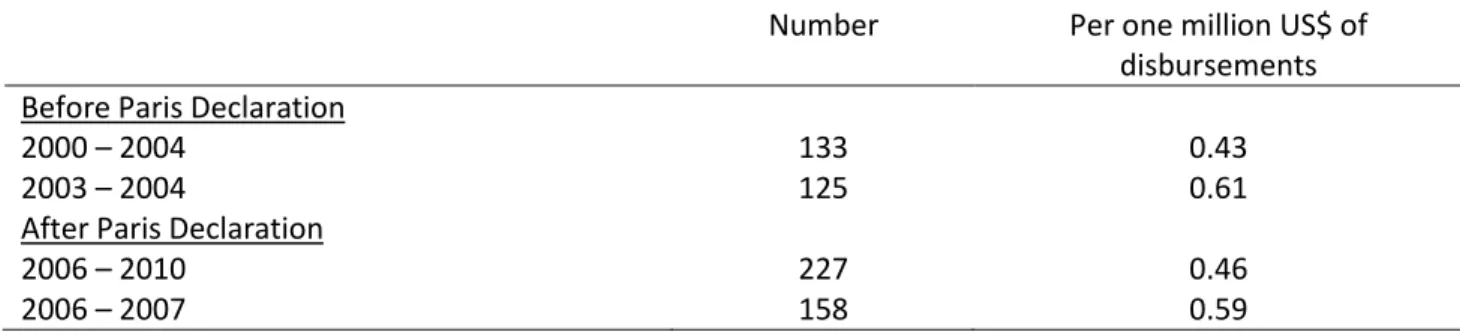
In Table 3 we use the same (absolute and relative) specialization measures at the district-sector level to assess whether Malawi’s ten most important donors reduced the proliferation of project activities over time. Specifically, we compare the (absolute and relative) number of project activities between sub-periods before and after the Paris Declaration of 2005. The activity variable is set to one (zero) if at least one (none) of the major donors was active in a particular district and sector during the sub-period under consideration. We alternatively consider longer sub-periods of five years before (2000-2004) and after
(2006-2010) the Paris Declaration, or shorter sub-periods of two years before (2003-2004) and after (2006-2007) the Paris Declaration.
The absolute number of project activities shown in the first column of Table 3 points to more, rather than less aid proliferation after the Paris Declaration.19 When comparing longer sub-periods, the number of project activities at the district-sector level increased by about 70 percent after the Paris Declaration. While this increase was less pronounced in the shorter run, the comparison of two-year time intervals still speaks against more specialization of Malawi’s donors at the district-sector level after the Paris Declaration.
We no longer find evidence for increasing aid proliferation when dividing the absolute number of project activities by the sum of project-related disbursements during the particular sub-period. Neither do we find compelling evidence for less aid proliferation after the Paris Declaration. On the one hand, the longer-run comparison of five-year time intervals points to a slightly higher number of project activities per million US$ of disbursements. On the other hand, the short-run comparison of two-year time intervals points to a slightly lower number of project activities per million US$ of disbursements. Taken all together, our findings on donor specialization and aid proliferation reveal that the need for donor coordination persists and has not been reduced by unilateral attempts at specialization.
Donor coordination
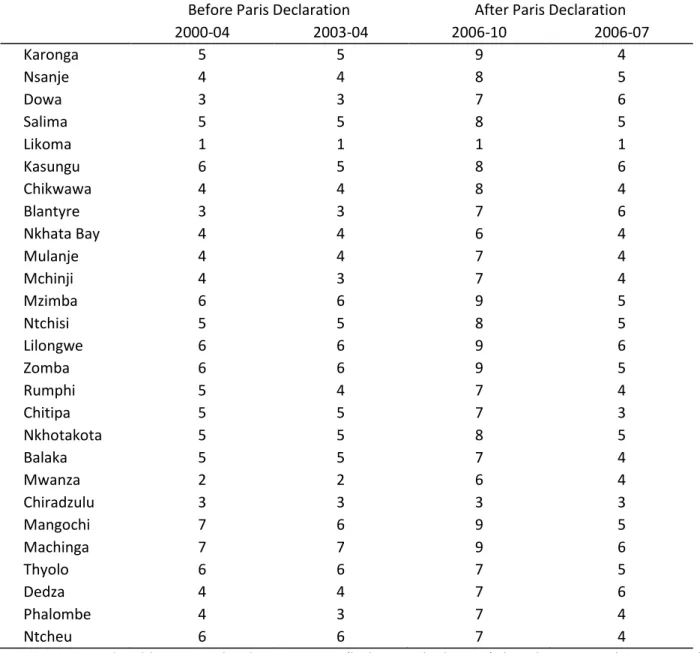
Table 4 provides first indications on donor coordination by comparing the number of donors with activities at the district level between sub-periods before and after the Paris Declaration. We consider the same sub-periods as before, i.e., longer time intervals of five years (2000-2004 compared to 2006-2010) or shorter time intervals of two years (2003-2004 compared to 2006-2007). We would expect a reduced number of active donors if the Paris Declaration resulted in donor coordination in terms of a clearer division of labor at the district level. However, we do not find compelling evidence to this effect in Table 4. Comparing five-year intervals, the number of active donors increased in almost all of Malawi’s districts after the Paris Declaration. At least eight of the ten major donors were active in twelve districts during the
19
As before in the first column of Table 2, the maximum number of project activities is 616 in the first column of Table 3 if at least one of the ten major donors was active in each of the 28 districts and each of the 22 sectors during the particular time interval.
sub-period 2006-2010. Comparing shorter two-year intervals instead, the number of active donors declined after the Paris Declaration in one third of Malawi’s districts.
Importantly, it is hardly due to increased clustering of donors in particularly needy districts that Table 4 does not point to a clearer division of labor among donors at the district level after the Paris Declaration. As argued by Powell and Findley (2012: 5), it may be desirable that several donors cluster their projects in areas with concentrated need: “Indeed, such clustering, although ostensibly signaling a lack of coordination, may be the best strategy, a point that appears lost in much of the discussion on spatial coordination of donor activities.” Hence, we rank Malawi’s districts by their poverty headcount in Table 4, with the district with the highest headcount shown at the bottom. We would expect an increasing number of active donors primarily in the lower half of Table 4 if donors clustered increasingly in needier districts after the Paris Declaration.
However, this is not what we observe. In the longer run (five-year intervals), the increase in the number of active donors is stronger for districts in the upper half of Table 4 (three donors on average) than for districts in the lower half (slightly more than two donors). In the shorter run (two-year intervals), the number of donors increased more often in districts with lower poverty headcounts (upper half of Table 4) and decreased more often in districts with higher poverty headcounts. This is exactly opposite to the pattern expected for clustering in poorer districts. A simple regression analysis corroborates that donors do not increasingly cluster in needier districts: both before and after the Paris Declaration, there is no significant association between the number of donors active in a particular district and the district’s poverty headcount.20
In the next step, we assess the degree of overlapping project activities at the district level between pairs of the ten most important donors. Accordingly, the entry for the AfDB in the first column of Table 5 means that there are 82 instances where the AfDB and any other major donor were active in the same district during the sub-period 2000-2004.21 The number of overlaps should have decreased over time if donors engaged in closer coordination after the Paris Declaration. In Table 5, we again offer two alternative
20
In the regression analysis, we control for the population of the districts, assuming that ceteris paribus larger districts tend to have more projects, which, indeed, turns out to be the case; detailed results are available from the authors on request.
comparisons for shorter and longer sub-periods before and after the Paris Declaration.
The evidence speaks strictly against closer coordination when comparing five-year intervals. Summing up all bilateral overlaps, the number is 2.6 times higher in 2006-2010 than in 2000-2004. All ten donors contributed to the increase in the number of overlaps, though to a different extent. Importantly, the increase in the number of overlaps cannot only be attributed to donors who became active in Malawi only recently (e.g., Japan) or had only limited activities at the district level before the Paris Declaration (e.g., the UK). Rather, donors such as the European Union and the United States for whom the number of overlaps was already highest in 2000-2004 also contributed considerably to the increase in the number of overlaps after the Paris Declaration.
In marked contrast, the number of bilateral overlaps hardly increased when comparing two-year intervals, instead of five-year intervals. Furthermore, the short-term perspective also points to considerable differences across Malawi’s ten most important donors. On the one hand, the number of overlaps increased considerably for the AfDB and FAO. On the other hand, UNDP and Germany discontinued project activities at the district level in 2006-2007 and, thereby, helped reduce the overall number of overlaps. All the same, even the short-term perspective does not suggest that Malawi’s donors coordinated their activities more closely by reducing the number of project overlaps after the Paris Declaration.
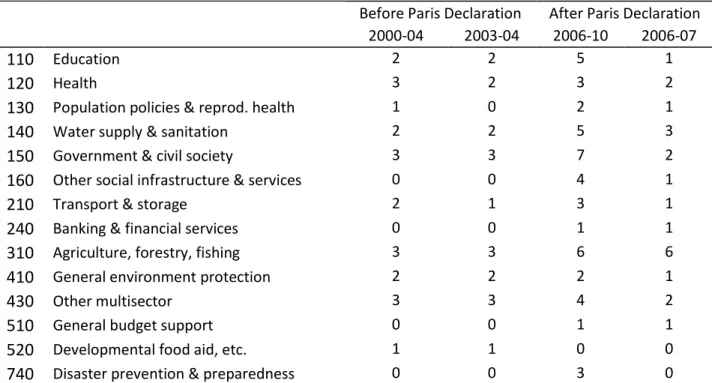
Finally, we assess donor coordination at the sector level in the same two steps as before at the district level. Table 6 compares the number of donors with activities at the sector level between sub-periods before and after the Paris Declaration. It should be noted that in several sectors none of the ten major donors was active during our period of observation.22 For almost all remaining sectors, we observe an increasing number of active donors when comparing five-year intervals before and after the Paris Declaration.23 In 2006-2010, at least five donors were active in Education (110), Water and sanitation (140), Government and civil society (150), and Agriculture (310). Not surprisingly, changes in the number of active donors were smaller and in opposite directions when comparing two-year intervals. However,
22
These sectors, which are not listed in Table 6, include Communications (220), Energy (230), Business and other services (250), Industry, mining and construction (320), Trade policy and regulations (331), and Emergency response (720) (CRS codes in brackets).
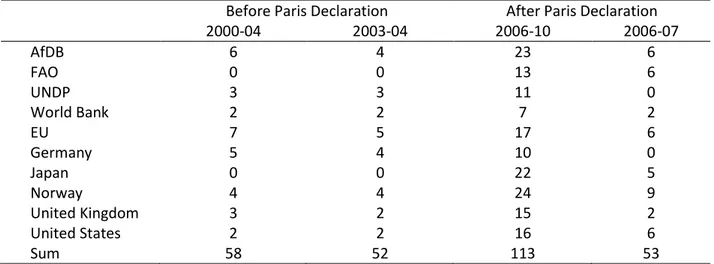
the number of donors active in Agriculture (310) doubled from three to six even in the shorter run. The number of bilateral overlaps at the sector level in Table 7 is considerably smaller than the corresponding number at the district level shown in Table 5.24 Nevertheless, changes over time are similar at the sector level. Comparing five-year intervals, the number of bilateral overlaps almost doubles to 113 after the Paris Declaration. In contrast, the number of bilateral overlaps is almost constant when considering changes in the shorter run. All in all, it appears that aid overlaps at the sector level play a minor role, compared to aid overlaps at the district level, with regard to the persistent lack of coordination among Malawi’s ten major (bilateral and multilateral) donors.
5.
Concluding remarks
This paper exploits geocoded aid data from Malawi to assess whether the country’s bilateral and multilateral donors have increasingly specialized and coordinated their aid activities at the district and sector level over the period 2000-2011. We do not find compelling evidence for increased aid specialization after the Paris Declaration, and the regional division of labor among donors may even have deteriorated. Our within-country evidence thus broadly corroborates what previous studies found at the national level of recipient countries.
The literature that takes the recipient country as the unit of observation has come up with several explanations for the limited extent of donor coordination. First of all, donor institutions are ultimately accountable to domestic taxpayers and therefore “might be inclined to ‘plant their flag’ and engage in a broad range of highly visible projects in order to demonstrate their engagement and secure future funding” (Öhler et al. 2013: 558). The same reasoning might also apply at the regional level within recipient countries.
Furthermore, donor countries may refrain from coordinating their aid activities more closely in order to secure export markets and political support of recipients (Fuchs et al. 2015). These interests are unlikely to shape donor behavior when deciding about the regional distribution of aid projects within a specific
24
This is also true when taking into account that the maximum number of 198 bilateral overlaps is smaller in Table 7 (22 sectors times nine other donors) than in Table 5.
country. Rather, the political preferences of recipient governments for specific regions or sectors could come into play at this level (Öhler and Nunnenkamp 2014). Donors may try to bypass recipient governments by working with local NGOs, but this would come at the cost of reduced ownership on the part of the local administration. The most realistic alternative would be to form coalitions of like-minded donors and increasingly use co-financing arrangements such as multi-donor trust funds or internationally coordinated budget support (Tavakoli and Smith 2013). The case of Malawi suggests, however, that donors made only limited use of these options even after the Paris Declaration of 2005.
References
Acharya, A., A.T. Fuzzo de Lima and M. Moore (2006). Proliferation and fragmentation: Transactions costs and the value of aid. Journal of Development Studies 42(1): 1-21.
Aldasoro, I., P. Nunnenkamp and R. Thiele (2010). Less aid proliferation and more donor coordination? The wide gap between words and deeds. Journal of International Development 22(7): 920-940. Bigsten, A. and S. Tengstam (2015). International coordination and the effectiveness of aid. World
Development 69(May): 75-85.
Bürcky, U. (2011). Trends in in-country aid fragmentation and donor proliferation: An analysis of changes in aid allocation patterns between 2005 and 2009. Report on behalf of the OECD Task Team on Division of Labour and Complementarity. http://www.oecd.org/dac/effectiveness/47823094.pdf
(accessed: February 2015).
Davies, R.B. and S. Klasen (2013). Of donor coordination, free-riding, darlings, and orphans: The dependence of bilateral aid on other bilateral giving. Courant Research Centre: Poverty, Equity and Growth - Discussion Papers 137.
Dreher, A. and K. Michaelowa (2010). Methodology to measure progress towards in-country division of labor. Final report. http://www.oecd.org/dac/effectiveness/46841071.pdf (accessed: February 2015).
Findley, M., J. Powell, D. Strandow and J. Tanner (2011). The localized geography of foreign aid: A new dataset and application to violent armed conflict. World Development 39(11): 1995-2009.
Fuchs, A., P. Nunnenkamp and H. Öhler (2015). Why donors of foreign aid do not coordinate: The role of competition for export markets and political support. World Economy 38(2): 255-285.
Kimura H., Y. Sawada and Y. Mori (2012). Aid proliferation and economic growth: A cross-country analysis. World Development 40(1): 1-10.
Knack, S. and A. Rahman (2007). Donor fragmentation and bureaucratic quality in aid recipients. Journal of Development Economics 83(1): 176-197.
Nunnenkamp, P., H. Öhler and R. Thiele (2013). Donor coordination and specialization: Did the Paris Declaration make a difference? Review of World Economics 149(3): 537-563.
OECD (2005). Paris Declaration on aid effectiveness. Paris: OECD. OECD (2008). Accra Agenda for Action. Paris: OECD.
Öhler, H. (2013). Do aid donors coordinate within recipient countries? University of Heidelberg. Discussion Paper 539. Heidelberg.
Öhler, H. and P. Nunnenkamp (2014). Needs-based targeting or favoritism? The regional allocation of multilateral aid within recipient countries. Kyklos 67(3): 420-446.
Powell, J. and M.G. Findley (2012). The swarm principle? A sub-national analysis of donor coordination in Sub-Saharan Africa. Development Gateway and University of Texas at Austin, mimeo.
Sumner, A. (2012). Where do the poor live? World Development 40(5): 865-877.
Tavakoli, H., and G. Smith (2013). Back under the microscope: Insights from evidence on budget support. Development Policy Review 31(1): 59-74.
Weaver, C., S. Davenport, J. Baker, M. Findley, C. Peratsakis and J. Powell (2014). Malawi’s open aid map. Washington, DC: World Bank.
Figure 1: Number of new projects and project-related (cumulative) disbursements, 2000-2010 Source: AidData. 0 100 200 300 400 500 600 0 10 20 30 40 50 60 70 80 2000 2001 2002 2003 2004 2005 2006 2007 2008 2009 2010 number million-$ disbursements (right scale)
Figure 2: Number of projects and project-related (cumulative) disbursements, by bilateral and multilateral donors (percent of total number of projects and disbursements)
Note: Donors ordered by total number of projects agreed in 1996-2011. Source: AidData. 16.6 15.5 9.0 7.7 6.5 5.7 4.8 4.4 4.1 3.9 21.9 12.2 14.6 5.4 16.3 0.3 2.4 3.6 0.9 12.4 8.4 23.5 0 5 10 15 20 25
USA UK Norway EU FAO UNDP Germany Japan World
Bank
AfDB other donors projects disbursements
Figure 3: Number of projects and project-related (cumulative) disbursements, by aid sectors (percent of total number of projects and disbursements, respectively)
Note: Sectors ordered by total number of projects agreed in 1996-2011. 110: education; 120: health; 130: population
policies & reproductive health; 140: water supply & sanitation; 150: government & civil society; 160: other social infrastructure & services; 210: transport & storage; 310: agriculture, forestry, fishing; 410: general environment protection; 430: other multisector.
Source: AidData. 14.4 14.2 12.3 11.8 8.3 6.1 5.5 3.3 3.3 3.1 14.9 2.8 9.2 11.6 14.3 12.4 9.3 6.8 8.4 2.4 0.7 1.2 22.2 1.6 0 5 10 15 20 25 150 310 120 130 110 430 210 140 160 410 all other sectors un-allocated/ unknown projects disbursements
Figure 4: Number of project locations and poverty headcount at the district level
Note: Number of project locations in1996-2011; poverty headcount in 1998. Mwanza includes Neno which was part
of Mwanza in 1998 (i.e., the year for which we take poverty and population data from the Malawi Atlas of Social Statistics).
Source: AidData; Malawi Atlas of Social Statistics.
0 20 40 60 80 100 120 140 40 45 50 55 60 65 70 75 80 85
number of project locations
poverty headcount Lilongwe
Likoma
Table 1: Number of donors with new projects and Herfindahl index, 2000-2010
Number of donors with new projects Herfindahl index, based on project-related disbursements by donors 2000 5 0.3219 2001 5 0.2545 2002 6 0.2879 2003 9 0.2697 2004 13 0.2128 2005 13 0.2454 2006 12 0.1978 2007 12 0.4084 2008 17 0.2190 2009 13 0.1615 2010 15 0.2066 Source: AidData.
Table 2: Comparing the degree of specialization across major bilateral and multilateral donors
District-sector combinations with project activities
Number Per one million US$ of
disbursements Bilateral donors European Union 73 0.26 Germany 36 0.36 Japan 16 0.54 Norway 126 1.09 United Kingdom 79 3.61 United States 120 0.65 Multilateral donors
African Development Bank (AfDB) 101 0.43
Food and Agriculture Organization (FAO) 27 2.81
UNDP 66 1.75
World Bank 56 0.29
Note: Based on all projects listed in the database with sector classification and district-level information. Number of
district-sector combinations with project activities of the specific donor; the maximum number of combinations is 616 (28 districts multiplied by 22 aid sectors). The donors listed are the top-10 donors in terms of the number of projects in 1996-2011. See Appendix for the aid sectors under consideration.
Table 3: Comparing the degree of specialization over time (based on 10 major bilateral and multilateral donors
District-sector combinations with project activities
Number Per one million US$ of
disbursements Before Paris Declaration
2000 – 2004 133 0.43
2003 – 2004 125 0.61
After Paris Declaration
2006 – 2010 227 0.46
2006 – 2007 158 0.59
Note: Based on all projects listed in the database with sector classification and district-level information. Number of
district-sector combinations with project start in the specific period; the maximum number of combinations is 616 (28 districts multiplied by 22 aid sectors). Top-10 donors in terms of number of projects in 1996-2011. See Appendix for the aid sectors under consideration.
Table 4: Number of top-10 donors active at the district level
Before Paris Declaration After Paris Declaration
2000-04 2003-04 2006-10 2006-07 Karonga 5 5 9 4 Nsanje 4 4 8 5 Dowa 3 3 7 6 Salima 5 5 8 5 Likoma 1 1 1 1 Kasungu 6 5 8 6 Chikwawa 4 4 8 4 Blantyre 3 3 7 6 Nkhata Bay 4 4 6 4 Mulanje 4 4 7 4 Mchinji 4 3 7 4 Mzimba 6 6 9 5 Ntchisi 5 5 8 5 Lilongwe 6 6 9 6 Zomba 6 6 9 5 Rumphi 5 4 7 4 Chitipa 5 5 7 3 Nkhotakota 5 5 8 5 Balaka 5 5 7 4 Mwanza 2 2 6 4 Chiradzulu 3 3 3 3 Mangochi 7 6 9 5 Machinga 7 7 9 6 Thyolo 6 6 7 5 Dedza 4 4 7 6 Phalombe 4 3 7 4 Ntcheu 6 6 7 4
Note: Districts ordered by poverty headcount in 1998 (highest at the bottom); based on project locations at the
district level for projects with sector classification and district-level information and agreed during the period indicated. Mwanza includes Neno in this table as Neno was part of Mwanza in 1998 (i.e., the year for which we take poverty data from the Malawi Atlas of Social Statistics).
Table 5: Number of bilateral overlaps at the district level: Donor listed with other nine major donors Before Paris Declaration After Paris Declaration
2000-04 2003-04 2006-10 2006-07 AfDB 82 66 171 97 FAO 0 0 118 43 UNDP 54 51 124 0 World Bank 45 42 73 37 EU 85 77 171 97 Germany 62 60 118 5 Japan 0 0 30 5 Norway 80 75 165 91 United Kingdom 5 5 165 12 United States 95 90 171 87 Sum 508 466 1306 474
Note: Based on project locations at the district level for projects with sector classification and district-level
information and agreed during the period indicated; the maximum number of bilateral overlaps is 252 (28 districts times nine other donors).
Source: AidData.
Table 6: Number of top-10 donors active at the sector level
Before Paris Declaration After Paris Declaration
2000-04 2003-04 2006-10 2006-07
110
Education 2 2 5 1120
Health 3 2 3 2130
Population policies & reprod. health 1 0 2 1140
Water supply & sanitation 2 2 5 3150
Government & civil society 3 3 7 2160
Other social infrastructure & services 0 0 4 1210
Transport & storage 2 1 3 1240
Banking & financial services 0 0 1 1310
Agriculture, forestry, fishing 3 3 6 6410
General environment protection 2 2 2 1430
Other multisector 3 3 4 2510
General budget support 0 0 1 1520
Developmental food aid, etc. 1 1 0 0740
Disaster prevention & preparedness 0 0 3 0Note: Based on projects with sector classification and district-level information and agreed during the period
indicated. Sectors with zeros in all periods not listed; see Appendix for complete list of sectors under consideration.
Table 7: Number of bilateral overlaps at the sector level: Donor listed with other nine major donors Before Paris Declaration After Paris Declaration
2000-04 2003-04 2006-10 2006-07 AfDB 6 4 23 6 FAO 0 0 13 6 UNDP 3 3 11 0 World Bank 2 2 7 2 EU 7 5 17 6 Germany 5 4 10 0 Japan 0 0 22 5 Norway 4 4 24 9 United Kingdom 3 2 15 2 United States 2 2 16 6 Sum 58 52 113 53
Note: Based on projects with sector classification and district-level information and agreed during the period
indicated; the maximum number of bilateral overlaps is 198 (22 sectors times nine other donors). See Appendix for the aid sectors under consideration.
Source: AidData.
Appendix: List of aid sectors (for projects included in the database)
Education (110); Health (120); Population policies and reproductive health (130); Water supply and sanitation (140); Government and civil society (150); Other social infrastructure and services (160); Transport and storage (210); Communications (220); Energy (230); Banking and financial services (240); Business and other services (250); Agriculture, forestry and fishing (310); Industry, mining and construction (320); Trade policy and regulations (331); Tourism (332); General environment protection (410); Women in development (420); Other multisector (430); General budget support (510); Developmental food aid and food security assistance (520); Emergency response (720); Disaster prevention and preparedness (740)
21
NOPOOR