HAL Id: halshs-00857232
https://halshs.archives-ouvertes.fr/halshs-00857232
Submitted on 3 Sep 2013HAL is a multi-disciplinary open access archive for the deposit and dissemination of sci-entific research documents, whether they are pub-lished or not. The documents may come from teaching and research institutions in France or abroad, or from public or private research centers.
L’archive ouverte pluridisciplinaire HAL, est destinée au dépôt et à la diffusion de documents scientifiques de niveau recherche, publiés ou non, émanant des établissements d’enseignement et de recherche français ou étrangers, des laboratoires publics ou privés.
Brittany (2011)
Alain Legendre, Enora Ripaud, Elodie Brisset, Olivier David, Lucie
Kostrzewa, Tiphaine Laigre, Dominique Munchenbach,
To cite this version:
Alain Legendre, Enora Ripaud, Elodie Brisset, Olivier David, Lucie Kostrzewa, et al.. Children’s Independent Mobility: Survey in French Brittany (2011). 2013. �halshs-00857232�
Children’s Independent Mobility:
Survey in French Brittany (2011)
Version 1
Authors and affiliation Suggested citation:
Legendre, A., et al. (2013). Children’s independent mobility: Survey in French Brittany (2011). UMR ESO Espaces et Sociétés. Rennes : France.
Author(s)
Alain LEGENDRE, Enora RIPAUD, Elodie BRISSET, Olivier DAVID, Lucie KOSTRZEWA, Tiphaine LAIGRE & Dominique MUNCHENBACH
Institutional affiliation:
UNIVERSITE RENNES 2 – CNRS Research unit:
UMR Espaces et Sociétés - ESO Rennes Research Programme and funding
This research is taking part in an international study of Children’s Independent Mobility; co-ordinated by the Policy Studies Institute, UK. For more information, please contact
The French survey received a funding from « Actions Spécifiques » Conseil Scientifique de l’Université Rennes 2.
Acknowledgements
Firstly, we would like to thank the head-teachers and teachers of the eight primary schools and six secondary schools who accepted to participate in the survey. Without their active support the survey would not have been possible.
We are grateful to M. l’Inspecteur d'Académie de l'Éducation Nationale of Ille-et-Vilaine for allowing us to carry out the survey in the schools of the department.
Additional thanks go to Régis Keerle and Arnaud Lepetit for advices and mapping expertise, and to Sarah Maheo and Adeline Legendre who keyboarded data.
Our final and special thanks go to all the children and the parents who accepted to spend time answering the questionnaires.
Contact details for lead researcher Alain Legendre
Espaces et Société ESO UMR 6590 UFR en Sciences Sociales
Université de Rennes II
Place du Recteur Henri Le Moal 35043 Rennes Cedex
France
[email protected] Tel 33 (0)2 99 14 18 88
Content
Children’s Independent Mobility: Survey in French
Brittany (2011)... 1
Authors and affiliation ... 2
Content ... 3
List of Tables ... 5
List of figures ... 6
Executive summary ... 7
Introduction ... 9
Importance of independent mobility during childhood ... 10
Factors shaping children’s independent mobility ... 10
Aims of the study ... 11
Methodology ... 13
1. Translation, adjustments and modifications of the questionnaires ... 13
2. Survey procedure ... 14
Participant recruitment and data collection ... 17
The areas surveyed ... 17
Findings ... 20
1 Findings grouped by primary and secondary school children ... 20
i. The six licences of independent mobility ... 20
ii. The journey to and from school ... 24
Mode of transport ... 24
Household access to cars and children’s modes of transport from schools ... 25
Preferred mode of transport to school ... 26
Accompaniment to school ... 29
Duration of journey to school ... 31
iii. Non school travel and activities ... 34
iv. Perception of safety in the neighbourhood ... 39
1 The influence of different factors on independent mobility ... 46
1. Cluster analysis of the six licences of independent mobility ... 46
Method ... 46
The five clusters describing the independent mobility: Children’s declarations ... 46
Six clusters describing the independent mobility: Parental statements ... 52
Influence of age on licence to cross main roads ... 58
Influence of age on licence to go to other places than school ... 59
Influence of age on licence to go to school independently ... 59
Influence of age on licence to go out after dark ... 60
Influence of age on licence to cycle on main roads ... 61
List of Tables
Table 1 Children’s and parents’ questionnaires per area and school types ... 16 Table 2 The Six Licences: Comparison of Children and Parents' Responses ... 21
List of figures
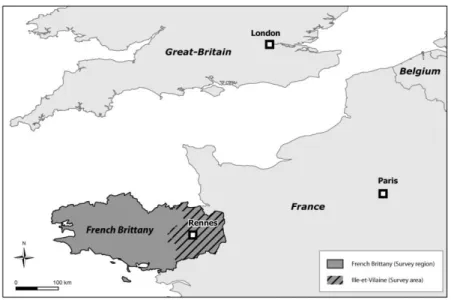
Figure 1 Survey area: The district of Ille-et-Vilaine in French Brittany... 12
Figure 2 Progression of the Six Licences from Primary to Secondary School: The Parents’ Point of View ... 22
Figure 3 Progression of the Six Licences from Primary to Secondary School: The Children’s Point of View ... 23
Figure 4 Children’s Modes of Transport to and from Primary School ... 24
Executive summary
The general objective of this study is to investigate how children’s independent mobility develops between age 7-15. The degree of independent mobility is assessed through the examination of children’s statements about six licences related to outside trips without adult supervision. The objective is to provide a detailed picture of the current state of independent mobility in primary and secondary school children of French Brittany (North-West of France). In this respect, the study contributes to an international survey carried out in 16 countries (Shaw & Watson, 2010). The international survey was initiated by the Political Study Institute of London as an extended geographical replication of the original study of Hillman & al (1990).
Method
A total of 947 children participated in the French survey. Specifically, in primary school 484 children—48,8% girls, 51,2% boys—filled up the questionnaire, age ranging from 6 to 12, mean = 8,79 (sd =1,27). In secondary school 463 young people—49,7% girls, 50,3% boys— responded to the questionnaire, age ranging from 10 to 16, mean = 12,9 (sd =1,29).
The survey was conducted in different types of living environment varying in relation to the size and density of the dwelling area. Five types of areas were considered: (1) inner district of a major city, (2) suburban area of a major city, (3) small town, (4) rural market town and (5) rural area. In the French survey, the five types of areas were selected in the same region, namely the district (département) of Ille-et-Vilaine in French Brittany. Therefore, the survey design, which gathered data from different types of areas, was likely to provide a comprehensive picture of the independent mobility of the children living in that particular region.
Children’s independent mobility was assessed through the examination of six licences: (1) Licence to cross roads alone, (2) Licence to travel to and from school alone, (3) Licence to go on their own to places other than school, (4) Licence to cycle on main roads, (5) Licence to use buses, (6) Licence to go out after dark.
Results
The comparison of the licences granted by parents to Psc and to Ssc reveals marked difference for all the six licences. This denotes important changes in the parental attitude towards these children’s independent mobility within the considered age range. Interestingly the hierarchy of the six licences is almost the same for the two groups. For both groups the licence to cross main roads is the most frequently granted, whereas licence to go out after dark is the least granted. Even in the secondary school, only a few French children are allowed to go out after dark.
The analysis of the children’s responses also puts forward that independent mobility develop markedly after 11 years when children are in secondary school. Specifically, four of the six licences are held by a large majority of the secondary school children: to go to other places than school on their own, to cross main roads, to use public transport, and to cycle on main roads. However, only one third of these older children declared to go to and from school on their own. This result is probably due to the size of the secondary school catchment areas which were particularly large in four of the five survey areas. Therefore, the distances from the children's homes to secondary school constrained the older children to use the school bus or to be driven by their parents.
The primary school children's independent mobility is particularly restricted; four of the six licences examined were hold by less than one third of these children. The licence to go to other places than school is the most frequently mentioned by the 7-to-11-year olds. But only half of primary school children can benefit from such a basic and critical licence that can be seen as a prerequisite to the development of activities independently from adults in the dwelling area. For the other half of the primary school children, this result supports the idea that most out-of-school activities are likely to take place in adult-controlled settings, where children must be accompanied by their parents.
Both primary and secondary school children claim to have a particular licence more often than parents declare to grant their children that licence. The differences between children’s and parents’ responses are particularly obvious as regard to the licence to ride on main roads and, to a lesser degree, the licence to go out after dark.
A cluster analysis permitted to isolate five contrasted types of independent mobility defined by various combinations of licences ranging from a quasi-total dependent mobility to the largest independent mobility. Age is the principal factor significantly associated with each of the five clusters, whereas gender is only associated to one cluster. The type of area and the children’s perception of safety in their local area also seem to account for the nature and degree of independent mobility. Overall, these results support the view that a complex array of factors intervenes in the development of children independent mobility, including environmental attributes of the living context such as city size, density and outdoor urban facilities.
Introduction
Over the last century, the environments in which children have been growing up have considerably changed all over the world. In the main, children nowadays live in urban environments. Since the early nineteen thirties, these changes in the children’s living environments have elicited researches to understand how children develop and deal with the opportunities and constraints encountered in these urban contexts.
The pioneer study conducted on “the life space of the urban child” by Martha Muchow (Muchow, 1935) in Hamburg has been followed by many other studies investigating the different cognitive and emotional aspects of the transactions that children establish with their urban environments (Görlitz, Valsiner, Harloff, & Mey, 1998; Hart, 1979; Lynch, 1977). Some of these researches examined more particularly how these environmental changes affected children’s behaviours (Wridt, 2004). Within this body of researches, the study conducted by Hillman, Adams & Whitelegg draws our attention on children’s independent mobility (Hillman, Adams, & Whitelegg, 1990). This study, which explores changes over time in English children’s mobility, was the first one to clearly demonstrate a drastic reduction of children’s outdoor independent movements within a twenty-year interval—i.e., from 1970 to 1990. This study received a heightened academic attention and has led to the development of policies supporting children's independent mobility (Whitzman, Worthington, & Mizrachi, 2010).
Since 1990, numerous investigations have been carried out to accurately analyse the degrees and forms of children’s independent mobility in different countries. On the whole, the studies conducted in western countries consistently report that children’s and teenagers’ independent mobility is currently quite restricted, many of the children being commonly accompanied by adults to and from school, but also to sport and leisure activities. It has even been argued that organized leisure activities contributed to less walking and cycling in relation to high time pressure in families, increased access to car(s) and easier access to parents as a 'transport service (Fyhri, Hjorthol, Mackett, Fotel, & Kyttä, 2011). On the other hand, parents’ willingness to act as “facilitators” for the transportation of their children is stimulated by the perception of the social and traffic dangers their children might be exposed to while moving without any adult supervision (Veitch, Bagley, Ball, & Salmon, 2006). Children’s activities seem to be increasingly controlled by adults and inscribed within very constrained daily and weekly schedules. Regarding the spatial issue, time restrictions and obligations are manifested by frequenting an “archipelago of spaces” which children are unable to visit on their own (Karsten & van Vliet, 2006). This implies that children must be accompanied and taken from one area of activity to another by their parents (Bachiri, Després, & Vachon, 2008). This evolution leads to increased distances between children’s places of activities (Witlox & Tindemans, 2006), associated with a reduction of autonomous movement, as well as a declining frequentation of nearby public spaces (Prezza, 2007).
Importance of independent mobility during childhood
Such an observed reduction in children’s independent mobility can entail detrimental effects on children’s health, development and well-being. Because getting lifts from parents involves a very passive form of transport, many studies focused on the consequences for children’s health of a decrease of “active” mobility and subsequently of physical activities (Page, Cooper, Griew, Davis, & Hillsdon, 2009). Passive mobility associated to sedentary plays—e.g., screen games—are likely to promote children’s overweight and obesity which are linked with a quantity of diseases (Giles-Corti, Kelty, Zubrick, & Villanueva, 2009; MacDougall, Schiller, & Darbyshire, 2009). However, beyond the legitimate interest for children’s health, Whitzman and colleagues stressed that “independent mobility” must not be confounded with “active mobility”, and thus must not be reduced to a narrow public health approach (Whitzman, Worthington, & Mizrachi, 2010). Independent mobility and free access to outdoor spaces contribute to the primary mechanism by which children become familiar with their physical and social environment and appropriate it (Valentine, 2004). Outdoor autonomous movements and development of spatial representations are closely interrelated. On the one hand, the growing ability to conceive spatial relations within the living environment facilitates the child’s independent mobility, while on the other hand free movements consolidate the elaboration of cognitive mapping of that living environment (Ramadier & Depeau, 2010; Villanueva et al., 2011). Along with cognitive and motor development free access and movements outdoors seem to have positive effects on the emotional equilibrium and well-being of children (Bagot, Kuo, & Allen, 2007). Moreover, being able to go to friends’ homes on their own as well as meeting friends outside without adult supervision are crucial for the construction of social relationships among peers and more generally for the development of social competences (Delalande, 2009; Prezza et al., 2001).
Factors shaping children’s independent mobility
Beyond the general trend pointing to a reduction in children’s independent mobility, results of various empirical studies also revealed some variations in the licenses granted to different children. Certainly, age stands as a primary factor of difference in children’s independent mobility (Fyhri, Hjorthol, Mackett, Fotel, & Kyttä, 2011; Legendre, 2010); nevertheless, how the diverse components of children’s independent mobility evolve with age still requires a closer scrutiny. Gender differences are regularly reported in the literature as well; boys generally showing earlier and more extended independent mobility than girls (O'Brien, Jones, Sloan, & Rustin, 2000). However, closer analyses suggest that the pathways to attain independent mobility are different in boys and girls, girls gaining a similar level of independence from adults by travelling more in groups (Brown, Mackett, Gong, Kitazawa, & Paskins, 2008). Moreover, the gap between gender in access to outdoor public spaces seems to vary depending on the amenities of the local environment (Legendre, Chouaïeb, Hermelin, & Forget, 2011). This draws the attention to the specific urban design attributes that may enable, support or restrict the development of unsupervised travelling to activity places.
Urban infrastructure, residential density and streetscape attributes can also shape children’s mobility (Oliver et al., 2011). The vicinity of play areas and green spaces in particular are likely to promote outdoor plays and to foster walking or cycling around freely in the neighbourhood (Blinkert, 2004; Burke, 2005; Gearin & Kahle, 2006). Other studies focused on the role of the social characteristics related to the family context. For instance, the type of housing (apartment vs. house) has also been shown to modulate the use of outdoor public space (Legendre & Gómez Herrera, 2011). Moreover, although the results of certain studies may present some variations, factors as income level, parents’ socio-cultural background, family-size or sibling-rank seem to intervene in the level of restrictions and licenses applied by the parents to their children’s for unsupervised movements (Pooley, Turnbull, & Adams, 2005).
Overall, the findings of the current studies incite to carry out further researches accurately examining the respective role of the various individual, social and geographical factors likely to influence the development of independent mobility. Especially, insufficient attention has been paid to the size and the spatial configuration of the cities as well as to the amenities the local areas provide to the young inhabitants.
Moreover, the effect of each factor can be modulated by others as they are embedded in complex systems of interdependences (Bronfenbrenner, 1979). Therefore, to gain a more comprehensive image of the development of independent mobility throughout childhood, it seems particularly relevant to set up analyses addressing how these factors combine to generate various profiles of children’s outdoor play and autonomous travelling.
Aims of the study
The general objective of the survey is to investigate how children’s independent mobility develops between seven and fifteen years of age. Specifically, one of the main purposes is to compare the degree of independent mobility of primary versus secondary school children. The degree of independent mobility is assessed through the examination of both children’s and parents’ statements about six licences related to outside trips without adult supervision. The objective is to provide a detailed picture of the current state of independent mobility in primary and secondary school children of French Brittany (North-West of France see fig 1).
Figure 1 Survey area: The district of Ille-et-Vilaine in French Brittany
In this respect, the study contributes to an international survey carried out in 16 countries (Shaw & Watson, 2010). This international survey was initiated by the Political Study Institute of London as an extended geographical replication of the original study of Hillman & al (1990). It is noteworthy that the comparison between countries is not the only aspect of the geographical extension. Within each country—accordingly in French Brittany—the survey is carried out in five areas ranging from the inner district of a big town to a rural area. Thus, the effect on children’s independent mobility of the urban density of the dwelling area can be assessed.
Particular to the French investigation, the second objective is to examine whether the six licences of independent mobility evolve from non to all licences gained in a unique pattern, or if different patterns of development can be observed. In the first case, the number of licences reported by children or parents would mainly grow depending on age and the succession of stages towards independent mobility would only show minor differences, starting for instance with licence to cross roads and ending with licence to go outside after dark. Conversely in the second case, the showing different profiles of independent mobility; for example some children could report a large autonomy of movement in the local neighbourhood but not the licence to go to school on their own, whereas other children of the same age would report a reverse pattern. This would evidence that beyond age, the access to a particular set of licences is tangibly modulated by other components of the living context. Therefore, our second objective is twofold. Firstly to identify and define the different profiles of independent mobility reported by the children as well as those reported by their parents. Secondly to find out whether particular arrays of individual, social or environmental factors are associated with these different profiles.
Methodology
The survey on children independendent mobility carried out in France in 2010-2011 replicated the survey conducted in England in 1971, in England and Germany in 1990 and 2010 (Hillman, Adams, & Whitelegg, 1990). Specifically, the British and the German versions of the questionnaires 2010 were used as template for the French version (Shaw et al., 2013).
1. Translation, adjustments and modifications of the questionnaires
The first stage consisted in a litteral translation of the Btitish version of the two questionnaires: “How you get about” and “How your child get about “. Then, in view of the German version, we adapted the French version rephrasing the questions to take into account French circumstances, as well as cultural and linguistic differences1.
For instance, regarding the question on children’s out of school activities, we added new activities, we changed the icons of some activities, and more significantly we also changed the time scope of the question, which was extended from the week-end to the whole week. The French school-schedule largely differs from both the English and German ones. In primary schools, the school day lasts longer, starting at 8:30 a.m. and finishing at 4:30 p.m., and there is a day off in the middle of the week on Wednesday. In secondary schools the timetable varies from one day to the other, but Wednesday afternoons are free, whereas the Saturday mornings are not necessarily off. This means that it is on Wednesday rather than at week-end that most French children’s activities take place—e.g. supervised sport or art activities.
In the parental questionnaire, some questions that could have been perceived as intrusive as regard to the French conception of privacy were removed, especially when they were not directly related to children independent mobility. This was the case for the question on the partner’s gender or the question whether the home was rented or owned with or without mortage—we noted that these questions were also removed in the German version.
Instead, we asked the parents about the type of housing: flat vs. house. A study conducted in suburban towns in France evidenced that the autonomous access to outdoor public spaces is significantly related to the children’s type of housing (Legendre, 2010; Legendre & Gomez, 2011). We also asked the respondent parents about their diplomas and level of education and whether their household was a single parent family.
1 It has to be considered that any translation from English into French leads to a noticeable size increase (10% to 15%). Moreover, some questions that seemed simple and evident in English, once translated appeared too vague and could be interpreted in different ways. We had to make them more precise, French language requiring a greater accuracy in the formulation of the questions. Thus, as compared to the English version of the children’s questionnaire the French one is longer (7 pages vs. 6 pages). Of course, it had an incidence on the duration necessary to fill up the questionnaire in the classrooms (filling up durations range from 30 to 60 minutes). This led us to adapt the survey procedure, especially with the younger children (see hereafter survey procedure).
An explicit question on potential functional impairment that might affect the child’s independent mobility was added in both children’s and parents’ questionnaires. In the latter we asked parents to explain how and to what extent the impairment affects their child’s independent mobility. In this respect it is noteworthy that the French sample involved two classes for special need children, most of them with major learning difficulties.
A few other minor modifications were also inserted in the questionnaires, but the greater part of the French questionnaires was similar to the Anglo-German questionnaires in order to make possible an international comparison.
Questionnaire proofing
Once the translation and the adaptation of the questionnaires were realized, we tested them with children of different ages and genders as well as with their respective parents. A few additional linguistic adjustments were made after these questionnaires were individually filled up. Finally, the last adjustments in the questionnaire for children were made after the start of the survey in two primary classes. Namely, we changed negative interrogative questions—grammatically complicated in French—for direct interrogative questions, and we changed the order of question 10. This question is complicated to answer; it was placed at the beginning of the questionnaire when children were the most inclined to pay attention to explanations. (The final French versions of the questionnaires are presented in annexes 1 and 2 respectively for children and for parents.)
2. Survey procedure
Children’s questionnaires.
The children’s questionnaires were completed in their respective schools. Three modes of completing the questionnaire were designed depending on age.
Self completion. Two researchers were present in the classroom. They introduced
the general aims of the study and explained how to fill up the questionnaire. Then children completed the questionnaires by themselves, the two researchers answering any individual questions. This procedure was used with secondary school children.
Step-by-step completion. The procedure was basically the same as the previous one,
but instead of letting the children answer the questionnaire alone, one researcher read each question before the whole group answered that question. This procedure permitted to better adjust to the children’s interrogations about a specific question; this was particularly helpful as regard to conditional questions that are difficult to handle for primary school children. It avoided simultaneous questions on different points of the questionnaire. The other researchers—at least one but most often two, sometimes assisted by the teacher—helped the children who encountered difficulties. This step-by-step completion permits to maintain the same timing and
thus the cohesion of the whole group. This procedure was used with fourth and fifth graders (CM1 CM2) and sometimes with sixth graders (6éme) in secondary school.
Assisted completion in small groups. The children completed the questionnaire
under the form of a directive interview conducted by a researcher with a small group—generally in groups of 4 to 6 children, but in dyads with the special need children. The researcher read and explained the questions, helped the children to select which case to tick and if necessary wrote the children’s answers. Three small groups worked simultaneously in a room next to the classroom. This procedure necessitated 90 minutes per class. It was used with second and third graders (CE1, CE2) and special need children (CLIS). Although time-consuming, this procedure provided us with interesting insights into the younger children’s understanding of the questions. Furthermore, children’s commentaries permitted a deeper understanding of the contexts and activities associated with independent mobility. This interview mode was particularly interesting regarding their perception of safety, as children wished to describe the experiences related to their answers.
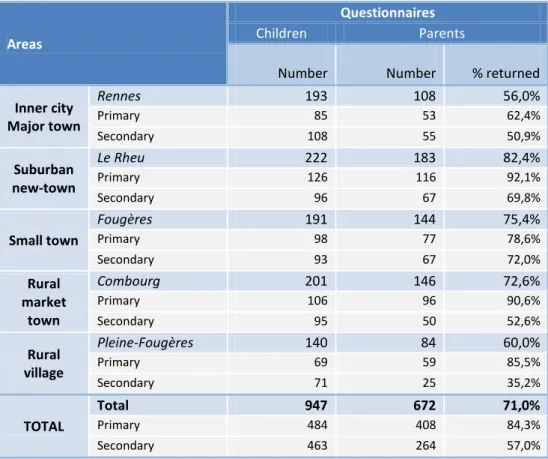
A total of 947 children participated in the French survey. Table 1 indicates the number of children surveyed per area and school type.
Parental questionnaires.
The parental questionnaires were distributed to the children in the classrooms. They were given to the children in an envelope with a letter for the parents explaining the aims of study and the measures taken to guarantee that the responses will remain anonymous. The same code appears on both the child’s questionnaire and on the corresponding parental questionnaire, so that it was possible to match them without any mention of the participant names.
The children took the questionnaire home so that their parents filled it as soon as possible, optimally the very same day. Once the parents had completed the questionnaire, children brought them back to school either to their teachers in primary school or to the office in secondary school. The parental questionnaires were sealed in an envelope, thus nobody else than the research team could have a look at them.
A total of 672 parental questionnaires were returned, that is 71%. However, the percentage of returned parental questionnaires is markedly higher in primary school (84.3%) than in secondary school (57.0%). Table 1 shows that the percentage of returned parental questionnaires also varies depending on the area, the highest rate is observed in the suburban new-town whereas the lowest rate is observed in the inner city of Rennes the major town.
Table 1 Children’s and parents’ questionnaires per area and school types
Areas
Questionnaires
Children Parents
Number Number % returned
Inner city Major town Rennes 193 108 56,0% Primary 85 53 62,4% Secondary 108 55 50,9% Suburban new-town Le Rheu 222 183 82,4% Primary 126 116 92,1% Secondary 96 67 69,8% Small town Fougères 191 144 75,4% Primary 98 77 78,6% Secondary 93 67 72,0% Rural market town Combourg 201 146 72,6% Primary 106 96 90,6% Secondary 95 50 52,6% Rural village Pleine-Fougères 140 84 60,0% Primary 69 59 85,5% Secondary 71 25 35,2% TOTAL Total 947 672 71,0% Primary 484 408 84,3% Secondary 463 264 57,0%
School selection and recruitment
All the primary schools (n= 8) involved in the survey were state funded schools. In all the five areas a state-funded secondary school participated in the survey; in one of the area—rural market town—two secondary schools participating in the study: one state funded school (6th and 8th grades) and one private school (7th and 9th grades). The primary schools were all ‘feeder’ schools for the secondary schools that were surveyed.
The French research team asked permission for the research from the relevant local authority (Éducation Nationale, Inspection d’Académie d'Ille-et-Vilaine), then liaised with the head-teachers to explain the research objectives and procedure. None of the primary schools refused to participate in the study. The head-teachers asked the teachers of the different year groups whether they were willing to participate. On two occasions, it was not possible to have a complete sample of all the year groups in the same school; thus we contacted the nearest primary school in the same area. Once the teachers had agreed, information about the survey was sent to the pupils’ parents for their consent, giving them the opportunity to opt out (see annexe xx).
A similar procedure was used in secondary schools; the only difference was that we did not have to ask the teachers for agreements because the survey was not conducted during teaching periods but during free periods on schooldays. From all the parents asked very few
of them opted out (n = 5). The children were also given the opportunity to opt out; which some of them used because they preferred to do their school work (n = 6). On the whole, less than 1% of the children or parents refused to participate in the survey.
The junior schools were all ‘feeder’ schools for the secondary schools that were surveyed (e.g. once the children left their junior school at age 11, they usually joined the secondary school in their area that was surveyed). A more detailed description of the surveyed English areas in 1990 can be found in One False Move, p113-116 (ref).
Participant recruitment and data collection
In line with accepted ethical guidelines on involving children in research studies, consent was sought from the ‘responsible adult’ in each school (the Head Teacher or Principal) to survey the children. A letter drafted by the researchers was then sent home to each child’s family at least two weeks in advance of the study by the Head Teacher, on school headed paper, outlining the nature and objectives of the study and providing an option to opt their child out of the study without any consequence for their child, with a prepaid envelope addressed to the school. The outline of the letter provided to the schools can be seen in appendix xxx. These opt-out forms were collected on the day of the survey, and used by the researcher to ensure that only children with parental consent were surveyed.
In each class, the researcher explained the research to the children using a pre-prepared script pitched to the appropriate level, which can be seen in appendix xxx. Each child was given the option to opt-out of any or all questions. No children in England or Germany refused to participate in the study on the day. After the study, each child was given an envelope to take home to their parents containing a questionnaire. They were also given a participant information sheet to let them who conducted the research and its purpose. This participant information sheet can be seen in appendix xxx.
The areas surveyed
In the French survey, the five types of areas were selected in the same region, namely the district (département) of Ille-et-Vilaine in French Brittany. Therefore, the survey design, which gathered data from different types of areas, was likely to provide a comprehensive picture of the independent mobility of the children living in that particular region. Furthermore, insofar as the data were collected in a homogeneous geographical feature (i.e., similar political, cultural, physical and climatic environment), the design enhances the possibility to assess the specific impact of city size and urban density on children’s independent mobility.
1) Rennes: inner district of a major city. Rennes is the major town of French Brittany. Yet, it is not a very big town in itself (208 000)2, but it is an attractive city and the population of Rennes and its suburbs (578 000) has steadily increased over the last decade. The city of Rennes has the highest density of the five survey sites with 4159 inhabitants per Km². Among the inhabitants of the city, 7 to 10 year-old children and 11 to 15 year-old-children represent respectively 3.4% and 5.2% of the population. These percentages are lower than the corresponding percentages for France (4.9% and 7.3%) and other French towns of the same size (4% and 6.2%). This is mainly due to the fact that in Rennes university students represent 20% of the population. Regarding social and occupational categories, Rennes does not tangibly differ from other French towns of the same size although it has a slightly higher rate of unemployment (8% vs. 6.5%). It is noteworthy that the survey was carried out in primary and secondary schools of the north-eastern district of the town that is inhabited by a higher proportion of lower and lower-middle class people. Flats represent 85% of the type of housing and 74% of the households have at least one car. This is the lowest percentage of car-owning among the five survey sites; it may be related to a good quality network of public transport in the city (underground and buses).
2) Le Rheu: suburban new town. Le Rheu is a small town located in the suburban area of Rennes (9km from Rennes center). There are 7300 inhabitants and the density is 380 inhabitants per Km². The population has multiplied by 2.5 during the last forty years. In contrast with Rennes, the proportions of both 7 to 10 year-old children (6.5%) and of 11 to 16 year-old children (8.3%) are noticeably higher than in overall France and slightly higher than in similar suburban cities (5.7% and 8.2%). They are the highest among the five survey sites. Le Rheu is also characterized by higher percentages of professional, administrative and managerial occupations (18.1%) as well as intermediate occupations (21.6%) than the other survey sites. Another particularity is the higher rate of mono-parental families (9.6%). Housing mainly consists of houses (60%). The level of car-ownership (92%) is the highest of the five survey sites. It is noteworthy that the urban planning of the city associates urban development to green spaces. In particular, this means that all over the city many pathways for walking and cycling have been designed. 3) Fougères: small town. Fougères has 20680 inhabitants and its density is of 2070
inhabitants per Km². It is worth mentioning that the population has been constantly
2
Statistics mainly rely on data available on http://www.insee.fr/fr/ that is the official site of INSEE (National Institute for Statistics and Economical Studies). They have been retrieved in May 2011, and correspond to the yearly statistical data adjustment made by INSEE in 2010.
decreasing since 1968. Comparatively to same sized towns, the proportion of children in the population is lower regarding either 7 to 10 year olds (4% vs. 4.9%) or 11 to 16 year olds (6.8% vs. 7.4%). Moreover, the proportion of retired people is important and represents 37% of the households. The percentage of workers (21%) is also higher than in other towns of the same size. Flats correspond to the main type of housing (57%) and 79% of the households have a car. The city offers a bus service but there is no special urban design of pathways likely to promote walking or cycling.
4) Combourg: rural market town. There are 5400 inhabitants in Combourg and the density is of 84 inhabitants per Km². The population is slightly but constantly increasing. The percentages of 7 to 10 year-old children (5%) and of 11 to 16 year-old children (7.2%) are a little higher than in other French market towns. Regarding, In Combourg social and occupational categories do not noticeably vary from other market towns. It is worth mentioning that more than 90% of the households are living in a house and that 83.8% of them have a least one car.
5) Pleine-Fougères: village in a rural area. There are 1800 inhabitants in Pleine-Fougères, which shows the smallest density of the five survey site with 56.5 inhabitants per Km². The population has remained quite stable over the last forty years. The percentages of 7 to 10 year-old children (4.8%) and of 11 to 16 year-old children (6.6%) are slightly lower than in other French rural areas. The percentage of retired people is quite high (43.6%). As in Combourg, 91% of the households are living in a house and 84.1% of them have a least one car. Most of the children attending the primary school live in the village or close nearby, but the children attending the secondary school come from a large rural area around Pleine-Fougères. Some of these children spend up to 2 hours per day in school-bus journey to and from school.
Findings
1 Findings grouped by primary and secondary school children
i. The six licences of independent mobility
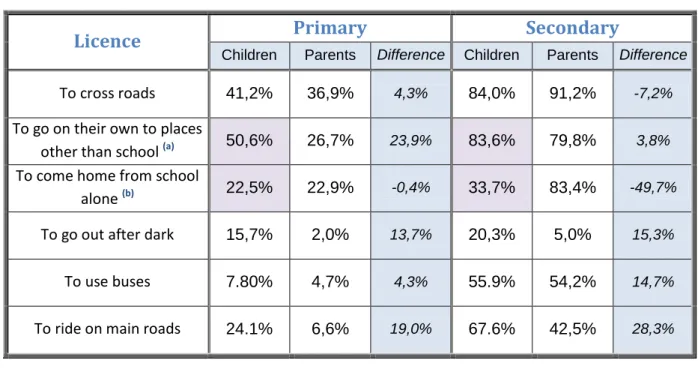
Table 2 shows the percentages of positive responses regarding each of the six licences of the French sample. These percentages are based on the responses of 485 primary school children [Psc] and 463 secondary school children [Ssc], as well as on the responses of the parents of these children--i.e., 406 parents of Psc, 259 parents of Ssc. Therefore it is possible to compare the children’s and parents’ responses as regard to the six licences.
Table 2 shows that, in general, children claim to have a particular licence more often than parents declare to grant their children that licence. For both primary and Ssc, the differences between children’s and parents’ responses are particularly obvious as regard to the licence to ride on main roads and, to a lesser degree, the licence to go out after dark. One can also observe a marked divergence between Psc and parents regarding the licence to go on their own to places other than school.
The data collected does not permit either to explain these differences or to establish the respective role of the various factors that may trigger different responses in parents and children. Differences might be related either to actual children’s behaviours that parents ignore, to social postures—children’s claims for independence versus parents’ desire to show concern and control for their child security--, or divergent cognitive representations— e.g., “main roads” might correspond to different environmental features for children and parents.
A reverse pattern can be observed for two licences. Regarding the licence to cross main roads, this might be due to a different meaning for parents and young people of what a “main” road is. Regarding the licence to go to school and come back home alone this is related to the fact that the percentages are not computed for parents and children on an equivalent basis (see note b Table 2).
Table 2 The Six Licences: Comparison of Children and Parents' Responses
Licence Primary Secondary
Children Parents Difference Children Parents Difference
To cross roads 41,2% 36,9% 4,3% 84,0% 91,2% -7,2%
To go on their own to places
other than school (a) 50,6% 26,7% 23,9% 83,6% 79,8% 3,8%
To come home from school
alone (b) 22,5% 22,9% -0,4% 33,7% 83,4% -49,7%
To go out after dark 15,7% 2,0% 13,7% 20,3% 5,0% 15,3%
To use buses 7.80% 4,7% 4,3% 55.9% 54,2% 14,7%
To ride on main roads 24.1% 6,6% 19,0% 67.6% 42,5% 28,3%
Notes.
Percentages are based on the total number of respondents taking into account positive, negative or missing responses.
Difference = children’s percentage – parents percentage
(a)
Regarding the licence “to go on their own to places other than school”, in the parents’ columns the percentage corresponds to the sum of the responses "usually goes alone" and "varies". If we consider only the most restrictive response "usually goes alone", these percentages are respectively 8.6% and 43.3% for primary and secondary school children.
In the columns “children” the percentage corresponds to the proportion of children that declared that they went out for an activity on their own or with another child. The licence was counted when at least one activity was ticked.
(b)
Regarding the licence “to come home from school alone”, we considered the children’s response as positive whenever a child responded that they either travelled home or to school alone or with children of the same age or younger. It is noteworthy that in the children’s questionnaire these two questions (to school, back home) were associated with the particular day on which the child responded to the questionnaire. Thus, these percentages do not take into account the possibility that the child travelled on their own on other occasions. On the opposite, the question addressed to the parents was not restricted in time. Thus the percentage corresponds to the fact that the licence has been granted to the child to go to school or to come back home on their own, even if it is only on an occasional basis (primary school children) or that the child ordinarily have to take the school bus because the school is too fare (secondary school). This certainly explain why the proportion of positive response is higher in parents’ responses than in children’s ones for this licence.
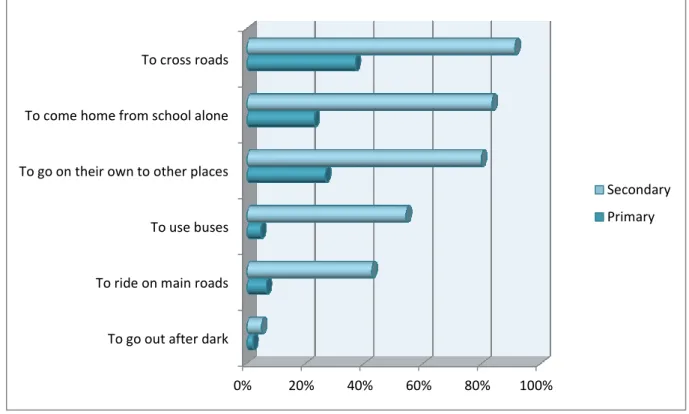
Figure 2 Progression of the Six Licences from Primary to Secondary School: The Parents’ Point of View
Figure 2 compares the licences granted by parents to Psc to those granted to Ssc. The chart shows that the hierarchy of the six licences is almost the same in the two types of schools. However, for each of the six licences a marked difference can be observed between the two groups. It denotes important changes in the parental attitude towards these licences within the considered age range.
The licence to cross main roads is the most frequently granted in the two groups. Almost all the secondary school youth are allowed to cross main roads on their own whereas only one third of the Psc are allowed to do so. Similarly, the bulk of young people can travel from home to school or go to other places on their own, whereas less than one fourth of Psc is allowed to do so. The results for these three licences indicate that these aspects of independent mobility are already granted in secondary school. It will be examined whether these permissions develop regularly between 7 and 10 or if they show a sudden increase when the children move from primary to secondary school (see 2.i.: The impact of age). The next two licences—i.e., to use the bus and to ride on main roads—are granted to approximately half of the young people. This signifies that they are progressively granted while the children are in secondary school. We can see that these two licences are exceptionally granted to Psc. Finally, we observe that both primary and Ssc groups are not allowed to go out after dark.
0% 20% 40% 60% 80% 100%
To go out after dark To ride on main roads To use buses To go on their own to other places To come home from school alone To cross roads
Secondary Primary
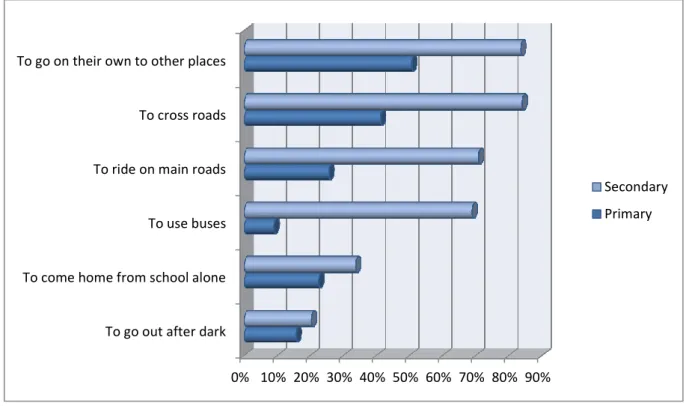
Figure 3 Progression of the Six Licences from Primary to Secondary School: The Children’s Point of View
The Figure 3 displays the progression of the six licences from the children’s point of view. One can observe that the gap between primary and Ssc is less marked that in the parents’ perspective. The second striking difference is that the children’s hierarchical order of the six licences tangibly differs from the parents’.
One can also observe that the hierarchy of the six licences shows some divergences when comparing primary to secondary school. This is particularly the case for the licence to use bus. It is the least frequent for Psc whereas for Ssc it comes in fourth rank--a high proportion of them declaring to use buses independently. The ability to use public transports is clearly acquired when the children are at secondary school. The other remarkable difference is related to the liberty to ride on main roads, which shows a substantial increase from primary to secondary school. Finally, it is noteworthy that the licence to go on their own to places other than school is the most frequently claimed by Psc.
0% 10% 20% 30% 40% 50% 60% 70% 80% 90% To go out after dark
To come home from school alone To use buses To ride on main roads To cross roads To go on their own to other places
Secondary Primary
ii. The journey to and from school
Mode of transport
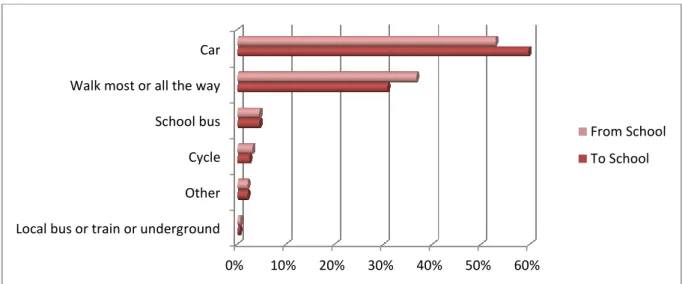
Primary School. Two modes of transport prevail in the journeys to and from French primary
schools—i.e., nearly 90% of the children travel by car (one half) or walk (one third). Interestingly, the chart shows that 6% of the children getting to school in a car go back home walking. This is probably due to the fact that it is difficult for some parents to be available at 4:30 p.m. when primary school ordinarily finishes. The other modes of transport are clearly a minority, the most important one (school bus) representing less than 5% of the modes of transport.
Figure 4 Children’s Modes of Transport to and from Primary School
Figure 5 Children’s Modes of Transport to and from Secondary School
Secondary School. The mode of transport prevailing among Ssc is the school bus, which is
used to go to and back from school by over 40% of those children. Nevertheless, three other modes of transport are also largely used by Ssc; altogether they represent approximately
0% 10% 20% 30% 40% 50% 60%
Local bus or train or underground Other Cycle School bus Walk most or all the way Car From School To School 0% 10% 20% 30% 40% 50% 60% Other Cycle Local bus or train or underground Car Walk most or all the way School bus
From School To School
55% of the juniors’ travels. Walking appears as the most important mode, it precedes travelling by car or by public transport (mainly local bus, underground applying only to some children in the city of Rennes).
We also observe some changes in the mode of transport used to get to school as compared to those used to go back home. School buses and especially cars are used more frequently to get to school, but their use decreases to go back home to the benefit of walking (+5%) and local buses (+ 4%). As for Psc, similar reasons may be considered regarding the decrease in the use of car to go back home, yet the varying schedule of courses from one weekday to another in secondary schools may also account for these changes. For instance, when the class ends early, it might save time to go back home walking or using local buses than to wait for a school bus or parents to pick you up.
Household access to cars and children’s modes of transport from schools
There is no observable difference in the number of cars per household depending on whether the respondents were parents of primary or Ssc. In the French sample, 62% of the households have access to two or more cars, 31% have access to one car and 7% have no regular access to a car.
Chart x.fr Household regular access to cars
We examined whether the number of cars per household was related to the children’s mode of transport to school (specifically we considered the mode of transport for the travel back from school, which may be less constrained by a strict schedule). In order to test potential significant associations between each mode of transport and the number of cars available in the household, we used a statistical procedure relying on Bayesian inference models (Bernard, 2003). Specifically, we ran a computer program designed to analyze the association rates in contingency tables (BAYYACT: Bernard, 2000). It permits to assess whether the number of responses appearing in each cell of the table is over- or
under-0% 10% 20% 30% 40% 50% 60% 70% No 1 car 2 or more cars
Number of car per household
School Primary Secondary
represented as to the total distribution of the responses (e.g., is walking to school under-represented among children belonging to households with two cars or more). Hereafter, we will only consider the association that are inductively attested with a level of guarantee equal or superior to 95%.
Firstly we examined potential relations for Psc. Not surprisingly, among the children belonging to a household with no car we found that walking back from school was a mode of transport over represented and that travelling back in a car was highly under-represented. More surprisingly, a similar pattern of results was observed among those belonging to a household with only one car; however the association rates were moderate. Finally, a reverse picture emerged among the children belonging to households with two or more cars. We observed both an under representation of children walking and an over representation of those travelling by car.
Regarding secondary school: children belonging to households with 2 or more cars were found to show an under representation for walking and an over representation for travelling by car, but the association rates were moderate. In children belonging to households with one car, we observed a reversed pattern: over representation of those walking and notable under representation of those going back by car. We did not find any attested association for
Ssc belonging to households with no car. No association emerged either for any of the other
modes of transport (school bus or local bus). On the whole, the association rates between the number of cars per household and the children’s modes of transport were weaker in secondary schools than in primary schools.
Preferred mode of transport to school
Nearly half of the Psc asked chose the bicycle as the preferred mode of transport to school. Walking and travelling by car represent second and third choice respectively. However, the percentages of primary children choosing these last two modes are notably lower than those who chose cycling. Concerning Ssc, the choice is more largely dispersed over five main modes of transport. Nevertheless, the car emerged as the most preferred mode among these young people (25%), the school bus appearing as second best.
Chart xx Preferred modes of travel in primary and secondary school children
Actual and preferred mode. Only one fourth of Psc have the opportunity to travel to school
by their preferred mode. This percentage is higher for Ssc (38.4%). To explain this result we examined further the concordances and discordances between preferred and actual travelling mode.
Chart xx Proportion of children travelling by preferred mode
Chart xx shows the concordances between the preferred and the actual travelling modes of transport. Regarding Psc, the highest percentage of concordance between the expressed preference and the actual travelling mode is observed for walking, while going to school by car comes second best. It is noteworthy that cycling represents a very small percentage of the concordance between preferred and actual travelling mode. Regarding Ssc the highest percentage of concordance between the expressed preference and the actual travelling mode is observed for the school bus; probably because it provides an occasion for peer encounters. Here too, going to school by car comes in second rank, while walking and local transport represent each nearly 20% of the concordances.
0% 10% 20% 30% 40% 50%
Motorbike Scooter missing value Other Local bus /underground School bus Walk Car Cycle Secondary Primary 0% 10% 20% 30% 40% 50% 60% 70% 80% 90% 100% Primary Secondary No Yes
Chart xx Concordance between preferred and actual travelling mode
Chart xx Discordance between preferred and actual travelling mode
Conversely, table xx shows the discordances between the preferred and the actual travelling modes of transport. For Psc, two thirds of the discordances are related to cycle. We have seen that for these children, cycling is the very first expressed preference for travelling to school; yet, it rarely corresponds to the actual travelling mode. This discrepancy may explain why in primary school a higher percentage of children not travelling by their preferred mode of transport can be observed. Regarding Ssc, the highest percentage of discordance is related to children who wished to go to school by car but who did not travel by car. Divergence about cycling to school only appears in the second rank.
0% 10% 20% 30% 40% 50%
Other Cycle Local bus /underground School bus Walk Car Secondary Primary 0% 10% 20% 30% 40% 50% 60% 70% Other School bus Walk Local bus /underground Car Cycle
Secondary Primary
Accompaniment to school
Primary school. About two thirds of Psc are accompanied by their parents when they go to
or come back from school. These travels to or from school with parents often include several other younger or older children, most likely siblings. Accompaniment by other adults does not concern more than 10% of the children. One can observe a change in the accompaniment between going to and coming back from school. Parental accompaniment decreases in the afternoon as compared to the morning; while in the morning it is easy for working parents to accompany their children to school, school finishes too early (4:30 p.m.) for them to pick up their children. If many children stay at school –i.e. after school club--until parents can pick them up, for some others an alternative solution is chosen. Accompaniment by another adult as well as travelling alone partially compensates for the decrease in parental accompaniment.
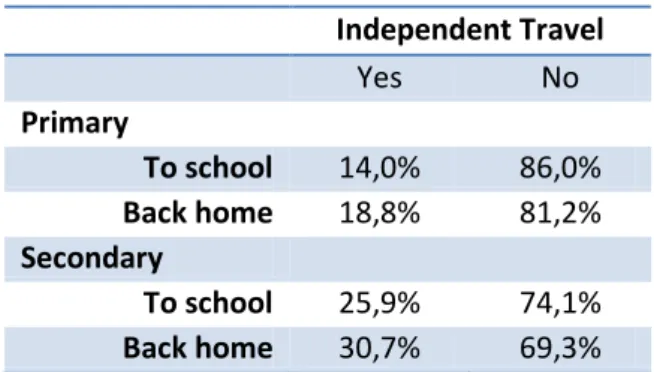
Table xx Independent travel to and from school
Independent Travel Yes No Primary To school 14,0% 86,0% Back home 18,8% 81,2% Secondary To school 25,9% 74,1% Back home 30,7% 69,3%
This accompaniment change affects children independent mobility. As a matter of fact, if we consider together travelling alone and travelling with peers or younger children—i.e., to the exclusion of any accompaniment by parents, another adult or older children—we can see that a larger percentage of Psc travel independently when coming back home from school than when going to school (see table xx).
Chart xx Accompaniment to Primary school
Chart xx Accompaniment to secondary school
Secondary school. In secondary schools, the accompaniment pattern is quite different from
the one observed in primary schools. Only a minority of children is accompanied by their parents, while travelling in school bus induces an accompaniment with another adult (bus driver) as well as other older, same-aged or younger children. The higher percentage observed for the category “same age or younger children”, is likely associated with peer accompaniment when taking a local bus or walking to or from school. Chart xx also shows that these young people infrequently travelled alone.
Finally, alike what is observed for Psc, in the afternoon parental accompaniment decreases whereas independent travel increases (see Table xx).
0,0% 10,0% 20,0% 30,0% 40,0% 50,0% 60,0% 70,0% 80,0% Another adult Alone Older children Same age or younger Parents To school Back home 0,0% 10,0% 20,0% 30,0% 40,0% 50,0% 60,0% 70,0%
Parents Alone Another adult Older children Same age or younger To school Back home
Duration of journey to school
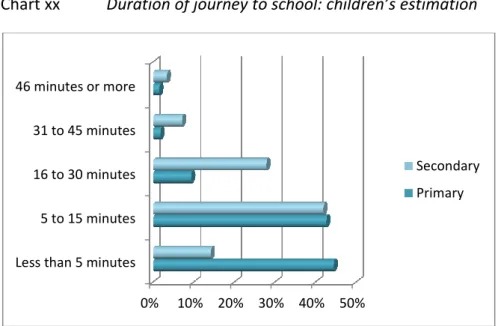
The duration of the journey to school is markedly shorter for Psc than for Ssc (Contingency coefficient = .35; exact test: p<.001).
For Psc the journey lasts less than 5 minutes for nearly half of them, and it does not exceed 15 minutes for 87% of them. However, for some young children (3.4%) this duration exceeds 30 minutes! This can be explained by the fact that most of them (13/15) live in a rural area. Regarding Ssc, the duration of the journey is less than 5 minutes for only 14% of them. Whereas it exceeds 15 minutes for nearly 40% of them and even 30 minutes for 10% of them.
Chart xx Duration of journey to school: children’s estimation
These results rely on children’s estimations, thus they must be considered with caution particularly when they come from Psc. It is noteworthy that whereas 10.1% of the Psc were unable to estimate the duration of the journey, only one of the Ssc (0.2%) was unable to do so. The correlation between distances estimated by parents and the duration of the journey effectively estimated by children is lower for primary than for Ssc: rs = .36 (n = 251, p< .01) and rs = .50 (n = 258, p< .01)
Table xx Distances from home to school estimated by parents (percentage of responders)
Distance Under 0.5 km 0.5 to 1km 1 to 2 km Over 2 km
Primary 25.8% 23.7% 15.0% 35.5%
Secondary 8.9% 13.1% 11.6% 66.4%
Total 17.8% 28.7% 13.4% 50.2%
Percentages are based on the number of responding parents (18.4% of the parents did not respond to this question).
0% 10% 20% 30% 40% 50% Less than 5 minutes
5 to 15 minutes 16 to 30 minutes 31 to 45 minutes 46 minutes or more Secondary Primary
Thus, in order to accurately analyse how distances estimated by parents and the duration of the journey estimated by Psc relate, we ran a Bayesian statistical analysis designed for tables of contingency.
When the distance estimated by parents is shorter than 500m, we observe that a smaller number of Psc were unable to estimate the duration of the journey. In this case the response “less than 5 minutes” was notably over-represented whereas the other types of response were under represented (results attested inductively with a guarantee > 95%). On the opposite, when the distance estimated by parents exceeds 2km the number of children unable to estimate the duration of the journey is over-represented. However, for the children that answered the question, responses of the type “less than 5 minutes” were logically under-represented whereas those indicating durations superior to 15 minutes were over-represented. No over- or under-representation emerged in children’s types of responses when the distance estimated by parents fell between 0.5 km and 2 km. In the latter case the children’s responses appear randomly distributed; this result suggests that it seems more difficult for Psc to accurately estimate the durations of journeys for intermediary distances (0.5 to 2km) than for shorter or longer ones.
Choice of the school: Distance and other reasons.
Most children attend the nearest school: respectively 80% and 84% for primary and Ssc (see Chart xx). Less than one fifth of the children do not attend the nearest school, and the reasons given by their parents are quite diverse.
Chart xx Proportion of primary and secondary school children attending the nearest school
Chart xx shows that among the proposed reasons the one that was most frequently given by parents was that they did not want to send the child to the local school and preferred a specific school elsewhere. This reason is followed by: “moved home after the child started
0% 10% 20% 30% 40% 50% 60% 70% 80% 90% 100% Primary Secondary Nearest School No Nearest School Yes
school” and “travel easier”. The last two reasons – “wanted a specific type of school (faith school, performing arts, etc)” and “no place available at the local school” – do not represent an important part of the reasons given to explain why the child does not attend the nearest school.
Chart xx Reasons given for not attending the nearest school
However, the chart also shows that the majority of the parents (63/123) ticked “other reasons”. A close examination of the responses permitted to identify 6 main themes. The first one (n = 15) is related to the wish to explain what sort of specific school they were looking for; among which: a state school because the nearest one was a faith school, facilities adapted to disabled children, type of foreign languages taught in the school, small-sized school and good reputation of the school. The second type of reasons mentioned is related to particular administrative constraints (n = 12). In France, the choice for state schools is largely determined as a function of the geographical area in which your home is located. In some cases, a school depending from another administrative district could be the nearest to your home. This reason was mainly mentioned by parents of Ssc. The third theme is related to parents’ working-places (n = 10): either in the school itself or in the immediate vicinity of the chosen school. The fourth one put forward was alternating custody (n = 7), which resulted in an agreement between separated parents who lived in different places. Interestingly the fifth theme corresponds to parents concerned with preserving continuity in the child’s experience of school (n = 6). These parents moved but they let their children attend the school they are used to and in which they have friends. Finally, the fifth theme emerging is related to the vicinity of the school, pre-school or day care centre of the child’s siblings (n = 5).
Other reasons
Preferred another school Moved home
Travel easier
Wanted a specific school No place available
iii. Non school travel and activities Parental attitudes regarding non school travels
The examination of the parents’ responses regarding their children‘s non school travels reveals a notable difference between primary [Psc] and secondary school children [Ssc]. Chart xx shows that nearly three-fourths of Psc’s parents responded that their child is usually taken to places other than school that are within walking distance. This type of response falls to less than one-fifth for Ssc. Besides, 45% of the parents of Ssc responded that their child usually goes on their own; this was the response of only 9% of Psc’s parents. Likewise, fewer Psc’s parents than Ssc’s parents responded that their child is sometimes allowed to go to non school activities alone, even if these are within walking distance. Additionally, the approximate number of round trips made each week to accompany the child elsewhere than school is markedly higher for Psc (m = 3.16, std = 0.18) than for Ssc (m = 1.76, std = 0.16); the test is significant : (t(665.1) = 5.90, p < .001).
Chart xx Parental accompaniment to other places than school: primary vs. secondary school children
On the whole, these results highlight a clear differentiation in parental attitudes toward children’s non school travels depending whether children attend primary or secondary schools. Parents’ responses suggest that they have a very tight control on the travels of children under 11. We observe a substantial change in the parental attitude towards non school travels of older children who beneficiate of a larger autonomy.
0% 10% 20% 30% 40% 50% 60% 70% 80%
Usually taken Varies Usually goes alone
Primary Secondary