HAL Id: hal-00839321
https://hal.archives-ouvertes.fr/hal-00839321
Submitted on 28 Jun 2013
HAL is a multi-disciplinary open access
archive for the deposit and dissemination of sci-entific research documents, whether they are
pub-L’archive ouverte pluridisciplinaire HAL, est destinée au dépôt et à la diffusion de documents scientifiques de niveau recherche, publiés ou non,
MeDUSA: a sage-based tool for computing the
stoichiometric capacitance of a metabolic network
Marko Budinich, Damien Eveillard, Jérémie Bourdon, Abdelhalim Larhlimi
To cite this version:
Marko Budinich, Damien Eveillard, Jérémie Bourdon, Abdelhalim Larhlimi. MeDUSA: a sage-based tool for computing the stoichiometric capacitance of a metabolic network. 2013. �hal-00839321�
MeDUSA: a sage-based tool for
computing the stoichiometric
capacitance of a metabolic network
Marko Budinich1,2, Damien Eveillard1, J ´er ´emie Bourdon1 &Abdelhalim Larhlimi1
1
Computational Biology group, LINA, Universit ´e de Nantes, EMN, CNRS UMR 6241, Nantes, France
2
Centro de Modelamiento Matematico, Universidad de Chile, UMI 2807 CNRS, Santiago, Chile
O
ptimization-based analysis of metabolic networks have beenused to design metabolic engineering strategies aiming at en-hancing the production of a target of interest. Here, we present MeDUSA, a comprehensive tool for the calculation of a stoichiomet-ric capacitance allowing for increasing the maximum production of a given product.
MeDUSA provides an extensive sage-based package which, given a metabolic network and an objective function, (i) computes a stoichio-metric capacitance and (ii) investigates the effect of adding the calcu-lated stoichiometric capacitance. The package MeDUSA and a tuto-rial are available from https://logiciels.lina.univ-nantes.fr/medusa/.
1 Introduction
Optimization-based analysis of metabolic networks has proved valuable in designing metabolic engineering strategies aiming at enhancing the production of a target of interest. Several approaches have been proposed, most of them are based on the seminal approach flux balance analysis (FBA) [1], which investigates reaction fluxes in a metabolic network at steady state. Recently,
[2] proposed a novel method which identifies a suitable chemically feasible transformation, called stoichiometric capacitance, allowing for a significant increase in the metabolic network capabilities. In extension to this, we present our tool MeDUSA (MEtabolic Design Using SAge) which, given a metabolic network and an objective function, (i) computes a stoichiometric capacitance (SC) and (ii) investigates the effect of including in the model the calculated SC. MeDUSA has been implemented using Sage, a free open-source python-based software that smoothly handles the use of advanced optimization packages [3].
2 Description
MeDUSA provides a comprehensive set of methods that mainly implement the algorithm proposed by [2] to compute a stoichiometric capacitance of a given metabolic network. As a first step, all the data necessary for the capacitance calculation can be loaded by simply calling the function create model. The resulting object, which offers a nice interface to analyze the created metabolic model, is subsequently used to build the corresponding MILP problem and calculate the stoichiometric capacitance using the function capacitance. The later smoothly uses advanced optimization solvers with no need of an expertise in constraints programming. To further analyze the consequences of adding a stoichiometric capacitance to a given model, MeDUSA makes use of Flux Variability Analysis (FVA). This results in partitioning the set of reactions into four distinct types: blocked (unable to carry a non-zero flux in any condition); excluded (unable to carry a non-zero flux in all optimal metabolic pathways); indispensable (carrying a non-zero flux in all optimal metabolic pathways) and the remaining reactions are called alternative. The results obtained by performing FVA, with and without adding the calculated stoichiometric capacitance, can be exported in different graph formats, allowing data exchange with standard graph tools like Graphviz [4] and Gephi [5]. For more details, we refer to the tutorial available from https://logiciels.lina.univ-nantes.fr/medusa/.
3 Application
We apply our tool to explore the possibility of increasing the Glutamate (Glu) production in the metabolic network of amino acid synthesis [6]. The network consists of 16 metabolites and 24 reactions. In addition to the stoichiometric matrix (S) and the lower (lb) and upper (ub) bounds on the fluxes through reactions, the capacitance calculation requires the vector (T) of the standard Gibbs free energy of metabolite formation, the mass matrix (M) which contains
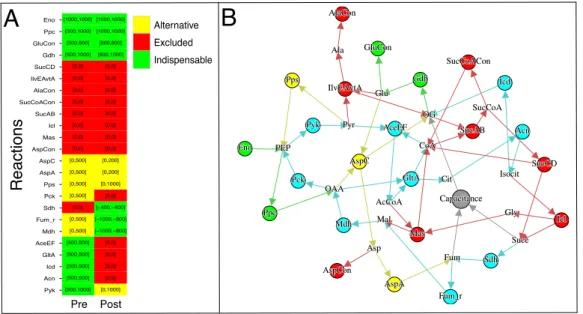
Rxn Pyk Acn Icd GltA AceEF Mdh Fum_r Sdh Pck Pps AspA AspC AspCon Mas Icl SucAB SucCoACon AlaCon IlvEAvtA SucCD Gdh GluCon Ppc Eno [500,500] [500,500] [0,0] [0,500] [0,500] [0,0] [1000,1000] [0,500] [500,1000] [500,500] [500,500] [500,500] [0,0] [0,0] [0,0] [0,500] [0,500] [500,1000] [0,500] [500,1000] [0,0] [0,0] [0,0] [0,0] [0,0] [0,0] [0,0] [0,200] [0,200] [0,0] [1000,1000] [−1000,−800] [800,1000] [0,0] [800,800] [0,0] [0,0] [0,0] [0,0] [−1000,−800] [0,0] [1000,1000] [0,1000] [0,1000] [−400,−400] [0,0] [0,0] [0,0] Pre Pos value Alternative Excluded Indispensable Ala Asp Glu Gly Mal Fum Succ SucCoA OG Isocit Cit OAA AcCoA CoA Pyr PEP Eno Acn SucCD Sdh Fum_r Mdh AspC Gdh IlvEAvtA Pyk AceEF GltA Icd SucAB Icl Mas AspCon AspA Pck Ppc Pps AlaCon SucCoACon GluCon Capacitance Ala Asp Glu Gly Mal Fum Succ SucCoA OG Isocit Cit OAA AcCoA CoA Pyr PEP Eno Acn SucCD Sdh Fum_r Mdh AspC Gdh IlvEAvtA Pyk AceEF GltA Icd SucAB Icl Mas AspCon AspA Pck Ppc Pps AlaCon SucCoACon GluCon Capacitance Rxn Pyk Acn Icd GltA AceEF Mdh Fum_r Sdh Pck Pps AspA AspC AspCon Mas Icl SucAB SucCoACon AlaCon IlvEAvtA SucCD Gdh GluCon Ppc Eno [500,500] [500,500] [0,0] [0,500] [0,500] [0,0] [1000,1000] [0,500] [500,1000] [500,500] [500,500] [500,500] [0,0] [0,0] [0,0] [0,500] [0,500] [500,1000] [0,500] [500,1000] [0,0] [0,0] [0,0] [0,0] [0,0] [0,0] [0,0] [0,200] [0,200] [0,0] [1000,1000] [−1000,−800] [800,1000] [0,0] [800,800] [0,0] [0,0] [0,0] [0,0] [−1000,−800] [0,0] [1000,1000] [0,1000] [0,1000] [−400,−400] [0,0] [0,0] [0,0] Pre Pos value Alternative Excluded Indispensable Rxn Pyk Acn Icd GltA AceEF Mdh Fum_r Sdh Pck Pps AspA AspC AspCon Mas Icl SucAB SucCoACon AlaCon IlvEAvtA SucCD Gdh GluCon Ppc Eno [500,500] [500,500] [0,0] [0,500] [0,500] [0,0] [1000,1000] [0,500] [500,1000] [500,500] [500,500] [500,500] [0,0] [0,0] [0,0] [0,500] [0,500] [500,1000] [0,500] [500,1000] [0,0] [0,0] [0,0] [0,0] [0,0] [0,0] [0,0] [0,200] [0,200] [0,0] [1000,1000] [−1000,−800] [800,1000] [0,0] [800,800] [0,0] [0,0] [0,0] [0,0] [−1000,−800] [0,0] [1000,1000] [0,1000] [0,1000] [−400,−400] [0,0] [0,0] [0,0] Pre Pos value Alternative Excluded Indispensable
A
B
Pre Post R e a ct io n sFigure 1: Visualization of the results obtained from the analysis of the metabolic model of amino acid synthesis in E. coli from [6]. (A) Changes in the types of reactions (blocked, excluded, indispensable and alternative) before (Pre) and after (Pos) the inclusion of the calculated stoichiometric capacitance (SC). The FVA flux ranges before and after adding the SC are indicated as well. (B) The metabolic network including the calculated SC. Metabolites are shown by their names and reactions are depicted as colored nodes: gray for the SC, cyan for reactions whose type changes due to the inclusion of the SC, and yellow (resp. red or green) for reactions which are alternative (resp. excluded or indispensable) before and after adding the SC.
the molecular sum formulas of the metabolites, the reversibility of reactions (rev ) and the index (obj ) stating the objective function to be optimized (ex. biomass production). Vectors indicating the names of reactions (rxn names) and metabolites (met names) and the indices (exc indices) of metabolites that must not occur in the capacitance can be used as well. All data is available in the MeDUSA package.
We first construct an object my model using the loaded data. Then, we use my model to build the corresponding MILP problem in order to perform the capacitance calculation. The resulting MILP problem can be solved using the state-of-the-art MILP solvers (ex. Cplex and Gurobi):
sage: my model = MetabolicModel.create model(S,M,ub,lb,T,
met names,rxn names,obj,rev,exc indices,’Gurobi’)
Next, we compute a stoichiometric capacitance by fixing an upper bound on its flux (ex. 1000) and a maximum number of metabolites to be used (ex. 4).
sage: (sol,cap) = my model.capacitance(1000,4)
Finally, we use FVA to investigate the changes in the importance of metabolic reactions for performing the network objective. To achieve this, we call the function fva while setting fluxes through the reactions indices to values.
sage: (min values,max values) = my model.fva(indices,values)
Based on the above calculations, we obtain the stoichiometric capacitance 3 Fum + 2 Suc −→ 4 OG , whose inclusion in the metabolic model results in an increase of the Glutamate (Glu) production by 60%. Figure 1 shows how this capacitance is connected to the reactions defining the considered metabolic network. More importantly, the figure emphasizes the changes in the types of reactions due to the inclusion of this capacitance. All the obtained results can be exported by MeDUSA in different formats.
The calculated capacitance is a bypass of Oxoglutarate (OG) synthesis, which is the only substrate of Glu. Analyzing capacitance’s consequences emphasizes that reallocations of flux from Pyruvate (Pyr), Co-enzyme A (CoA) and Isocitrate (Isocit) synthesis leads to modify Succinate (Succ) and Fumarate (Fum) synthesis pathways from Oxalacetate (OAA).
Funding MB is supported by Basal-CMM and Fondap 1509007, Center CIRIC INRIA-Chile. Study is supported by ANR IDEALG.
References
[1] Varma, A. and Palsson, B. O. (1994) Nat. Biotechnol. 12(10), 994–998. [2] Larhlimi, A., Basler, G., Grimbs, S., Selbig, J., and Nikoloski, Z. (2012)
Bioinformatics 28(18), I502–I508 11th European Conference on Computa-tional Biology (ECCB) / Conference of the Intelligent Systems in Molecular Biology (ISMB), Basel, Switzerland.
[3] Stein, W. et al. Sage Mathematics Software (Version 5.6) The Sage Devel-opment Team (2013) http://www.sagemath.org.
[4] Ellson, J., Gansner, E., Koutsofios, E., North, S., and Woodhull, G. (2004) Graphviz and dynagraph – static and dynamic graph drawing tools In M. Junger and P. Mutzel, (ed.), Graph Drawing Software, Mathematics and Visualization pp. 127–148 Springer-Verlag Berlin/Heidelberg.
[5] Bastian, M., Heymann, S., and Jacomy, M. (2009) In Third International AAAI Conference on Weblogs and Social Media, San Jose, CA, USA : . [6] Schuster, S., Dandekar, T., and Fell, D. (1999) Trends Biotechnol. 17(2),