HAL Id: hal-01617953
https://hal-univ-rennes1.archives-ouvertes.fr/hal-01617953
Submitted on 1 Dec 2017HAL is a multi-disciplinary open access archive for the deposit and dissemination of sci-entific research documents, whether they are pub-lished or not. The documents may come from teaching and research institutions in France or
L’archive ouverte pluridisciplinaire HAL, est destinée au dépôt et à la diffusion de documents scientifiques de niveau recherche, publiés ou non, émanant des établissements d’enseignement et de recherche français ou étrangers, des laboratoires
A Bispidol Chelator with a Phosphonate Pendant Arm:
Synthesis, Cu(II) Complexation, and (64)Cu Labeling
Raphaël Gillet, Amandine Roux, Jérémy Brandel, Sandrine Huclier-Markai,
Franck Camerel, Olivier Jeannin, Aline M. Nonat, Loïc J. Charbonnière
To cite this version:
Raphaël Gillet, Amandine Roux, Jérémy Brandel, Sandrine Huclier-Markai, Franck Camerel, et al.. A Bispidol Chelator with a Phosphonate Pendant Arm: Synthesis, Cu(II) Complexation, and (64)Cu Labeling. Inorganic Chemistry, American Chemical Society, 2017, 56 (19), pp.11738-11752. �10.1021/acs.inorgchem.7b01731�. �hal-01617953�
Bispidol chelator with phosphonate pendant arm:
synthesis, Cu(II) complexation and
64Cu labeling
Raphaël Gillet,† Amandine Roux,† Jérémy Brandel,‡ Sandrine Huclier-Markai,§ ǂ Franck
Camerel,ð Olivier Jeannin, ð Aline M. Nonat,*†, Loïc J. Charbonnière*†
†Laboratoire d’Ingénierie Moléculaire Appliquée à l’Analyse, Université de Strasbourg, CNRS, IPHC UMR 7178, F-67000 Strasbourg, France.
‡ Laboratoire de Reconnaissance et Procédés de Séparation Moléculaire, Université de Strasbourg, CNRS, IPHC UMR 7178, F-67000 Strasbourg, France.
§ GIP Arronax, 1 rue Aronnax, CS 10112, F-44817 Saint-Herblain, France.
ǂ Subatech Laboratory, UMR 6457, Ecole des Mines de Nantes, IN2P3/CNRS, Université de Nantes, 4 rue Alfred Kastler, F-44307 Nantes, France.
ð Laboratoire Matière Condensée et Systèmes Électroactifs, Institut des Sciences Chimiques de
Rennes, UMR-CNRS 6226, 263 Avenue du Général Leclerc, CS 74205, F-35042 Rennes Cedex, France
[email protected], [email protected]
KEYWORDS : 64Cu / selectivity / kinetic inertness / bispidine / phosphonate/ radiolabelling /
PET
ABSTRACT. Here we present the synthesis and characterization of a new bispidine
(3,7-diazabicyclo[3.3.1]nonane) ligand with N-methanephosphonate substituents (L2). Its
have been evaluated by using UV-visible absorption spectroscopy, potentiometry, 1H and 31P
NMR and cyclic voltammetry. Radiolabelling experiments with 64Cu(II) have been carried out,
showing excellent radiolabelling properties. Quantitative complexation was achieved within 60 minutes under stoichiometric conditions, at room temperature and in the nanomolar concentration range. It was also demonstrated that the complexation occurred below pH = 2. Properties have been compared to those of the analogue bispidol bearing a N-methanecarboxylate substituent (L1). Although both systems meet the required criteria to be used
as new chelator for 64/67Cu in terms of formation kinetic, thermodynamic stability, selectivity for
Cu(II), kinetic inertness regarding redox or acid-assisted decomplexation processes, substitution of the carboxylic acid function by the phosphonic moiety is responsible for a significant increase of the thermodynamic stability of the Cu(II) complex (+ 2 log units for pCu) and also leads to an increase of the radiochemical yields with 64Cu(II) which is quantitative for L
2.
Introduction
Bispidine derivatives are highly preorganized ligands that can accommodate metal ions with cis-octahedral, square pyramidal or pentagonal geometries.1,2 They usually form thermodynamically
very stable metal complexes with transition metal ions which often show high kinetic inertness.3,4,5 Modification of the coordinating pendant arms can be used to tune the ligand
denticity as well as all electronic, thermodynamic and kinetic parameters such as the ligand field, the metal selectivity, the stability constants and the redox potentials. Such properties are very appealing for applications in catalysis,6,7,8,9,10,11,12 in molecular magnetism13,14,15,16,17 and in nuclear
This study focuses on the use of two bispidine derivatives (L1, and L2, Chart 1) as chelators for
radioactive copper for application in immuno-Positron Emission Tomography (PET) (64Cu, t
1/2 = 12.7 h, β+, 17.8%, 653 keV, β-, 38.4%, 579 keV).22 In this context, bifunctional chelators (BFCs)
are needed, providing a strong chelating site for radioactive copper complexation as well as a reactive function for conjugation to a monoclonal antibody (mAb) (or a fragment) of interest. Lots of progresses in antibody technologies as well as site-specific conjugation methods23,24 have
been made in the recent years and it is now within our grasp to find or design engineered mAb fragments for almost any molecular target.25 Radiolabeled antibodies have been introduced in
clinical use26,27,28,29 and a large range of BFCs are now available.30,31,32 However, only a few
chelators fulfill all of the very specific criteria which are required to radiolabel antibody-BFC conjugates in good conditions, i.e. (i) fast radiolabelling (a few minutes to one hour) at room temperature and around physiological pH; (ii) high in vivo stability and kinetic inertness towards transmetallation, transchelation and reduction; and (iii) easy access synthesis and bio-conjugation.33,34
Chart 2. Structure of other ligands discussed in this work.
suffer from low kinetic inertness. Variations of the substituent are being explored in order to improve the in vivo stability of the Cu complexes (see HTE1PA,40,41,42,43 NO1PA2PY44 and its
derivatives,45 Chart 2). Very stable and inert cyclen-based cross-bridged systems (such as
PycupBn46 and CB-TE2A,47 Chart 2) and macrobicycles such as L
748 are being developed but
their slow kinetic of complexation is hampering their use for the labeling of antibodies. Faster complexation is observed with N-phosphonic acid analogues, although heating is still necessary for the moment.49,50,51,52 New linear systems such as H
2DEDPA and H2AZAPA53,54 as well as
other type of macrocyclic ligands and cages (DiamSar55,56,57 and its derivatives) offer good
radiolabelling conditions at room temperature (Chart 2) and for some of them, a high degree of kinetic inertness. Bispidine derivatives (L4 and L5, Chart 2) also form particularly stable Cu(II)
complexes in vitro and in vivo. L4 and L5 could be radiolabeled with >95% radiolabelling yields
within a minute at room temperature.18,4 Non-optimized specific activities of less than 0.1
GBq/µmol were used for L418 and L519 and a specific activity of 26 GBq/µmol was obtained for
L6 after 90 min at 50°C.20 Preliminary in vivo studies in mice and rats for L4 and L6 indicated
rapid blood and tissue clearance as well as the absence of demetallation. However, changes were
observed over time in the radio-HPLC chromatogram of L4, which were attributed to partial or
total hydrolysis of the ester functions by the esterase in rat plasma.18 Dioxotetraaza macrocycles
(L6, Chart 2) are also very stable, although efficient labeling was observed only after heating the
samples at 50°C.20
Our previous studies on the methylene carboxylate-substituted bispidine L1, have shown that this
ligand is another good candidate for PET applications.21 Fast complexation occurs even at low
pH values (pH = 1), with a high binding constant for Cu(II) versus competing metals (Co(II), Ni(II), Zn(II)) and the complex is characterized by a strong stability in acidic medium (t1/2 =
110 days at 25°C, 5M HClO4) and upon reduction (E1/2 = -430 mV vs NHE). Radiolabelling with
64CuCl
2 is fast (<5min) and easily performed at room temperature and at micromolar
concentrations of L1 in water (4 ≤ pH ≤ 6).58 In these conditions, ≥ 90% radiolabeling yields were
obtained. Moreover, the risk of enzymatic degradation is suppressed since the ester functions have been hydrolyzed prior complexation. In this study, we report the synthesis and physicochemical evaluation and the radiolabelling studies of a new methane phosphonate analogue L2 in water. Substitution of the acetic acid pendant arm by a methanephosphonic acid
moiety was expected to improve the ligand selectivity for Cu(II) and to increase the thermodynamic and kinetic stability of the complex. This expectation is corroborated by literature data on phosphonate pendant-armed tetraazamacrocyclic chelators such as PCB-TEA1P51,59 as well as on the podal pyridine derivatives developed in our group, L
8 (Chart 2). 60,61,62
Radiolabelling conditions t1/2 pCua Ered (mV vs NHE)
TETA31,32 25°C, 60 min, pH 5-7 3.5 d (5M HCl, 30°C) 15.1 -980 (irrev)
CB-TE2A51 95°C, 60 min, pH 6-7 154 h (5M HCl, 90°C) - -880 (E1/2)
HTE1PA40,41 r.t., 15 min, pH 5 32 min (HCl 1M, 25°C) 144 min (5M HClO4, 25°C)
18.64
-CB-TE1PA94 - 96 d (5M HClO4, 25°C) 16.6 -620 (E1/2)
PCTA63,35 25°C, 5 min, pH 5.5 - 19.1
-DiamSar55,56,57 25°C, 5-30 min, pH 5.5 40 h (5M HCl, 90°C) - -900 (irrev)
NOTA30,64,32 25°C, 30-60 min, pH
5.5-6.5 < 3 min (5M HCl, 30°C) 18.4 -700 (irrev)
NO1PA2PY44 r.t., 30 min, pH 6-7 204 min (3M, HCl, 90°C) 17.75 -518
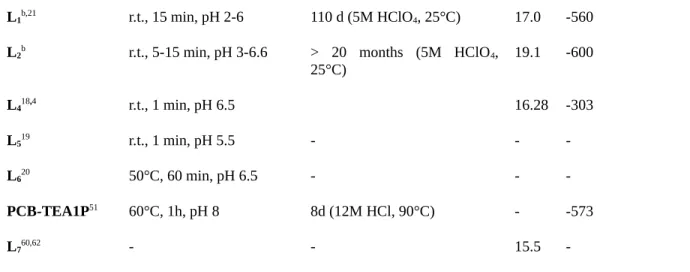
L1b,21 r.t., 15 min, pH 2-6 110 d (5M HClO4, 25°C) 17.0 -560
L2b r.t., 5-15 min, pH 3-6.6 > 20 months (5M HClO4,
25°C) 19.1 -600 L418,4 r.t., 1 min, pH 6.5 16.28 -303 L519 r.t., 1 min, pH 5.5 - - -L620 50°C, 60 min, pH 6.5 - - -PCB-TEA1P51 60°C, 1h, pH 8 8d (12M HCl, 90°C) - -573 L760,62 - - 15.5
-apCu = - log[Cu(II)free], [Cu] = 10-6 M, [L] = 10-5 M, pH = 7.4 bThis work.
Table 1. Radiolabelling conditions (at r.t.), half life (t1/2), pCu and reduction potential (Ered) for a
selection of ligands.
General Methods. Solvents and starting materials were purchased from Aldrich, Acros and Alfa
Aesar and used without further purification. IR spectra were recorded on a Perkin Elmer Spectrum One Spectrophotometer as solid samples and only the most significant absorption bands are given in cm-1. Elemental analyses and mass spectrometry analysis were carried out by
the Service Commun d'Analyses of the University of Strasbourg. 1H and 13C NMR spectra and
2D COSY, NOESY, HSQC, and HMBC experiments were recorded on Bruker Avance 300 and Avance 400 spectrometers operating at 300 and 400 MHz, respectively. Chemical shifts are reported in ppm, relative to residual protonated solvent as internal reference.66 The pH values
given are corrected for the deuterium isotopic effects.67 Elemental analysis and monoisotopic
masses were calculated with the chemcalc software.68
X-ray Crystallography. Crystals of the intermediate 2 (Scheme 1) and L2 ligand suitable for
X-ray diffraction were obtained by slow evaporation of methanol solutions. The crystals were placed in oil, and a single crystal was selected, mounted on a nylon loop and placed in a
low-temperature N2 stream. X-Ray diffraction data collection was carried out on a Bruker APEX II
Kappa-CCD diffractometer equipped with an Oxford Cryosystem liquid N2 device, using Mo-Kα
radiation (λ = 0.71073 Å) at 150(2) K (Centre de diffractométrie X, Université de Rennes 1, France). Bruker SMART program were used to refine the values of the cell parameters. Data reduction and correction for absorption (SADABS) were carried out using the Bruker SAINT
programs. The structures were solved by direct methods using the SIR97 program,69 and then
refined with full-matrix least-square methods based on F2 (SHELX-97)70 with the aid of the
WINGX program.71 All non-hydrogen atoms were refined with anisotropic atomic displacement
parameters.
For 2, all H atoms were included in their calculated positions, whereas, for L2, H atoms carried
by heteroatoms were refined with isotropic atomic displacement parameters. Crystallographic data for structural analysis of 2 and L2 ligand have been deposited with the Cambridge
Crystallographic Data Centre under CCDC No1530206 and 1530205, respectively. Copies of this
information may be obtained free of charge from the web site www.ccdc.cam.ac.uk.
Synthesis of the ligands. Piperidinone
dimethyl-1-methyl-4-oxo-2,6-di(pyridin-2-yl)piperidine-3,5-dicarboxylate (P1) was synthesized according to previously reported procedure.72
(aminomethyl)phosphonic acid 1. 1 was obtained in three steps from diethyl phosphate according
to the Kabachnik-Fields reaction, according to an adaptation of the procedure used in reference.73
(i) To a solution of diethylphosphite (3.27 mL, 94%, 20.7 mmol, 1.2 eq) in THF (9 mL) were successively added dibenzylamine (3.39 mL, 98%, 17.27 mmol, 1 eq) and formaldehyde (3.06 mL, 37% in water, 34.5 mmol, 2eq). The mixture was heated at 60°C under stirring for 24 h and the reaction was monitored by TLC. After completion of the reaction, the mixture was taken to
dryness under vacuum and the as-obtained yellow oil was dissolved in cyclohexane (60 mL) and washed with water (3 × 15 mL). Diethyl((dibenzylamino)methyl)phosphonate was obtained as a colorless oil after evaporation of the cyclohexane under reduced pressure (6 g, quantitative). 1H
NMR (400 MHz, CDCl3): 1.19 (t, J = 7.1 Hz, 6H, CH2CH3), 2.77 (d, J = 10.5 Hz, 2H, NCH2P), 3.67 (s, 4H, NCH2Φ), 3.95 (qd, J1 = 7.1 Hz, J2 = 7.5 Hz, 4H, CH2CH3), 7.11-7.28 (m, 10H, Φ).
31P NMR (162 MHz, CDCl
3): = 25.7.
(ii) Palladium over charcoal (10%, 600 mg) was added to a solution of diethyl((dibenzylamino)methyl)phosphonate (6 g, 17.27 mmol) in EtOH (300 mL) and the mixture was refluxed under a flow of hydrogen for 24h. The crude mixture was filtrated on a sintered-glass filter funnel filled with celite and the solvent was removed under vacuum to yield
diethyl(aminomethyl)phosphonate (4.8 g, quantitative). 1H NMR (400 MHz, CDCl
3): 1.25 (t,
J = 6.7 Hz, 6H, CH2CH3), 1.97 (s, 2H, NH2), 2.94 (d, J = 10.2 Hz, 2H, NCH2P), 4.05 (m, 4H,
CH2CH3). 31P NMR (162 MHz, CDCl3): 27.35 ppm (qd, J1 = 8.5 Hz, J2 = 9.2 Hz).
(iii) diethyl(aminomethyl)phosphonate (4.81 g, 28.8 mmol) was dissolved in 6M hydrochloric acid (300 mL) and the mixture was refluxed for 16 h under stirring. After evaporation to dryness under reduced pressure, (aminomethyl)phosphonic acid 1 was obtained as a white powder (4.25
g, quantitative). 1H NMR (400 MHz, CDCl
3) : 3.00 (d, J = 13.0 Hz, 2H). 31P NMR (162 MHz,
CDCl3): 12.18 ppm.
Bispidone 2. (aminomethyl)phosphonic acid 1 (126 mg, 1.13 mmol, 1.1 eq) was dissolved in a
H2O/MeOH (3/7) mixture (11 ml) and stirred at room temperature in the presence of sodium
hydrogenocarbonate (143 mg, 1.7 mmol, 1.7 eq). Piperidone P1 (396 mg, 1.0 mmol, 1 eq) in 8 ml
of MeOH, was then added as well as formaldehyde (93.0 mg, 3.1 mmol, 3 eq, 0.23 ml, 37 % solution in H2O). The reaction mixture was heated to 60°C for 5 h, the reaction being monitored
by TLC on (eluent: DCM/MeOH 9/1, Rf = 0.26). After completion of the reaction, the solvent was evaporated under reduced pressure and the crude product was suspended into EtOH (10
mL). Bispidone 2 was isolated by centrifugation as a white powder (187 mg, 35 %). 1H NMR
(400 MHz, CD3OD): 1.87 (s, 3H, H3), 2.53 (d, J = 13.0 Hz, 2H, He), 3.15 (AB system, A =
2.66, B = 3.64, JAB= 12.3 Hz, 4H, H6/H8), 3.72 (s, 6H, OCH3), 4.68 (s, 2H, H2/H4), 7.35 (m,
2H, Hd), 7.42 (ddd, J1 = 7.7 Hz, J2 = 4.9 Hz, J3 = 0.9 Hz, 2H, Hb), 7.84 (td, J1 = 7.8 Hz,
J2 = 1.5 Hz, 2H, Hc), 8.83 (dd, 2H, Ha). 31P NMR (162 MHz, CD3OD): 15.29 ppm. 13C NMR
(100 MHz, CD3OD): 41.9 (CH3), 51.7 (2C, OCH3), 57.2 (d, Ce), 60.9 (2C, C6), 63.0 (2C, C1),
72.4 (2C, C2), 123.8 (2C, Cb), 124.7 (2C, Cd), 137.6 (2C, Cc), 150.6 (2C, Ca), 156.3 (2C, Cpy), 167.5 (2C, CO2Me), 202.3 (C9). Electrospray ionization (ESI) / MS+ (CH3OH): m/z = 519.17
([M+H]+, 100%). Anal. Calcd for C
23H26N4O8PNa·0.5H2O, C, 50.28, H, 4.95, N, 10.20. Found:
C, 50.39, H, 4.75, N, 10.27.
Bispidol 3. Compound 2 (1.2 g, 2.3 mmol, 1 eq) was dissolved in 80 mL of anhydrous MeOH by
heating and using ultrasound. The solution was then cooled to -78°C and sodium borohydride (107 mg, 2.8 mmol, 1.5 eq) was gradually added. The reaction was monitored by TLC on C18 (eluent: H2O/ACN 7/3, Rf = 0.28). After 5h30, the reaction was quenched at -78°C by the
addition of a saturated NH4Cl aqueous solution (5 mL). The solvent was evaporated under
vacuum and the crude product was purified by FPLC on a C18 reverse phase column (eluent
system: H2O/ACN 0.1 % TFA), giving the bispidol 3 (0.79 g, 66 %). 1H NMR (400 MHz,
CD3OD): 1.74 (s, 3H, H3), 3.35 (d, J= 11 Hz, 2H, He), 3.62 (s, 6H, OCH3), 4.0 (AB system, A
= 3.76, H6/8ax, B = 4.23, H6/8eq, J = 12.7 Hz, 4H), 4.55 (s, 1H, H9), 4.98 (s, 2H, H2/H4), 7.43
13C NMR (100 MHz, CD
3OD): 40.7 (CH3), 51.2 (2C, C1), 51.8 (2C, OCH3), 53.2 (d, J = 133.9
Hz, Ce), 55.8 (2C, C6), 66.2 (2C, C2), 71.9 (C9), 123.9 (2C, Cb), 127.6 (2C, Cd), 137.4 (2C, Cc), 149.3 (2C, Ca), 155.5 (2C, Cpy ), 168.7 (2C, CO2Me). Electrospray ionization (ESI) / MS+
(CH3OH): m/z = 521.18 ([M+H]+, 100%). Anal. Calcd for C23H29N4O8P·0.5H2O, C, 52.17, H,
5.71, N, 10.58. Found: C, 51.94, H, 5.56, N, 10.41.
Ligand L2. Compound 3 (514 mg, 1 mmol, 1 eq) was dissolved in a THF/H2O (1:1) mixture (30
mL) and a solution of sodium hydroxide (200 mg, 5 mmol, 5 eq) in water (5 mL) was added. The mixture was stirred at room temperature and the reaction was monitored by TLC (eluent system: H2O/ACN 8:2, 0.1 % TFA, Rf = 0.65). After completion of the reaction, the mixture was
evaporated to dryness, redissolved in 1M hydrochloric acid and purified by flash
chromatography with a C18 reverse phase column (eluent system: H2O/ACN 0.1 % TFA), to
give ligand L2·NaCl·4H2O (621 mg, quantitative). 1H NMR (300 MHz, CD3OD): 1.78 (s, 3H,
NCH3), 2.34 (d, J = 12.2 Hz, 2H, He), 2.67 (AB system, A = 2.09, H6/8ax, B = 3.24, H6/8eq,
JAB = 12.4 Hz, 4H), 3.88 (s, 1H, H9), 4.61 (s, 2H, H2/H4), 7.24 (m, 2H, Hb); 7.47 (d, J = 7.6 Hz, 2H, Hd), 7.65 (t, J = 7.3 Hz, Hc), 8.76 (d, J = 3.7 Hz, 2H, Ha). 31P NMR (162 MHz, CD 3OD): 16.28 ppm (t, J = 12.0 Hz). 13C NMR (100 MHz, CD 3OD): 42.9 (CH3), 51.7 (2C, C1), 59.2 (2C, C6), 60.5 (d, J = 145.7 Hz, C9), 68.3 (2C, C2), 74.8 (C9), 122.0 (Cb), 125.7 (Cd), 136.1
(Cc), 149.5 (Ca), 160.62 (2C, Cpy), 178.34 (2C, CO2H). Electrospray ionization (ESI) / MS+
(CH3OH): m/z = 493.15 [M+H]+, 100%). Anal. Calcd for C21H25N4O8P·NaCl·4H2O, C, 40.49, H,
Physico-chemical studies.
Materials. Distilled water was purified by passing through a mixed bed of ion-exchanger
(Bioblock Scientific R3-83002, M3-83006) and activated carbon (Bioblock Scientific ORC-83005). All the stock solutions were prepared by weighing solid products using an AG 245 Mettler Toledo analytical balance (precision 0.01 mg). Metal cation solutions were prepared from their perchlorate salts (Cu(ClO4)2.6H2O, 98%, Fluka; Zn(ClO4)2.6H2O, 98.9%, Alfa Aesar)
and their concentrations were determined by colorimetric titrations with EDTA (10-2 M, Merck,
Titriplex III) according to standard procedures.74 Sodium hydroxyde (NaOH) and hydrochloric
acid (HCl) were used to adjust pH during titrations. The ionic strength of all the solutions was fixed to 0.1 M with potassium chloride (KCl, Fluka, 99.0%). All the experiments described were repeated at least three times.
CAUTION! Perchlorate salts combined with organic ligands are potentially explosive and
should be handled in small quantities and with the adequate precautions.75
Potentiometry. The protonated species of L2 and the stability constants of L2 complexes with
Cu(II) and Zn(II) complexes were characterized and quantified by potentiometric titrations in water. All the solutions used in the potentiometric experiments were prepared from boiled and degassed water. Titrations were performed using an automated titrating system (DMS 716 Titrino, Metrohm) with a combined glass electrode (Metrohm, 6.0234.100, Long Life) filled with NaCl 0.1 M. The electrode was calibrated as a hydrogen concentration probe by titrating known amounts of hydrochloric acid with CO32- free potassium hydroxide solutions. The GLEE
In a typical experiment, an aliquot of 10 mL of L2 (2.10-3 M) or M:L2 (M = Cu(II) or Zn(II), [M]/
[L] ≈ 1) was introduced into a thermostated jacketed cell (25.0(2) °C, Metrohm) and kept under argon during the titrations. The solutions were acidified with a known volume of HCl and the titrations were then carried out by addition of known volumes of potassium hydroxide solution over the pH range 2-12. The potentiometric data of L2 and its metal complexes were refined with
the Hyperquad 2008 program78 which uses non-linear least-squares methods, taking into account
the formation of metal hydroxide species. The titration of each system was repeated at least in duplicate and the sets of data for each system were treated independently, then merged together and treated simultaneously to give the final stability constants. The distribution curves as a function of pH of the protonated species of L2 and of L2 metal complexes were calculated using
the Hyss2009 program.79
Spectrophotometry. The protonation constants of L2 and the stability constants of M:L2
(M = Cu(II) and Zn(II) [M]/[L] ~ 1, [L] ~ 5.10-5 M) were also determined by UV-Visible
spectrophotometric titration versus pH. Since complexation started in very acidic medium, the titrations were carried out in two different ways. Between pH = -0.6 and pH = 2, batch solutions
were prepared. Each sample was prepared separately by mixing a known amount of L2 stock
solution, a known amount of standardized HClO4 to adjust the pH (pH = - log[H+]) and a known
amount of Cu(II) stock solution in the case of the study of the complexes ([Cu(II)]/[L) = 1). An absorption spectrum of each sample was recorded in a 1 cm quartz suprasil spectrophotometric cell using a Varian (Cary 3) UV-Visible spectrophotometer. Between pH 2 and 12.5, direct titrations were carried out. Typically, an aliquot of 10 mL of L solution was introduced into a thermostated jacketed titration vessel (25.0(2) °C) with 1 equivalent of metal (M) in the case of M:L titrations. A known volume of hydrochloric acid solution was added to adjust the pH around
2 and the titrations were carried out by addition of known volumes of potassium hydroxide solution. After each addition, the pH was allowed to equilibrate, an aliquot was transferred to a 1 cm quartz suprasil spectrophotometric cell, a spectrum was recorded using a Varian (Cary 3) spectrophotometer, the aliquot was transferred back to the titration vessel and a new addition was made. The free hydrogen ion concentrations were measured with a Mettler Toledo U402-S7/120 (pH 0-14) combined glass electrode. Potential differences were given by a Tacussel LPH430T millivoltmeter. Standardization of the millivoltmeter and verification of the linearity of the electrode were performed with three commercial buffer solutions (pH 4.01, 7.01 and 10.01, 25°C). The software Hypspec V1.1.33 was used to determine the coordination model and calculate the stability constants (log β) of the formed species. 71,80
Acid decomplexation studies. Acid-decomplexation studies were performed under pseudo
first-order conditions on two solutions of CuL2 complex in 5 M HClO4 at 25°C. Changes in the
absorption spectra with time over a period of 20 months were monitored using a Perkin-Elmer
Lambda 950 spectrophotometer. 1.98 × 10⁻⁴ mmol of Cu(II)L
2 complex were used to monitor the
-* transition at 262 nm and 8.78 × 10⁻³ mmol to follow the d-d transition at 680 nm.
Cyclic voltammetry. Cyclic voltammetry (CV) was carried out on the CuL2 complex at room
temperature with a PC interfaced Radiometer Analytical MDE150/PST50. The CV experiments were performed using a glassy carbon working electrode (0.071 cm2, BASi). The electrode
surface was polished routinely with 0.05 μm alumina−water slurry on a felt surface immediately before use. The counter electrode was a Pt coil, and the reference electrode was a Ag/AgCl
electrode. The CuL2 complex was measured in Ar-degassed water with ionic strength fixed at
Seven different values of pH (pH = 2.36, 4.04, 5.70, 7.2, 8.55, 10.23, 11.62) and different scan rates (50-300 mV/s) were considered
Radiolabelling.
64CuCl
2 in 0.1M hydrochloric acid was obtained from the ARRONAX cyclotron (Saint-Herblain,
France). Production and purification procedures have already been described.81 Radiochemical
purity was determined by gamma spectroscopy and chemical purity was measured by ICP-AES. Water (18.2 MΩ.cm) for aqueous solutions was obtained from a Milli-Q gradient system (Millipore). Radiolabelling of ligand L2 with 64Cu was performed, following the same procedure
than the one previously described for ligand L1.58 Post-processed 64Cu eluate diluted in 0.25 M
ammonium acetate buffer (pH 5.3) were mixed at room temperature with a ligand stock solution ([L2]stock = 4.1 × 10⁻⁴ M). Four radionuclide batches were used for radiolabeling purposes. Each
batch was characterized with regards to its specific activity (SA(64Cu) per nmol of Cu) and the content of cold metallic impurities. Briefly, the characteristics of each batch (#1 to #4) is given : batch #1 (13.13 MBq/mL, [Cu2+] = 4.02 × 10⁻⁷ M, [M] = 2.48 × 10⁻⁵ M, SA(64Cu) = 34.8
MBq/nmol), batch #2 (55.71 MBq/mL, [Cu2+] = 2.19 × 10⁻⁶ M, [M] = 8.93 × 10⁻⁶ M, SA(64Cu) =
25.3 MBq/nmol), batch #3 (38.94 MBq/mL, [Cu2+] = 1.53 × 10⁻⁶ M, [M] = 8.94 × 10⁻⁶ M,
SA(64Cu) = 25.3 MBq/nmol), batch #4 (9.74 MBq/mL, [Cu2+] = 3.8 × 10⁻⁷ M, [M] = 8.94 × 10⁻⁶
M, SA(64Cu) = 25.3 MBq/nmol). Several parameters were scrutinized in repeated experiments
such as the pH of the reaction mixtures, the time and the ligand/metal molar ratio (where [metal] corresponds to the total concentration in metal salts, including non-radioactive contaminants from the source such as Co(II), Cu(II), Fe(II/III), Ni(II) and Zn(II)). In a typical experiments, 500
µL batch solutions were prepared separately by mixing a known amount of 64Cu stock solution
buffer, the pH being previously adjusted to the desired value (2 ≤ pH ≤ 7). The influence of temperature and incubation time on the reaction yield was also investigated on L2 for a L/M ratio
of 0.25 by heating the samples for 1h at 80°C; the pH was measured before and after the heating. Radiolabelling was followed by spotting the reaction mixture onto a TLC Flex Plate (silica gel
60A, lF-254, 200 μm, Merck) followed by elution with conc. aq. NH3/MeOH/H2O 1/2/1 (v/v/v).
Quantitative distribution of radioactivity on TLC plates was measured using an electronic autoradiography system (Cyclone, Perkin Elmer). Under these conditions the 64Cu complexes (Rf
= 0.9) and the free 64Cu (Rf < 0.1) are well separated. All yields are given with the experimental
uncertainties of the cyclone device of ±5%.
Results and Discussion. Synthesis of ligand L2.
Scheme 1. Synthesis of Ligand L2.
Ligand L2 was obtained in three steps from (aminomethyl)phosphonic acid 1 and the
piperidinone precursor P1 following a similar synthetic strategy to that previously reported for
the glycinate derivative L1 (Scheme 1).21 1 was quantitatively obtained by a Kabachnik-Fields
reaction between diethyl phosphite, methanal and dibenzylamine. Hydrogenolysis of the benzyl protecting groups followed by acid hydrolysis of the diethyl ester moieties were performed by using standard conditions. Bispidone 2 was obtained in 35% by a double Mannich reaction between P1, 1 and methanal in the presence of NaHCO3. By this method, pure bispidone 2 could
be obtained by precipitation from ethanol. It can be noticed that previous attempts using diethyl(aminomethyl)phosphonate instead of the phosphonic acid lead to a mixture of products
which was difficult to purify by crystallizations or column chromatography. Selective reduction of the central ketone of 2 was achieved in good yield by addition of NaBH4 in cold methanol
(-78°C). A single epimer, with H9 pointing toward N7 was isolated after purification by reverse
phase flash chromatography (FPLC) on a C18 column as evidenced by 1H-1H NOESY
experiments. Interestingly, the same regioselectivity was previously observed with the acetate-substituted bispidol21 suggesting a facial regioselectivity, which is probably due to the
stabilization of the borohydride intermediate due to formation of hydrogen bonds with the
carbonyl and the acid protons of the phosphonic or carboxylic acid on N7 (see numbering on
Scheme 1). Saponification of the methyl ester substituents was achieved at room temperature in presence of sodium hydroxide and the pure ligand could be isolated by reverse phase FPLC (see Supporting Information, Figures S1-S13 for the NMR spectra of 2, 3 and L2).
Structural characterization of 2 and L2. Single crystals of 2 (as the sodium salt 2Na) and L2
were obtained by slow evaporation of methanol solutions at room temperature. The crystal structure refinement confirms the chemical structure of 2 and ligand L2. The corresponding
ORTEP view of the asymmetric unit is shown in Figure and 2, respectively and corresponding crystallographic data are presented in Tables 1 and 2.
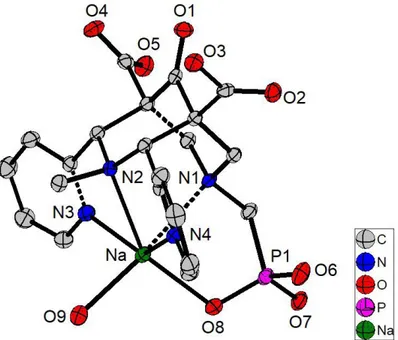
Figure 1. ORTEP drawing of 2Na with the main atomic numbering. Thermal ellipsoids drawn at 50% probability level. All H atoms are omitted for the sake of clarity.
Figure 2. ORTEP drawing of ligand L2 with the main atomic numbering. Thermal ellipsoids drawn at 50% probability level. All H atoms are omitted for the sake of clarity.
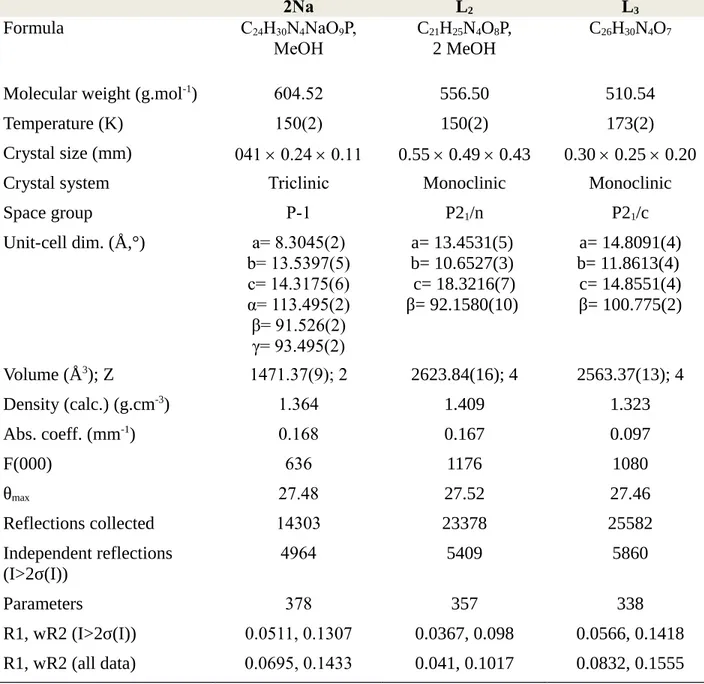
Table 2. Crystallographic data for the structures of 2Na, L2 and L3.72 2Na L2 L3 Formula C24H30N4NaO9P, MeOH C21H25N4O8P, 2 MeOH C26H30N4O7
Molecular weight (g.mol-1) 604.52 556.50 510.54
Temperature (K) 150(2) 150(2) 173(2)
Crystal size (mm) 041 0.24 0.11 0.55 0.49 0.43 0.30 0.25 0.20
Crystal system Triclinic Monoclinic Monoclinic
Space group P-1 P21/n P21/c Unit-cell dim. (Å,°) a= 8.3045(2) b= 13.5397(5) c= 14.3175(6) α= 113.495(2) β= 91.526(2) γ= 93.495(2) a= 13.4531(5) b= 10.6527(3) c= 18.3216(7) β= 92.1580(10) a= 14.8091(4) b= 11.8613(4) c= 14.8551(4) β= 100.775(2) Volume (Å3); Z 1471.37(9); 2 2623.84(16); 4 2563.37(13); 4 Density (calc.) (g.cm-3) 1.364 1.409 1.323 Abs. coeff. (mm-1) 0.168 0.167 0.097 F(000) 636 1176 1080 θmax 27.48 27.52 27.46 Reflections collected 14303 23378 25582 Independent reflections (I>2σ(I)) 4964 5409 5860 Parameters 378 357 338 R1, wR2 (I>2σ(I)) 0.0511, 0.1307 0.0367, 0.098 0.0566, 0.1418 R1, wR2 (all data) 0.0695, 0.1433 0.041, 0.1017 0.0832, 0.1555
Table 3. Selected Bond Lengths and Angles in 2, L2 and L3.72
2 L2 L3
Bond lengths and distances (Å)
Na-N1 2.6205(18)
Na-O8 2.3330(15) Na-O9 2.3695(18) N1···N2 2.9429(24) 2.6935(13) 2.888(2) N3···N4 4.6521(31) 4.6913(16) 7.186(2) Angles (deg) Pyr1···Pyr2 144.05 116.8 159.8
The intermediate 2 was isolated as a sodium salt and the structure (Figure 1) confirms the chair-chair conformation of the bispidone, as observed by 1H NMR studies (Figure S1). This
intermediate was crystallized in the triclinic P-1 space group with one sodium complex and one methanol molecule in general positions. The Na(I) ion is hexacoordinated by ligand 2 and one methanol molecule with a distorted octahedral coordination geometry (Table 2), which is, as expected from the strong rigidity of the ligand backbone, very similar to other hexacoordinated structures with Li(I)82 or transition metal ions such as Cr(III), Mg(II), Fe(II), Co(II), Cu(I/II) or
Zn(II).5 In the case of L
2, the asymmetric unitcontains one complete L2 ligand and 2 methanol
molecules in general positions (Figure 2). The ligand crystallizes in a partially protonated form in the monoclinic space group P21/n (Table 2) and is characterized by the presence of four acidic
protons: one on the carboxylic acid (C9-O4H = 1.3150(16) and C9=O3 = 1.2035(16) Å), two on the phosphonic acid (P1=O5 = 1.4779(0), P1=O6H = 1.5598(10) and P1=O7H = 1.5616(10) Å) and a last one localized on the tertiary amine R3NH+ (N2-H2 = 0.894(17) Å). The carbon-oxygen
distances on the remaining carboxylate are almost identical (C8-O1 = 1.2534(15) and C8-O2
1.2642(15) and the oxygen atoms O1 and O2 are involved in hydrogen bonds with a bidentate
phosphonate of a neighboring molecule. Furthermore, the ammonium proton H2 is stabilized
inside the cavity by strong hydrogen bonds with the nitrogen atoms N1 (dH-N1= 2.1142(105) Å),
N3 (dH-N3 = 2.3543(78) Å) and N4 (dH-N4 = 2.5267(86) Å). Deeper analysis of the Fourier
atom N1, meaning that in solid state, the proton is exclusively well-localized on the nitrogen atom N2. This protonation scheme is typical of a “proton sponge” behavior, which was
confirmed by physicochemical titrations (see below). As a consequence, ligand L2 is highly
preorganized for metal complexation with (i) a chair-chair conformation of the bispidine skeleton, (ii) a cis-symmetrical configuration of the pyridine rings and (iii) the lone pairs of N1
and N2 pointing towards the inside of the cavity. In addition, the N1···N2 = 2.6935(13) and
N3···N4 = 4.6913(16) Å distances are significantly shorter than for analogous bispidone in their
deprotonated form (N1···N2 = 2.888(2) and N3···N4 = 7.186(2) Å for L3)72 and very close to the
distances measured for 2Na and for another recent example of protonated structure with Hbispa ligands (N1···N2 = 2.684(2) and N3···N4 = 4.922(3) Å for Hbispa1a).83 This contraction of the
cavity is also likely attributed to the presence of the protonated ammonium center which more strongly attracts the electron-rich surrounding nitrogen atoms. Moreover, the structure is stabilized by a network of strong hydrogen bonds between the phosphonic acids and the acetate moiety of a neighboring molecule (O1-O6 = 2.5404(13) Å, O1-H6A-O6 = 169.8(2)°, O2-O7 =
2.5632(13) Å, O2-H7A-O7 = 177.8(2)° Å), which stabilizes this particular protonation state.
Finally, each ligand form moderate H-bonds (O2-O8 = 2.8016(18) Å, O2-H8-O8 = 157.2(1)°, O9
-O002 = 2.6677(16) Å, O002-H002-O9 = 166.5(2)°) with two methanol molecules, the first one
bridging the acetate group and the hydroxyl at C9 and the second one being linked to the
phosphonic acid. The rigid chair-chair conformation of the bicycle was also observed in solution
by 1H NMR (Figure S9) with typical Overhauser effect between the pyridyl protons H
d and the
equatorial protons H6 (see Figure S13 for 1H-1H NOESY). Attempts of growing single crystals of
the CuL2 complex have also been carried out unfortunately leading to crystals of insufficient
Thermodynamic Studies.
Protonation constants of ligand L2.
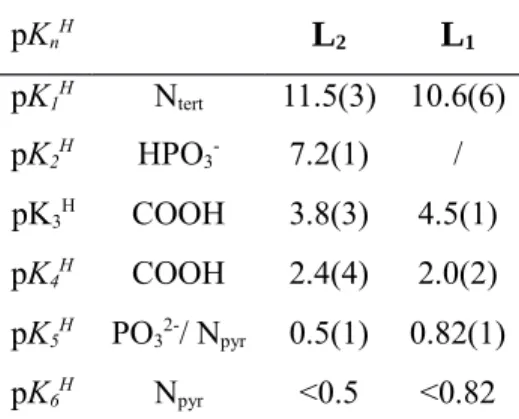
Ligand L2 (Chart 1) has five protonable sites in the usual 2 ≤ pH ≤12 window in water: two
tertiary amines, two carboxylic acids and one phosphonic acid. The crystal structure of L2
suggests that only one of two tertiary amines is protonated. However, three potential additional protonations constants have to be taken into account at lower pH values, which account for the second protonation of the phosphonic acid and for the protonations of the two pyridine rings.21
Protonation constants, as defined by equations 1 and 2, were determined by a combination of potentiometric titrations (Figure S14) and UV–Visible absorption titrations versus pH between pH -0.6 and 12 (Figure 3).
LH n-1+ H ↔ LH n (1)
KnH
= [LH n]
[
LH n-1]
[H ]n=1 – 6 (2)Because of the known strong stability of the metal complexes of bispidine derivatives,4,20 ligand
L2 and its metal complexes were also studied in strongly acidic conditions (-0.59 < pH < 1.73) by
means of spectrophotometric titrations vs pH. As such low pH cannot be measured with an electrode, the batch titration technique was used and the pH of the solutions was fixed by adding known volumes of standardized HClO4 (see Experimental Section for details). It has to be noted
that the ionic strength was not fixed below pH 1 in the batch titrations and that no decomposition of the ligand was observed, even in strongly acidic conditions. The spectral variations of L2
were combined in Figure 3. L2 showed one band, centered at 263 nm, attributed to the π–π*
transition of the pyridine rings, which underwent a hypochromic variation with the appearance of shoulders upon increase of the pH.60 The hypochromic variation is typical of the deprotonation of
pyridinium nitrogens while the shoulders appearing in basic conditions suggest the existence of hydrogen bonding with at least one pyridine nitrogen lone pair.84
230 240 250 260 270 280 290 300 310 0 0,2 0,4 0,6 0,8 1
l (nm)
Ab
so
rb
an
ce
(a
.u
.)
Figure 3. Spectrophotometric titrations of L2 vs pH between −0.6 < p[H] < 1.73 (Batch titration)
and 2.10 ≤ pH ≤ 11.93 (Direct titration). [L2]tot = 4.80 × 10⁻⁵ M, Solvent: H2O; I = 0.1 M KCl; T
= 25.0(2) °C.
The statistical analysis of the potentiometric and spectrophotometric data versus pH was achieved with Hyperquad200885 and Hypspec softwares,78 respectively, and led to the
the bispidine skeleton.82,86,87,88 From crystallographic data, It was postulated that simultaneous
protonation of the two tertiary amines does not occur. The second protonation constant (log K2H =
7.2(1)) was attributed to the first protonation of the phosphonic acid. The third and fourth protonation constants (K3H, K4H) were attributed to the two carboxylic acid oxygens. The two
most acidic protonation constants belong to the pyridine nitrogens and/or to the second protonation of the phosphonic acid. Only one of them could be determined from our spectrophotometric batch titrations (log K5H = 0.5(1)). These protonation constants are in good
agreement with those determined previously for ligand L1 and for the analogue of L
2 bearing a
thiophene group in place of the phosphonic acid.21
Table 4. Successive Protonation Constants of L2 and L1
pKnH L 2 L1 pK1H N tert 11.5(3) 10.6(6) pK2H HPO 3- 7.2(1) / pK3H COOH 3.8(3) 4.5(1) pK4H COOH 2.4(4) 2.0(2) pK5H PO 32-/ Npyr 0.5(1) 0.82(1) pK6H N pyr <0.5 <0.82
H2O, I = 0.1 M (KCl), T = 25.0 °C. The numbers in parentheses correspond to the standard
deviations expressed as the last significant digit.
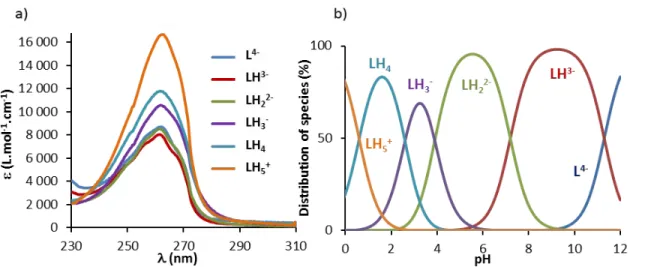
From these values, the electronic spectra of the protonated species of L2 (Figure 4a) and their
distribution diagram (Figure 4b) were calculated.89 The distribution curves showed that, due to
the presence of the phosphonate moiety (pK2H = 7.2(1)), the ligand exists in its L2H3- and L2H2
Figure 4. (a) Electronic spectra and (b) distribution diagram of the protonated species of L2
([L2]tot = 5.0 × 10⁻⁵ M, H2O, I = 0.1 M KCl, T = 25.0(2) °C).
Stability constants of the Cu(II) and Zn(II) complexes.
Spectrophotometric titrations versus pH of solutions of L2 and Cu(II) were carried out between
pH = -0.59 and 2 (batch titration) to ensure complete decomplexation of Cu(II) and between pH = 2 and 12 (direct titration) both on the ligand bands and on the Cu(II) d–d bands (Figure 5). The
position of the Cu(II) d–d bands at pH = 2 (λmax = 682 nm) shows that the Cu(II) complex is
already formed at this pH and suggests a square pyramidal geometry.90 Significant changes were
seen in the UV-visible absorption spectra of CuL2 as a function of pH, where the hypo- and
hypsochromic shift of the main band at 260 nm together with the appearance of a small charge transfer band (Figure 5a)61 indicated the complete formation of the complex at pH = 0.2. Further
spectral variations were observed between pH 2 and 12 suggesting the successive formation of different species.
230 240 250 260 270 280 290 300 310 0 0,2 0,4 0,6 0,8 pH = 2,77 pH = 3,48 4,21 4,83 l (nm) Ab so rb an ce 450 500 550 600 650 700 750 800 850 900 0 0,05 0,1 0,15 0,2 0,25 pH = 2.2 pH = 2.5 pH = 2.76 l (nm)
Figure 5. Spectrophotometric titration of Cu L2 vs pH: (a) [L2]tot = 4.79 × 10⁻⁵ M, [Cu(II)]tot/
[ L2]tot = 0.97, −0.60 < pH < 11.99, H2O, I = 0.1 M (KCl),T = 25.0(2) °C.(b) [L2]tot = 2.50 × 10⁻³
M, [Cu(II)]tot/[ L2]tot = 0.97, −0.61 < pH < 12.07, H2O, I = 0.1 M (KCl), T = 25.0(2).
Data analysis85,78 suggested that the best model involves the successive formation of CuL
2H2,
CuL2H and CuL2 over the entire studied pH range (Table 5) with high stability constants. This
model was confirmed by potentiometric titrations between pH 2-12 in which the CuL2H2 stability
constant, determined from the batch titration, was fixed.
We then focused our attention on the study of the complexation of Zn(II) since it is a common
metallic impurity in no-carrier-added radiocopper solutions.81 Potentiometric and
spectrophotometric titrations versus pH of L2 with stoichiometric amounts of Zn(II) showed the
same model of complexation than for Cu(II), i.e. the successive formation of ZnL2H2, Zn L2H
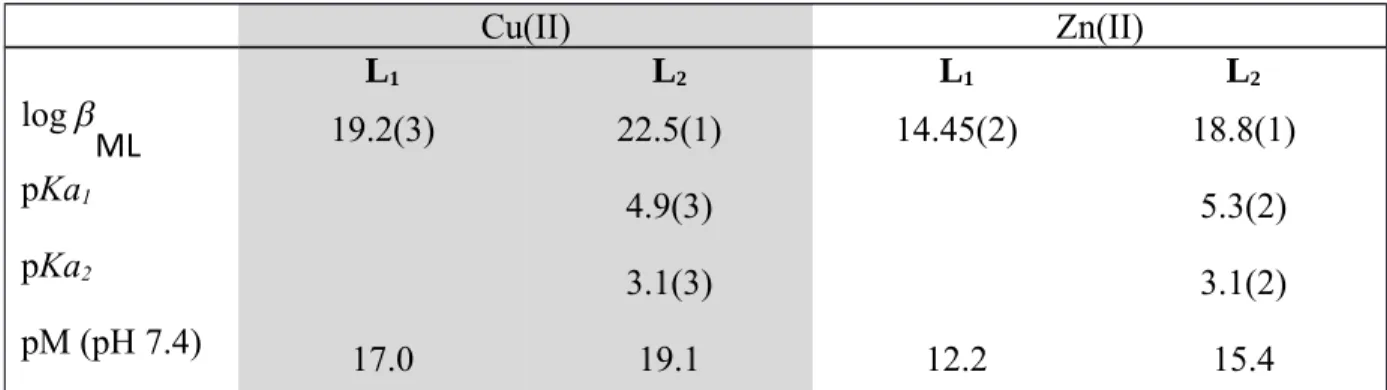
Table 5. Overall Stability Constants (log β) of the ML2 and ML1 Complexes Cu(II) Zn(II) L1 L2 L1 L2 log ML 19.2(3) 22.5(1) 14.45(2) 18.8(1) pKa1 4.9(3) 5.3(2) pKa2 3.1(3) 3.1(2) pM (pH 7.4) 17.0 19.1 12.2 15.4 a M = Cu(II), Zn(II), H 2O; I = 0.1M; T = 25.0°C, βMLH = [MLH]/([M][L][H]); charges were
omitted for clarity; log KCu(OH) = −6.29; log KCu(OH)2 = −13.1; log KZn(OH) = −7.89 ; log KZn(OH)2 =
−14.92 (from ref 91). pM = −log[M(II)free] with [M] = 10−6 M, [L] = 10−5 M, pH 7.4.
In order to compare the chelating ability of L2 for Cu(II) and Zn(II) with other ligands, their pM
(M = Cu(II), Zn(II)) values at physiological pH (pH 7.4) were calculated (Tables 1 and 5). By representing the amount of free metal in solution at physiological pH, the pM allows to compare the chelation power of ligands having different denticities and protonation properties for various metals. These results indicated a very strong stability of the Cu(II) complex bearing a phosphonate arm, with a pCu value two orders of magnitude larger than the previously studied ligand L1 with a carboxylate arm and among the highest observed for 64Cu PET ligands (Table 1).
Moreover, ligand L2 showed a good selectivity for Cu(II) compared to Zn(II), with more than 3
orders of magnitude increase in pM values between the Cu(II) and Zn(II) complexes.
The electronic spectra of the Cu(II) and Zn(II) complexes of L2 (Figure 6a) and their species
distribution profiles (Figure 6b) were calculated from their thermodynamic stability constants. The distribution curves show that for both Cu(II) and Zn(II), the ML complex is the major species at physiological pH (pH = 7.4).
230240250260270280290300310 0 2000 4000 6000 8000 10000 12000 LCu LCuH LCuH 2 λ (nm) ε (M -1 .c m -1 ) -0,5 1,5 3,5 5,5 7,5 9,5 11,5 0 20 40 60 80 100 pH % o f s pe ci es
Figure 6. (a) Electronic spectra and (b) distribution diagram of the different Cu(II)-L2 species
([L2]tot = 5.05 × 10⁻⁵ M, [Cu]tot/[L2]tot = 0.98, H2O, I = 0.1 M KCl, T = 25.0(2)°C).
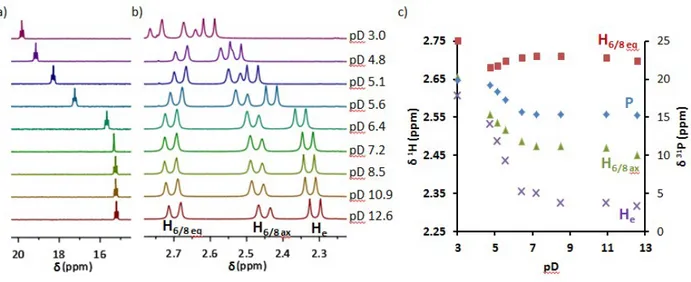
pKas of the Zn(II) complexes have been confirmed by variable pH 1H and 31P NMR spectroscopy
of a stoichiometric mixture of L2 and ZnCl2 in D2O (Figure 7). At pD = 12.6, the 1H NMR
spectra is consistent with the formation of a rigid 1:1 complex (Figure S15) and all protons could
be assigned by 1H-1H COSY and NOESY experiments (Figure S16). Significant variations are
observed in the chemical shift of the protons H6/8 (Δδ = 0.2 ppm), He (Δδ = 0.29 ppm), as well as
of the phosphorus atom (Δδ = 4.63 ppm) (Figure 8, see numbering on Scheme 1). The strong variations on 31P and on H
e suggest that the first protonation occurs on the phosphonate function
and values of pKa1(31P) = 5.4 and pKa1(H6) = 5.3 could be determined from the analysis of the
chemical shift of the 31P atom and proton H
6, respectively (Figure 7c). These results are in very
good agreement with the pKa1 obtained from potentiometric and spectrophotometric titrations.
Protonation of the phosphonate also influences the chemical shift of the H6/8 protons in the
4.8 ≤ pH ≤ 7.2 range. Moreover, the protonation curve of H6/8eq clearly indicates that a second
protonation reaction takes place below pH 4, which could be assigned to the protonation of a carboxylate function.
Figure 7. Variable pH NMR of a L2:ZnCl2 1:1 solution in D2O at 25°C: (a) 31P NMR spectra; (b)
Zoom of the 1H NMR spectra in the 2.25-2.75 ppm region; (c) Protonation curves = f(pD) for P,
He, and H6/8.
Electrochemical studies of the Cu(II) complexes with ligand L2.
In order to verify that the reduction potential of CuL2 is below the threshold for in vivo
reduction, estimated to -0.4V (vs NHE),92,93 we performed cyclic voltammetry studies at different
Figure 8. Cyclic voltammograms of CuL2 at different pH (V = 200 mV/s). [CuL2] = 1.09 x 10⁻³
M, H2O, I = 0.1 M (NaClO4), T = 25.0(2)°C.
At physiological pH where the CuL2 species predominates, quasi-reversible processes were
observed both in reduction and oxidation. A single redox couple was identified, corresponding to Cu(II)/Cu(I) (Ered = −0.81 V vs Ag/AgCl i.e. Ered = −0.60 V vs NHE), clearly indicating the
absence of demetallation and suggesting that L2 is able to stabilize both Cu(II) and Cu(I) in this
pH range. Similar behaviors were also observed for ligand L1 and other bispidone derivatives 21,4
and for NO1PA2PY (Ered = −0.518 V vs NHE)44 and CB-TE1PA (E1/2 = -0.62 vs NHE).94
Quasi-reversibility was also verified by measuring the peak anodic (ipa) and cathodic (ipc) currents with
varying scan speed (v) at fixed pH. The linear plots of ipa or ipc = f(v1/2) are shown in Figure S17.
Ered is similar to the value obtained for ligand L1 (Ered = −0.56V), and is well below the estimated
−0.40 V (vs NHE) threshold for typical bioreductants30 and below Cu(II) complexes with
bispidones L0 (Ered = −0.323 V vs NHE) and HZ2 (Ered = −0.225 V vs NHE).4 More stable
pH = 4.0 pH = 5.7 pH = 7.2 pH = 8.6 Cu(I) Cu(II) Cu(I) Cu(II)
bispidine ligands have been reported more recently, however, redox potentials were measured in organic solvents such as DMF (Ered = − 1.17 V vs fc/fc+ i.e. Ered = -0.72 V vs NHE for
[Cu(bispa1b)]+) and acetonitrile (E
red = -0.66 V vs fc/fc+ i.e. Ered = -0.26 V vs NHE for
[Cu(N2py4)]2+) and therefore cannot be compared with our system.83 With such a low redox
potential, the CuL2 complex should not be subject to reduction, demetallation, or dismutation
under physiological conditions. Below pH 5 and above pH 8.5 more complex phenomena were observed (Figure S18 in accordance with the distribution curves showing the presence of other chemical species.
Kinetic inertness of CuL2H2 in strongly Acidic Media.
Good candidates for radiopharmaceutical applications exhibit strong stability at physiological pH and in reductive medium, good selectivity, but more importantly, high kinetic inertness toward dissociation.95 The kinetic inertness of a complex is commonly evaluated by following its
acid-assisted dissociation in strongly acidic conditions under pseudo-first-order conditions. Providing all other criteria were satisfied, the obtained half-life was shown to be a good gauge of the in vivo stability of 64Cu-labeled chelates.96 The decomplexation of the CuL
2H2 complex in 5 M
HClO4 aqueous solutions at 25 °C was followed by UV–visible absorption spectrophotometry
both on the ligand π-π* transitions and the Cu(II) d-d bands over a period of 20 months. Very minor decomplexation is observed within the period, as assessed by the slight decrease of the absorption spectrum of the d-d transitions (only 6.4% at 670 nm, Figure S19), and which indicates a higher degree of inertness of the complex than the preciously studied CuL1 (t1/2 = 110
d) in the same conditions.
The high stability of the Cu(II) complex prompted us to study the radiolabelling efficiency of ligand L2 with 64CuCl2 in ammonium acetate buffer 0.1 M at room temperature. 64Cu sources of
different specific activities and cold metal impurities were used. For each experiment, the total concentration in metals ([M]) of the batch used is taken into account. Two series of measurements were performed in order to optimize the radiolabelling conditions. On the one hand, the influence of the ligand/metal ratio was investigated at a fixed pH of 5.4 and on the other hand, the influence of the pH (i.e. pH = 2 to 7) was studied for a fixed L/M ratio.
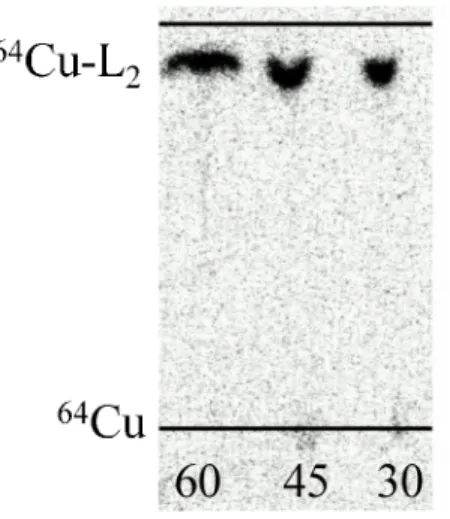
Figure 9. Thin layer radiochromatogram of 64Cu-L2 after 30 min, 45 min and 60 min reaction
0
5
10
15
20
25
0
20
40
60
80
100
[L]/[M]
R
ad
io
la
b
el
in
g
yi
el
d
(
%
)
Figure 10. Radiolabelling yields of L2 (▲) at different ligand/metal ratios (NH4OAc 0.1 M pH
5.4, r.t, 30 min, 64Cu from batch 1, 0.12 nmol ≤ n(ligand) ≤ 12.0 nmol, n(Cu) = 8.04 pmol.
t (min) L/M 5 10 15 30 45 60 0.25 0 0 0 0 0 0 0.5 0 0 0 0 0 0 0.75 0 0 0 12 11 11 1.25 ≥ 95* ≥ 95* ≥ 95* 95 96 94 2.5 92 93 93 94 92 100 12.5 ≥ 95* ≥ 95* ≥ 95* 100 100 100 25 100 100 100 100 100 100
Table 6. Time-dependence of the 64Cu radiolabelling yields for L2 at different metal/ligand ratios
(NH4OAc 0.1 M pH 5.4, r.t., 64Cu from batch 1, 0.12 nmol ≤ n(ligand) ≤ 12.0 nmol, n(Cu) = 8.04
pmol). *No freeCu(II) was seen on radio-TLCs.
Quantitative radiolabelling was achieved for ligand L2 after 30 min at room temperature with
radiolabelling reaction, due to the presence of competitive metal salts (in particular Fe(II/III) was present at a concentration of 6.38 ppm in batch 1, which is relatively high for such production and purification processes). However, after incubation of the samples at 80°C for 1h, the 64Cu-L
2
complex was formed in 4%, 5% and 22% yields for L2/M ratios of 0.25, 0.5 and 0.75,
respectively, at 80°C, which indicate a thermodynamic selectivity of L2 for Cu(II) over the other
cations. Moreover, very efficient radiolabelling (up to 95%) was achieved within 30 min at room temperature and with L2/M ratios of only 1.25. In presence of a larger excess of ligand (25
equivalents), quantitative radiolabelling was achieved within 5 minutes only. In similar conditions, the radiochemical yield of ligand L1 leveled at about 90%. In the case of L4 and L5
(Chart 2), radiochemical yields of 95% were obtained at room temperature in large excess of
ligand (10-4M). These results indicate a better radiolabelling capacity of the phosphonate
derivative L2 over the carboxylate and the pyridyl analogues, which is partly explained by the
2
2,5
3
3,5
4
4,5
5
5,5
6
6,5
7
0
20
40
60
80
100
pH
R
ad
io
la
b
el
in
g
yi
el
d
(
%
)
Figure 11. Radiolabelling yields of L2 (▲) at different pH values (r.t, NH4OAc 0.1 M, 15 min, 64Cu from batch 1 (pH 2.1 - 4.6), n(ligand) = 0.6 nm, n(Cu) = 8.04 pmol, and from batch 2 (pH
4.6-6.6), n(ligand) = 0.11 nmol, n(Cu) = 22.4 pmol, L/M = 1.25. *No freeCu(II) was seen on radio-TLCs. *No freeCu(II) was seen on radio-TLCs.
t (min) pH 5 10 15 30 45 60 L2 2.1 36 40 49 61 70 74 3.3 60 70 - 87 89 90 4.6 ≥ 95* ≥ 95* ≥ 95* - - -5.4 ≥ 95* ≥ 95* ≥ 95* 95 96 94 6.6 ≥ 95* ≥ 95* ≥ 95* 100 100 100
Table 7. Time-dependence of the radiolabelling yields of L2 at different pH values (r.t, NH4OAc 0.1 M, 64Cu from batch 1 (pH 2.1 - 4.6), n(ligand) = 0.6 nm, n(Cu) = 8.04 pmol, and
from batch 2 (pH 4.6-6.6), n(ligand) = 0.11 nmol, n(Cu) = 22.4 pmol, L/M = 1.25).
The influence of the pH was also investigated in the range 2.1-6.6 (Table 7, Figure 11). Results indicate that pH control is mandatory for ligand L2, the reaction kinetic being significantly
emphasized by potentiometric and X-ray crystallographic data. However, above pH 5.4, an efficient and quantitative radiolabelling was achieved at room temperature. With quantitative radiolabelling at ligand concentrations as low as 2 ×10⁻⁷ M, we believe that L
2 is a promising
system for the complexation of 64Cu and that it is worth investigating its in vivo behavior in
further studies.
Conclusion
In conclusion, the phosphonate pendant-armed bispidol ligand L2 was easily synthesized in three
steps from piperidinone and (aminomethyl)phosphonic acid. The evaluation of the physico-chemical properties of the corresponding Cu(II) and Zn(II) complexes in water using UV-visible absorption spectrophotometry, potentiometry, 1H and 31P NMR, cyclic voltammetry as well as
radiolabelling experiments with 64Cu(II) has been reported. Fast complexation of Cu(II) occurs in
the 4.6-6.6 pH range and the complex demonstrates a strong thermodynamic stability (log βCuL2
= 22.5, pCu = 19.1 at pH 7.4), a good selectivity for Cu(II) vs. Zn(II) (pZn = 15.4 at pH 7.4), as well as a very good kinetic inertness regarding reduction (with a reversible redox potential of Ered
= -0.60 vs NHE) and acid-assisted dissociation (t1/2 >> 20 months). Quantitative radiolabelling (100% ± 5%) was achieved within 5 minutes at room temperature at pH above 5.4 at ligand concentrations as low as 2 ×10⁻⁷ M. From a coordination chemistry point of view, we believe that
L2 meets all the required criteria to be used as new chelator for PET imaging with 64Cu. Although
it is out of the scope of the present paper, in vitro and in vivo stability studies as well as biodistribution studies are still needed to validate the potential of L2 for 64Cu-immuno PET
imaging. Several functionalization strategies are currently under study in order to obtain bifunctional ligands conjugated to antibodies.
ASSOCIATED CONTENT
Supporting Information. 1D and 2D NMR spectra, plots of potentiometric titration data, plot
showing the influence of scan speed on current intensity at pH 7.4, cyclic voltammograms of CuL2 at various pHs, plot of the evolution of the absorption spectra of the d-d transition on
CuL2H2 in 5M HClO4 over 20 months at 25°C and crystallographic data for 2Na and L2 in CIF
format. This material is available free of charge via the Internet at http://pubs.acs.org. AUTHOR INFORMATION
Corresponding Author
*[email protected], [email protected]. Give contact information for the author(s) to whom correspondence should be addressed.
Author Contributions
The manuscript was written through contributions of all authors. All authors have given approval to the final version of the manuscript.
ACKNOWLEDGMENT
This work was supported by the by the French Centre National de la Recherche Scientifique and the University of Strasbourg (UMR7178). The authors thank Mourad Elhabiri (Laboratoire de Chimie Médicinale et Bioorganique, UMR 7509 CNRS/UdS) for providing the facilities for cyclic voltammetry experiments as well as for thoughtful discussions. R. G. thanks the French Ministry of research and higher education for financial support for his PhD. The ARRONAX
authorities, the French government and the European Union. This work has been, in part, supported by the French National Agency for Research (“Investissements d’Avenir” research grant Equipex Arronax-Plus no. ANR-11-EQPX-0004 and Labex no. ANR-11-LABX-0018-01) and Labex IRON.
REFERENCES
(1) Comba, P.; Kerscher, M.; Schiek, W. Bispidine Coordination Chemistry. In Progress in
Inorganic Chemistry; Karlin, K. D., Ed.; John Wiley & Sons, Inc., 2007; pp 613–704.
(2) Haller, R. Metal chelates of pyridyl-(2)-substituted 3,7-diaza-bicyclo-(3,3,1)-nonanones.
Arch. Pharm. Ber. Dtsch. Pharm. Ges. 1969, 302 (2), 113–118.
(3) Börzel, H.; Comba, P.; Hagen, K. S.; Lampeka, Y. D.; Lienke, A.; Linti, G.; Merz, M.;
Pritzkow, H.; Tsymbal, L. V. Iron Coordination Chemistry with Tetra-, Penta- and Hexadentate Bispidine-Type Ligands. Inorganica Chim. Acta 2002, 337, 407–419.
(4) Born, K.; Comba, P.; Ferrari, R.; Lawrance, G. A.; Wadepohl, H. Stability Constants: A
New Twist in Transition Metal Bispidine Chemistry. Inorg. Chem. 2007, 46 (2), 458–464.
(5) Comba, P.; Kerscher, M.; Merz, M.; Müller, V.; Pritzkow, H.; Remenyi, R.; Schiek, W.;
Xiong, Y. Structural Variation in Transition-Metal Bispidine Compounds. Chem. – Eur. J.
2002, 8 (24), 5750–5760.
(6) Bukowski, M. R.; Comba, P.; Lienke, A.; Limberg, C.; Lopez de Laorden, C.; Mas-Ballesté, R.; Merz, M.; Que, L. Catalytic Epoxidation and 1,2-Dihydroxylation of Olefins with Bispidine–Iron(II)/H2O2 Systems. Angew. Chem. Int. Ed. 2006, 45 (21), 3446–3449.
(7) Born, K.; Comba, P.; Daubinet, A.; Fuchs, A.; Wadepohl, H. Catecholase Activity of Dicopper(II)-Bispidine Complexes: Stabilities and Structures of Intermediates, Kinetics and Reaction Mechanism. JBIC J. Biol. Inorg. Chem. 2007, 12 (1), 36–48.
(8) Comba, P.; Haaf, C.; Lienke, A.; Muruganantham, A.; Wadepohl, H. Synthesis, Structure,
and Highly Efficient Copper-Catalyzed Aziridination with a Tetraaza-Bispidine Ligand.
Chem. – Eur. J. 2009, 15 (41), 10880–10887.
(9) Zayya, A. I.; Spencer, J. L. Coordination Chemistry of a Bicyclic 3-Aza-7-Phosphabicyclo[3.3.1]-Nonan-9-One Ligand. Organometallics 2012, 31 (7), 2841–2853.
(10) Scharnagel, D.; Müller, A.; Prause, F.; Eck, M.; Goller, J.; Milius, W.; Breuning, M. The First Modular Route to Core-Chiral Bispidine Ligands and Their Application in Enantioselective Copper(II)-Catalyzed Henry Reactions. Chem. – Eur. J. 2015, 21 (35), 12488–12500.
(11) Barman, P.; Vardhaman, A. K.; Martin, B.; Wörner, S. J.; Sastri, C. V.; Comba, P. Influence of Ligand Architecture on Oxidation Reactions by High-Valent Nonheme Manganese Oxo Complexes Using Water as a Source of Oxygen. Angew. Chem. Int. Ed. 2015, 54 (7), 2095–2099.
(12) Ang, W. J.; Chng, Y. S.; Lam, Y. Fluorous Bispidine: A Bifunctional Reagent for Copper-Catalyzed Oxidation and Knoevenagel Condensation Reactions in Water. RSC Adv. 2015,
5 (99), 81415–81428.
(13) Bautz, J.; Comba, P.; Que, L. Spin-Crossover in an Iron(III)−Bispidine−Alkylperoxide System. Inorg. Chem. 2006, 45 (18), 7077–7082.
(14) Atanasov, M.; Busche, C.; Comba, P.; El Hallak, F.; Martin, B.; Rajaraman, G.; van Slageren, J.; Wadepohl, H. Trinuclear {M1}CN{M2}2 Complexes (M1 = CrIII, FeIII, CoIII; M2 = CuII, NiII, MnII). Are Single Molecule Magnets Predictable? Inorg. Chem.
2008, 47 (18), 8112–8125.
(15) Atanasov, M.; Comba, P.; Helmle, S. Cyanide-Bridged FeIII–CuII Complexes: Jahn–Teller Isomerism and Its Influence on the Magnetic Properties. Inorg. Chem. 2012, 51 (17), 9357–9368.
(16) Kolanowski, J. L.; Jeanneau, E.; Steinhoff, R.; Hasserodt, J. Bispidine Platform Grants Full Control over Magnetic State of Ferrous Chelates in Water. Chem. – Eur. J. 2013, 19 (27), 8839–8849.
(17) Comba, P.; Rudolf, H.; Wadepohl, H. Synthesis and Transition Metal Coordination Chemistry of a Novel Hexadentate Bispidine Ligand. Dalton Trans. 2015, 44 (6), 2724– 2736.
(18) Juran, S.; Walther, M.; Stephan, H.; Bergmann, R.; Steinbach, J.; Kraus, W.; Emmerling, F.; Comba, P. Hexadentate Bispidine Derivatives as Versatile Bifunctional Chelate Agents for Copper(II) Radioisotopes. Bioconjug. Chem. 2009, 20 (2), 347–359.
(19) Comba, P.; Hunoldt, S.; Morgen, M.; Pietzsch, J.; Stephan, H.; Wadepohl, H. Optimization of Pentadentate Bispidines as Bifunctional Chelators for 64Cu Positron Emission
Tomography (PET). Inorg. Chem. 2013, 52 (14), 8131–8143.
(20) Comba, P.; Kubeil, M.; Pietzsch, J.; Rudolf, H.; Stephan, H.; Zarschler, K. Bispidine Dioxotetraaza Macrocycles: A New Class of Bispidines for 64Cu PET Imaging. Inorg.
Chem. 2014, 53 (13), 6698–6707.
(21) Roux, A.; Nonat, A. M.; Brandel, J.; Hubscher-Bruder, V.; Charbonnière, L. J. Kinetically Inert Bispidol-Based Cu(II) Chelate for Potential Application to 64/67Cu Nuclear Medicine and Diagnosis. Inorg. Chem. 2015, 54 (9), 4431–4444.
(22) Brasse, D.; Nonat, A. Radiometals: Towards a New Success Story in Nuclear Imaging?
Dalton Trans. 2015, 44 (11), 4845–4858.
(23) Adumeau, P.; Sharma, S. K.; Brent, C.; Zeglis, B. M. Site-Specifically Labeled Immunoconjugates for Molecular Imaging—Part 1: Cysteine Residues and Glycans. Mol.
Imaging Biol. 2016, 18 (1), 1–17.
(24) Adumeau, P.; Sharma, S. K.; Brent, C.; Zeglis, B. M. Site-Specifically Labeled Immunoconjugates for Molecular Imaging—Part 2: Peptide Tags and Unnatural Amino Acids. Mol. Imaging Biol. 2016, 18 (2), 153–165.
(25) England, C. G.; Hernandez, R.; Eddine, S. B. Z.; Cai, W. Molecular Imaging of Pancreatic Cancer with Antibodies. Mol. Pharm. 2016, 13 (1), 8–24.
(26) Sehlin, D.; Fang, X. T.; Cato, L.; Antoni, G.; Lannfelt, L.; Syvänen, S. Antibody-Based PET Imaging of Amyloid Beta in Mouse Models of Alzheimer’s Disease. Nat. Commun.
2016, 7, 10759.
(27) Wu, A. M. Antibodies and Antimatter: The Resurgence of Immuno-PET. J. Nucl. Med.
2009, 50 (1), 2–5.
(28) Steiner, M.; Neri, D. Antibody-Radionuclide Conjugates for Cancer Therapy: Historical Considerations and New Trends. Am. Assoc. Cancer Res. 2011, 17 (20), 6406–6416. (29) Kaur, S.; Venktaraman, G.; Jain, M.; Senapati, S.; Garg, P. K.; Batra, S. K. Recent Trends
in Antibody-Based Oncologic Imaging. Cancer Lett. 2012, 315 (2), 97–111.
(30) Wadas, T. J.; Wong, E. H.; Weisman, G. R.; Anderson, C. J. Coordinating Radiometals of Copper, Gallium, Indium, Yttrium, and Zirconium for PET and SPECT Imaging of Disease. Chem. Rev. 2010, 110 (5), 2858–2902.
![Figure 3. Spectrophotometric titrations of L 2 vs pH between −0.6 < p[H] < 1.73 (Batch titration) and 2.10 ≤ pH ≤ 11.93 (Direct titration)](https://thumb-eu.123doks.com/thumbv2/123doknet/7774743.257481/25.918.133.789.323.759/figure-spectrophotometric-titrations-l-batch-titration-direct-titration.webp)
![Figure 5. Spectrophotometric titration of Cu L 2 vs pH: (a) [L 2 ] tot = 4.79 × 10 –5 M, [Cu(II)] tot / [ L 2 ] tot = 0.97, −0.60 < pH < 11.99, H 2 O, I = 0.1 M (KCl),T = 25.0(2) °C.(b) [L 2 ] tot = 2.50 × 10 –3 M, [Cu(II)] tot /[ L 2 ] tot](https://thumb-eu.123doks.com/thumbv2/123doknet/7774743.257481/28.918.123.795.74.386/figure-spectrophotometric-titration-cu-tot-cu-ii-kcl.webp)