HAL Id: hal-02732917
https://hal.archives-ouvertes.fr/hal-02732917
Submitted on 2 Jun 2020HAL is a multi-disciplinary open access archive for the deposit and dissemination of sci-entific research documents, whether they are pub-lished or not. The documents may come from teaching and research institutions in France or abroad, or from public or private research centers.
L’archive ouverte pluridisciplinaire HAL, est destinée au dépôt et à la diffusion de documents scientifiques de niveau recherche, publiés ou non, émanant des établissements d’enseignement et de recherche français ou étrangers, des laboratoires publics ou privés.
Increased Lipophilicity of Halogenated Ruthenium(II)
Polypyridyl Complexes Leads to Decreased
Phototoxicity in vitro When Used as Photosensitizers
for Photodynamic Therapy
Saonli Roy, Elisa Colombo, Robin Vinck, Cristina Mari, Riccardo Rubbiani,
Malay Patra, Gilles Gasser
To cite this version:
Saonli Roy, Elisa Colombo, Robin Vinck, Cristina Mari, Riccardo Rubbiani, et al.. Increased Lipophilicity of Halogenated Ruthenium(II) Polypyridyl Complexes Leads to Decreased Phototoxi-city in vitro When Used as Photosensitizers for Photodynamic Therapy. ChemBioChem, Wiley-VCH Verlag, 2020, �10.1002/cbic.202000289�. �hal-02732917�
1
Increased Lipophilicity of Halogenated
Ruthenium(II) Polypyridyl
Complexes Leads to Decreased
Phototoxicity in vitro when Used as
Photosensitizers for Photodynamic Therapy
Dr. Saonli Roy,a Elisa Colombo,a Dr Robin Vinck,b Dr. Cristina Mari,a Dr. Riccardo Rubbiani,a
Dr. Malay Patra*,c and Dr. Gilles Gasser*,b
a Department of Chemistry, University of Zurich, Winterthurerstrasse 190, 8057 Zurich,
Switzerland.
b Chimie ParisTech, PSL University, CNRS, Institute of Chemistry for Life and Health Sciences,
Laboratory for Inorganic Chemical Biology, F-75005 Paris, France.
c Department of Chemical Sciences, Tata Institute of fundamental Research, Laboratory of
Medicinal Chemistry and Cell Biology, Homi Bhabha Road, Navy nagar, 400005 Mumbai, India.
* Corresponding authors: E-mail: malay.patra@tifr.res.in; WWW: https://patralab.wixsite.com/tifr; Phone: +91 0 22 22 78 23 71; E-mail:
gilles.gasser@chimeparistech.psl.eu; WWW: www.gassergroup.com; Phone: +33 1 85 78 41 51. ORCID Number
2 Robin Vinck: 0000-0002-2730-0121
Malay Patra: 0000-0003-3373-6762 Gilles Gasser: 0000-0002-4244-5097
Keywords: Anticancer, Bioinorganic Chemistry, Medicinal Inorganic Chemistry, Metals in
Medicine, Photodynamic Therapy.
TOC
Ru(II) polypyridyl complexes are prime candidates for the development of new photosensitizers for photodynamic therapy. Increasing their lipophilicity could results in improved pharmacological properties. Relationship between lipophilicity and in vitro phototoxicity of halogenated Ru(II) complexes was investigated.
Twitter:
Robin Vinck: RVinck
Gilles Gasser: @GasserGroup
Chimie ParisTech: @ChimieParisTech PSL University: @psl_univ
3
Abstract
In the fight against cancer, photodynamic therapy is generating great interest thanks to its ability to selectively kill cancer cells without harming healthy tissues. In this field, ruthenium(II) polypyridyl complexes, and more specifically, complexes using dipyrido[3,2-a:2’-3’-c]phenazine (dppz) as a ligand are of particular interest due to their DNA-binding and photocleaving properties. However, ruthenium(II) polypyridyl complexes can sometimes suffer from low lipophilicity, which hampers their cellular internalisation through passive diffusion. In this study, 4 new [Ru(dppz-X2)3]2+ (where X = H, F, Cl, Br, I) were synthesized and their lipophilicity (LogP),
cytotoxicity and phototoxicity on cancerous and non-cancerous cell lines assessed. This study shows that the phototoxicity of these complexes counterintuitively decreases when their lipophilicity increases, which could be due solely to the atomic radius of the halogen substituents.
4
Introduction
With 18 million new cases in 2018, cancer incidence is rapidly growing worldwide, as is mortality. Taking into account the evolution of our lifestyle and demographic changes, this number is expected to grow to about 30 million new cases in 2040.[1] This ever-expanding disease has
impelled researchers to constantly improve cancer treatments’ efficacy and safety. Surgery, chemotherapy and radiotherapy, the oldest treatment methods, have been completed or even supplemented over the years by immunotherapy, gene therapy, hyperthermia and more recently, photodynamic therapy (PDT).[2]
PDT involves the local or systemic administration of a non-toxic photosensitiser (PS), followed by irradiation of the diseased tissues. Light-mediated excitation of the PS leads to generation of reactive oxygen species (type I mechanism) or singlet oxygen (1O2 , type II mechanism), which in
turn induce cellular damages in a spatially and temporally controlled manner.[3]–[5]
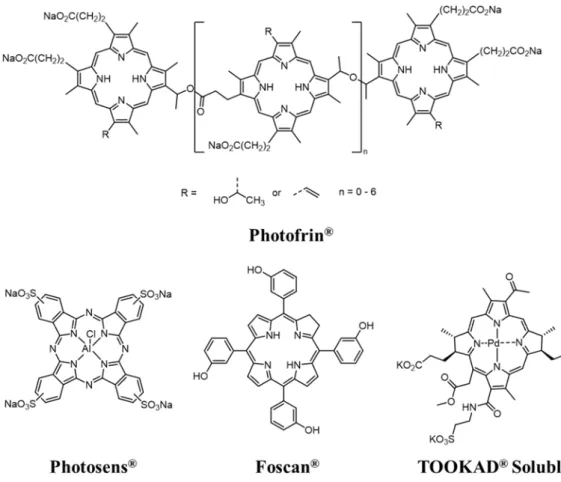
First-generation and most studied PSs are based on porphyrin, phthalocyanine or chlorin scaffolds (e.g., Photofrin®, Photosens®, Foscan®; Figure 1) and are often associated with severe drawbacks,
including fast photobleaching upon light irradiation, poor water solubility and slow elimination rates leading to prolonged photosensitivity in treated patients.[6] Of note, some of these drawbacks
(i.e., low aqueous solubility, poor stability, and limited efficacy) have been addressed, notably through the incorporation of a metal centre in these tetrapyrrolic scaffolds, to yield second-generation PSs (e.g., TOOKAD® Soluble; Figure 1).[7]
5
Figure 1. Structure of the first and second-generation tetrapyrrolic PSs.
More recently, Ru(II) polypyridyl complexes have sparked great interest due to their exceptional properties, including generally good water solubility, high 1O2 production rates and high
photochemical stability as well as original mode of actions related to their unique intracellular distribution (i.e. mitochondria, nucleus, lysosome, etc).[8]–[18] As a proof of the promising nature
of these third-generation PSs, TLD-1433 (Figure 2) has recently entered a phase II clinical trial for the treatment of non-muscle invasive bladder cancer.[7][19]
6
Figure 2. Structures of the Ru polypyridyl complexes TLD-1433 and [Ru(bpy)2dppz]2+.
Over the years, in order to increase chemotherapeutics efficacy, reduce side effects and overcome resistance mechanisms, the development of organelle-targeted drugs appeared highly beneficial. Indeed, targeting essential cell organelles such as mitochondria, nucleus, lysosomes, Golgi apparatus and endoplasmic reticulum have proven to be effective in increasing the efficacy of anticancer drugs, including PDT PSs.[20]–[38] In particular, targeting the nucleus, and more
specifically DNA, seems especially attractive, considering the clinical and commercial success of cisplatin.[39]
In this context, the complex [Ru(bpy)2dppz]2+ (bpy = bipyridine; dppz =
dipyrido[3,2-a:2’-3’-c]phenazine; Figure 2) and its derivatives have been studied for their exceptional DNA-intercalating properties and light switch effect. Upon irradiation, these complexes are able to generate 1O2 in the direct DNA’s vicinity, inducing its oxidative cleavage.[8][40]–[65] We previously
showed that minor structural modifications of the dppz ligand could greatly affect the complex’s DNA binding constant, its 1O
2 production rate as well as its cellular internalisation and
phototoxicity.[66] In light of these results, we believe further structural optimisations are needed to
further improve this class of complex PDT potential.
In the medicinal chemist toolbox, halogen groups are of particular interest. They can be used as hydrogens or methyl group bioisosteres to improve the modified drug metabolic stability, or as a radiolabeling moiety (e.g., 18F). They also generally increase the lipophilicity of the modified drug,
7
enhancing its membrane permeability. Additionally, they allow for the formation of new interactions with their target through halogen bonding.[67] Based on these two last features, we
thought that the dppz ligand could greatly benefit from this halogenation strategy to enhance the cellular internalization and DNA binding affinity of its corresponding complexes, further improving their PDT potential, as already successfully performed with other metal complex classes.[68][69] For these reasons, in this article, we report on the synthesis, physical, photophysical
and biological characterization of 4 new Ru(II) homoleptic complexes based on halogenated dppz ligands.
Result and Discussion
Synthesis and Characterization
We first attempted the synthesis of these complexes using route A (Scheme 1). For this purpose, dppz and dppz-F2 ligands were synthesized by reacting 1,10-phenanthroline-5,6-dione (phendione) with benzene-1,2-diamine and 4,5-difluorobenzene-1,2-diamine, respectively. Refluxing a mixture of dppz or dppz-F2 with RuCl3 afforded the respective complexes 1 and 2 in
20 to 25 % yields. As the purification using silica column chromatography was tedious, and in order to improve the yield, we adopted route B (Scheme 1) as used previously by Leveque et al. for their synthesis of dendritic tetranuclear Ru(II) complexes.[70] This route involves the synthesis
of Ru(phendione)3 as an intermediate starting from phendione and Ru(DMSO)4Cl2.
Ru(phendione)3 was then reacted with benzene-1,2-diamine and 4,5-di-halo-benzene-1,2-diamines
to give the ruthenium complexes 1-5. Compounds 1, 2, 4 and 5 were isolated with 75-90 % yields. Unlike other complexes, we observed several unidentified impurities together with 3 during the reaction of Ru(phendione)3 and 4,5-di-chloro-benzene-1,2-diamine. After HPLC purification,
8
1H-, 13C-, 19F-NMR spectroscopies and ESI-mass spectrometry (See supporting information). The
purity was confirmed by elemental microanalysis.
Scheme 1. Synthetic routes A and B for the preparation of ruthenium polypyridyl complexes
studied in this work.
UV-Vis Absorption and Distribution Coefficient
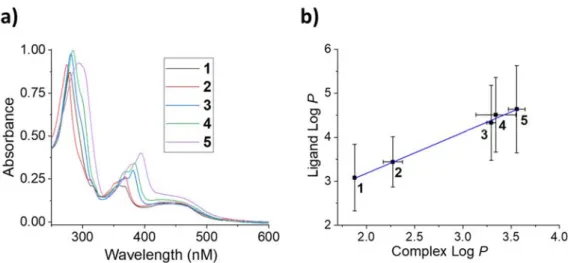
Having the complexes in hand, we studied their UV-Vis absorption properties. Absorption wavelength of PSs is one of the most important properties as it directly correlates with the tissue penetration depth of the light during PDT treatments. Therefore, the absorption profiles of 1-5 were recorded in CH3CN and are presented in Figure 3 and Table 1. The absorption bands are
similar to those reported previously for ruthenium polypyridyl dppz complexes.[66] The broad band
centered at about 450 nm is due to MLCT transition and does not seem to be affected by the incorporation of halogen groups in the ligand structure. The bands in the 320–380 nm region and below 300 nm region are solely ligand centered, originating from intra and inter-ligand charge
9
transfers. Interestingly, this band is slightly red-shifted in the order 5 > 4 ≈ 3 > 2 ≈ 1. This could be due to an electronic contribution of the halogen groups.
The octanol-water partition coefficient (LogP) is an important parameter for drug candidates as it highly affects its passive diffusion-mediated cellular uptake.[71] We employed the “shake-flask”
method to measure the LogP values of 1-5 and used the ALOGPS 2.1 program to calculate the LogP values of the free ligands (Table 1). As expected, a linear correlation between the LogP of ruthenium complexes and their corresponding free ligand was observed (Figure 3b). The non-halogenated derivative 1 and its ligand dppz have the lowest LogP values. Introduction of fluoride substituents, as in the case of 2, only slightly increased the logP values of the complex and free ligand (0.4 unit). However, other halogens significantly increased the log P values (more than 1 unit.). Overall, the lipophilicity of the complexes [Ru(dppz-X2)3]2+ increases in the order H < F <
Cl < Br < I.
Figure 3. a) UV-Vis spectra of the complexes (5 µM) in acetonitrile. b) Correlation between the
experimentally determined LogP of 1-5 and calculated LogP of ligands.
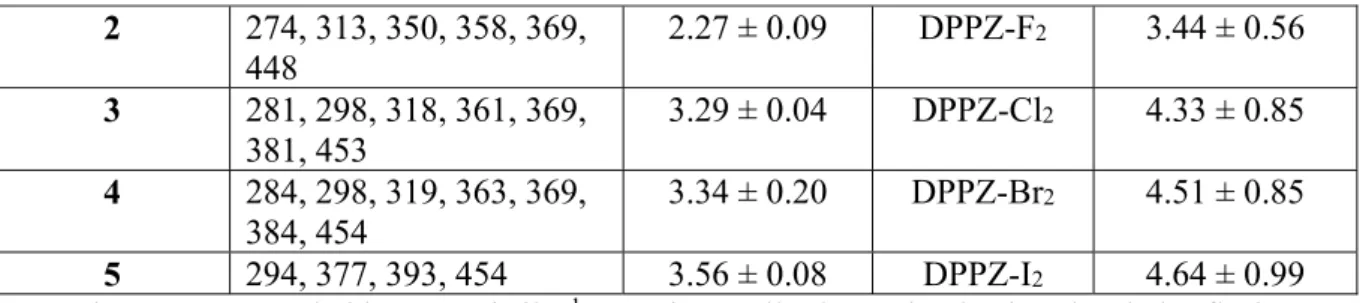
Table 1. Absorption wavelengths and LogP values of ruthenium complexes and their free
ligands.
Compounds UV/Vis λ [nm]a LogPb Ligands LogPc
10 2 274, 313, 350, 358, 369, 448 2.27 ± 0.09 DPPZ-F2 3.44 ± 0.56 3 281, 298, 318, 361, 369, 381, 453 3.29 ± 0.04 DPPZ-Cl2 4.33 ± 0.85 4 284, 298, 319, 363, 369, 384, 454 3.34 ± 0.20 DPPZ-Br2 4.51 ± 0.85 5 294, 377, 393, 454 3.56 ± 0.08 DPPZ-I2 4.64 ± 0.99 aUV-Vis spectra recorded in acetonitrile. bExperimentally determined using the shake-flask
method. cCalculated using the ALOGPS 2.1 online software.
Generation of Singlet Oxygen
To evaluate the PDT potential of our newly synthesized PSs, we measured their ability to produce singlet oxygen 1O2 (1∆g) upon irradiation at 420 nm in acetonitrile and PBS. This wavelength is
commonly used to evaluate photoactivatable anticancer compounds and all of our compounds showed a broad absorbance between 410 to 480 nm.[66][72]–[74] We employed an indirect method
involving the use of a probe molecule (p-nitrosodimethyl aniline, RNO). The absorbance of RNO
is quenched is the presence of an imidazole-peroxide adduct generated by the reaction of imidazole and 1O2.[66][75] The quantum yields for the formation of 1O2 (ф) are calculated using a reference
compound (phenalenone, ф = 95 %) and are presented in Table 2. In acetonitrile, 1-5 showed high
ϕ values ranging from 58 to 88 % upon irradiation at 420 nm, which are comparable to structurally
similar ruthenium polypyridyl complexes reported previously.[10][12][14][15][66] However, we noted
that ф values are much lower (2-6%) when measured in PBS. This observation is consistent with our previous studies on polypyridyl complexes and attributed to the interaction of the dppz ligands with water molecules, which does not allow energy transfer to molecular oxygen.[66] Based on this
observation, we anticipated that 1O2 will be produced upon irradiation only when the complexes
occupy hydrophobic environments following their binding to protein or DNA inside cells (light switch effect).
Table 2. Quantum yields for the formation of 1O2 (ф) upon irradiation at 420 nm of 1–5. ф are
presented as the average of three measurements, ± 10%. Complexes Acetonitrile [%] PBS [%]
11 1 88 6 2 69 5 3 76 2 4 67 2 5 58 3 (Photo-)toxicity in Cells
After having established that 1-5 produces high level of 1O
2 in an hydrophobic environment, we
evaluated their cytotoxicity in the dark in human cervical cancer (HeLa) and non-cancerous lung epithelial (MRC5) cells. After 48 h of continuous incubation with increasing concentrations of the compounds, cell viability was determined using the resazurin assay and the IC50 values are
presented in Table 3 (Figure S16 and S17 for dose response curves). Compound 1-5 showed moderate toxicity with IC50 values of 23-43 µM in MRC5 cells. However, in HeLa cells, all the
compounds have IC50 values >100 µM in the dark. Of note, cisplatin exhibited IC50 values of 16
µM and 4 µM in MRC5 and HeLa cells, respectively and therefore is more cytotoxic compared to complexes 1-5. The effect of light irradiation at 420 nm was studied on HeLa cells. To this end, cells were incubated for 4 h with increasing concentrations of the compounds. The media was then replaced with fresh media, cells were irradiated with light for 20 min at 420 nm (9.27 J.cm-2) and
were incubated for an additional 44 h before determining the cell viability (Figure S18, for dose response curves).[66] As shown in Table 3, compounds 4 and 5 showed no phototoxicity in the
presence of light. Compound 3 exhibited moderate toxicity with an IC50 value of 55 µM. However,
1 and 2 showed a remarkable phototoxic effect with IC50 values of 2 µM and 5 µM, respectively
(Figure 2). Importantly, these values are comparable with the clinically used PDT agent photofrin and the chemotherapeutic agent cisplatin.[76][77] Comparison of IC50 values in the dark and in the
presence of 420 nm light in HeLa cells revealed the high phototoxic indexes (PI = IC50 in the
12
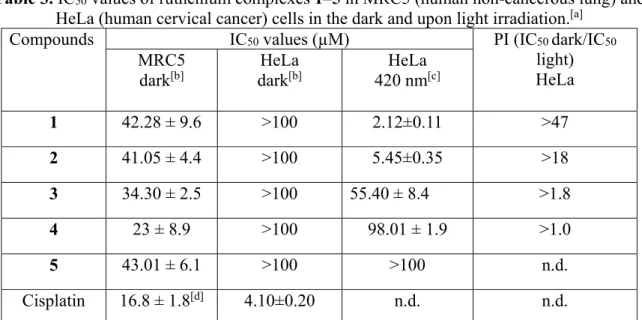
Table 3. IC50 values of ruthenium complexes 1–5 in MRC5 (human non-cancerous lung) and
HeLa (human cervical cancer) cells in the dark and upon light irradiation.[a]
Compounds IC50values (µM) PI (IC50 dark/IC50
light) HeLa MRC5
dark[b] darkHeLa [b] 420 nmHeLa [c]
1 42.28 ± 9.6 >100 2.12±0.11 >47 2 41.05 ± 4.4 >100 5.45±0.35 >18 3 34.30 ± 2.5 >100 55.40 ± 8.4 >1.8 4 23 ± 8.9 >100 98.01 ± 1.9 >1.0 5 43.01 ± 6.1 >100 >100 n.d. Cisplatin 16.8 ± 1.8[d] 4.10±0.20 n.d. n.d.
[a] Data reflect the mean±SD of results from three independent experiments, each performed in triplicate; [b] 48 h incubation; [c] 4 h incubation, light dose 9.27 J.cm-1; n.d. = not determinable.
[d] taken from literature.[66]
Overall, the phototoxicity of complexes [Ru(dppz-X2)3]2+ decreases in the order I < Br < Cl < F
< H. Therefore, the phototoxicity of these complexes does not increase when their lipophilicity increases, as we initially expected.
Conclusion
Thanks to its DNA-intercalating properties, the dppz ligand is of great interest in the development of new DNA-targeted PSs. In this study, our aim was to increase the lipophilicity of dppz-based Ru(II) complexes through an halogenation strategy in order to increase their membrane permeability and therefore their PDT potential. Although the lipophilicity of the resulting complexes 2-5 was effectively increased compared to the complex [Ru(dppz)3]2+, the latter was
still the most phototoxic PS of our scope. We could argue that although the enhanced lipophilicity of complexes 2-5 could contribute positively to their PDT potential, the incorporation of a bulky halogen group may affect the complexes’ binding to DNA, which is essential to their activity. Indeed, dppz-based Ru(II) complexes have been described to bind DNA through the minor groove.[40] This intercalation process requires the dppz ligand to get through the DNA’s double
13
helix, which could be prevented by bulky halogen atoms. Thus, the phototoxicity of complexes
1-5 seems to decrease when the atomic radius of the substituent increases. This phenomenon could
be linked to a very recent study by Chao and coworkers, where poly-fluorinated cyclometalated Ru(II) complexes were found to be less cytotoxic than the mono-fluorinated derivative.[69] This
study highlights the high structural sensitivity of dppz ligands regarding their ability to bind to DNA. Alternatively, changes in halogen substitution on dppz ligands may also modulate the cellular uptake and intracellular localization of the resulting ruthenium complexes, which might also, at least in part, influence the phototoxicity.
14
Experimental Section. General information.
Materials. All chemicals were of reagent grade quality or better, obtained from commercial
suppliers, and used without further purification. Solvents were used as received or dried over molecular sieves. All preparations were carried out using standard Schlenk techniques. [Ru(phendione)3](PF6)2,[70] dipyrido[3,2-a:2’,3’-c]phenazine (dppz),[78][79] were prepared
following literature procedures and the characterization data matches those reported previously.
Instrumentation and methods. Thin layer chromatography (TLC) was performed using silica gel
60 F-254 (Merck) plates with spot detection using UV light. NMR spectra were recorded on Bruker 400 and 500 MHz spectrometers at 20 °C. All the measurements were carried out using deuterated solvents, chemical shifts δ are reported in parts per million (ppm) and coupling constants J are given as absolute values in Hz. The residual solvent peaks were used as an internal reference for
1H and 13C NMR spectra and chemical shifts are expressed relative to tetramethylsilane (SiMe4, δ
= 0 ppm). Abbreviations for the peak multiplicities are as follows: s (singlet), d (doublet), dd (doublet of doublets), t (triplet), q (quartet), m (multiplet), and br (broad). ESI mass spectra were recorded on a Bruker Esquire 6000 spectrometer. Elemental microanalyses were performed on a LecoCHNS-932 elemental analyzer.UV/Vis absorption spectra were measured on a Varian
Cary 50 Scan UV/vis spectrophotometer. Analytical HPLC was performed using a Hitachi Chromaster UPLC system fitted with a reverse phase Acquity UPLC column (BEH C18, 1.7 µm, 2.1 mm ID x 50 mm). The flow rate used was 0.6 mL min-1 with a linear gradient of solvent A
(distilled H2O containing 0.1% TFA) and B (acetonitrile): t = 0-0.5 min., 5% B; t = 9.5 min., 100%
B; t = 10 min., 100% B. Electronic absorption was measured at 300 nm.Preparative HPLC was
performed using a Varian ProStar 320 system fitted with a C18 reverse-phase column (Agilent Zorbax SB-C18, 21.2 mm × 250 mm, 7 μm). The flow rate was 10 mL min-1 and electronic
15
Synthesis of ligands
11,12-difluoro-dipyrido[3,2-a:2’,3’-c]phenazine (dppz-F2). Phendione (44.4 mg, 0.211 mmol)
and 4,5-difluorobenzene-1,2-diamine (60.5 mg, 0.420 mmol) were dissolved in 5 mL of glacial acetic acid. The solution was heated at 110 °C and stirred for 2 h under reflux, then it was let equilibrate in air. 60 mL of water were added to the solution and a precipitate was formed. The yellowish precipitate was washed with 5 mL of water, 5 mL of ethanol, 3 mL of acetone and 3 mL of diethyl ether. The product was then dried under vacuum. Yield: 130 mg, 89%. The compound was used without further purification for the next synthetic step. 1H NMR (400 MHz, DMSO-d
6):
δ (ppm) 9.51-9.49 (d, 2H), 9.24-9.23 (m, 2H), 8.47-8.43 (t, 2H), 7.99-7.95 (m, 2H). 13C{1H} NMR
(126 MHz, DMSO-d6 + one drop TFA): δ (ppm) 156.0, 155.9, 153.9, 153.8, 150.1, 141.8, 141.7,
141.6, 141.6, 140.5, 139.7, 130.1, 128.3, 116.1, 116.0. 19F NMR (400 MHz, CD3CN): δ (ppm)
-128.55. ESI-MS (pos. detection mode): m/z (%): Found 319.1 [M+H]+, calculated m/z for [M+H]+
319.08.
Synthesis of ruthenium complexes
Synthetic route A. Ruthenium(III) chloride (0.042 mmol, 8.7 mg) and the respective ligands (0.17
mmol, 4 equiv.) were suspended in ethylene glycol (10 mL). The solution was degassed for 5 min and then refluxed overnight (~ 15 h). The mixture was then cooled to room temperature and aqueous NH4PF6 (10 %, 15 mL) was added to precipitate the crude product. The precipitate was
collected using vacuum filtration, washed with water, ice cold ethanol, diethyl ether, and dried under reduced pressure. The red powder was then purified by flash column chromatography on silica gel using CH3CN/KNO3 aqueous solution 0.4 M (25:1) as eluent. The fractions containing
the product were combined and solvent was removed using a rotary evaporator. The residue was dissolved in CH3CN (30 mL) and the excess KNO3 was removed by filtration. The red filtrate was
concentrated to ca. 3 mL and NH4PF6 (10 %, 15 mL) was added to precipitate the complex as a
16
(25 mL) and diethyl ether (25 mL) and dried. Compounds were obtained as red powders (yields: 13 mg, 24 % for 1, 15 mg, 26 % for 2).
Synthetic Route B. A mixture of [Ru(phendione)3](PF6)2 (1 equiv.) and phenylenediamine
derivatives (5.8 equiv.) in 32 mL degassed CH3CN/EtOH (1/3, v/v) was heated at 80 °C for 20 h
under N2 atmosphere. A reddish suspension starts to appear during the reaction. The reaction
mixture was then concentrated using a rotary evaporator (to ca. 10 mL) and cooled to room temperature. Addition of 15 mL of water followed by 15 mL of a saturated NH4PF6 solution
resulted in the formation of a red/orange precipitate. The precipitate was collected using vacuum filtration, washed with distilled water, ice cold ethanol followed by ethanol and finally with diethyl ether. The precipitate was dried under reduced pressure to give the desired ruthenium complex.
Compound 1. The compound was prepared following route B. The reaction was done on a 0.12
mmol scale of [Ru(phendione)3](PF6)2 and the ruthenium complex 1 was isolated as a deep orange
powder (yield: 130 mg, 89%). 1H NMR (500 MHz, DMSO-d6): δ (ppm) 9.67 (d, 6H, J = 7.8 Hz),
8.55 (dd, 6H, J = 6.5, 3.4 Hz), 8.38 (d, 6H, J = 4.9 Hz), 8.22 (dd, 6H, J = 6.5, 3.5 Hz), 7.97 (dd, 6H, J = 8.2, 5.4 Hz). 13C{1H} NMR (126 MHz, DMSO-d
6): δ (ppm) 154.9, 151.1, 142.4, 140.7,
133.9, 133.1, 130.6, 129.9, 128.0. ESI-MS (pos. detection mode): m/z (%): Found 473.9 [M-2PF6]2+, calculated m/z for M-2PF6]2+ 474.1 Anal. Calcd for C54H30F12N12P2Ru∙(H2O)2: C 50.91,
H 2.69, N 13.19. Found: C 51.16, H 3.09, N 13.09.
Compound 2. The compound was prepared following route B. The reaction was done on a 0.09
mmol scale of [Ru(phendione)3](PF6)2 and the ruthenium complex 2 was isolated as an orange
powder (yield: 100 mg, 76%). 1H NMR (500 MHz, CD3CN): δ (ppm) 9.67 (dd, 6H, J = 8.2, 1.1
Hz), 8.46 – 8.21 (m, 12H), 7.87 (dd, 6H, J = 8.2, 5.4 Hz). 13C{1H} NMR (126 MHz, CD3CN): δ
(ppm) 155.2 (d) and 153.1 (d), 154.7, 150.7, 140.7 (t), 140.2, 133.8, 130.5, 127.5, 114.9 (dd). 19F
17
detection mode): m/z (%): Found 528.1 [M-2PF6]2+, calculated m/z for [M-2PF6]2+ 528.06.Anal.
Calcd for C54H24F18N12P2Ru: C 48.19, H 1.80, N 12.49. Found: C 47.95, H 1.67, N 12.22.
Compound 3. The compound was prepared following route B. The reaction was done on a 0.09
mmol scale of [Ru(phendione)3](PF6)2 and the ruthenium complex 2 was isolated. However, an
extra purification step using preparative HPLC was required to isolate the ruthenium complex 3 in its pure form. The runs were performed at 10mL per minute flow rate with linear gradients of millipore water with 0.1% TFA (A) and Acetonitrile with 0.1% TFA (B; Sigma-Aldrich HPLC-grade): t = 0-5 min, 30 % B; t = 10 min, 50% B; t = 30 min, 100% B. Absorption was monitored at 300 nm. The pure fractions containing the product were collected, acetonitrile was removed using a rotary evaporator and remaining water was removed using a freeze dryer. The residue was dissolved in 2 mL acetonitrile and 10 mL of a saturated NH4PF6 solution was added. The
precipitate was collected using vacuum filtration, washed with water (3 x 20 mL) and dried to give pure complex 3 as a red solid (yield after HPLC purification: 30 mg, 21%). 1H NMR (500 MHz,
CD3CN): δ (ppm) 9.66 (dd, 6H, J = 8.2, 1.1 Hz,), 8.73 (s, 6H), 8.33 (dd, 6H, J = 5.4, 1.1 Hz), 7.87
(dd, 6H, J = 8.2, 5.4 Hz). 13C{1H} NMR (126 MHz, CD3CN): δ (ppm) 154.9, 151, 141.5, 140.9,
136.6, 134.0, 130.5, 130.1, 127.5. 19F NMR (400 MHz, CD3CN): δ (ppm) -76.4 (residual
CF3COOH), -72.2 and -73.7 (PF6 ̶ ). ESI-MS (pos. detection mode): m/z (%): Found 577.5
[M-2PF6]2+, calculated m/z for [M-2PF6]2+ 577.3. Anal. Calcd for
C54H24Cl6F12N12P2Ruꞏ(CF3COOH)0.5: C 43.99, H 1.64, N 10.77. Found: C 43.91, H 1.69, N 10.77.
Compound 4. The compound was prepared following route B. The reaction was done on a 0.12
mmol scale and the ruthenium complex 4 was isolated as red powder (yield: 170 mg, 85%). 1H
NMR (500 MHz, DMSO-d6): δ (ppm) 9.57 (d, 6H J = 8.1 Hz), 8.97 (s, 6H), 8.39 (d, 6H, J = 4.9
Hz), 8.02 – 7.94 (m, 6H). 13C{1H} NMR (126 MHz, DMSO-d6): δ (ppm) 155.3, 151.4, 141.6,
18
[M-2PF6]2+, calculated m/z for [M-2PF6]2+ 710.7. Anal. Calcd for C54H24Br6F12N12P2Ruꞏ(HPF6)0.5:
C 36.35, H 1.38, N 9.42. Found: C 36.48, H 1.18, N 9.36.
Compound 5. The compound was prepared following route B. The reaction was done on a 0.14
mmol scale and the ruthenium complex 5 was isolated as a red powder (yield: 230 mg, 83%). 1H
NMR (500 MHz, DMSO-d6): δ (ppm) 9.56 (d, 6H, J = 8.3 Hz), 9.10 (s, 6H), 8.36 (d, 6H, J = 5.2
Hz), 7.96 (dd, 6H, J = 8.1, 5.5 Hz).13C{1H} NMR (126 MHz, DMSO-d6): δ (ppm) 155.2, 151.3,
141.7, 141.3, 139.1, 133.9, 130.3, 128.1, 115.1. ESI-MS (pos. detection mode): m/z (%): Found 852.1 [M-2PF6]2+, calculated m/z for [M-2PF6]2+ 851.7. Anal. Calcd for C54H24I6F12N12P2RuꞏH2O:
C 32.25, H 1.30, N 8.36. Found: C 32.01, H 1.19, N 7.91.
Measurement of octanol-water partition coefficient (log P)
The log P values for compounds 1–5 were determined using the shake-flask method. Octanol used in this experiment was pre-saturated with PBS by overnight incubation with shaking of a biphasic mixture of the two at room temperature. Each complex was added into 1 mL of n-octanol to give a final concentration of 20 μM. To this solution was added 1 mL of phosphate buffer (10 mM, pH 7.01), and the mixture was shaken for 1h using an automated shaker and allowed to stand for 1 h. Aliquots from the n-octanol phase and the aqueous phase were extracted and analyzed using RPUPLC to determine their relative concentrations in each phase. The measurements were repeated three times for each complex.
Measurement of singlet oxygen quantum yields
Quantum yields for singlet oxygen formation (ф) were determined in both acetonitrile and PBS using a comparative method with phenalenone as reference (фref = 95%). For measurements in
acetonitrile, a 1 mL solution containing the complex (at a concentration with OD = 0.1 at the irradiation wavelength), p-nitrosodimethyl aniline (RNO; 24 μM), and imidazole (12 mM) was prepared in a luminescence quartz cuvette. The solution was then irradiated in a Rayonet RPR-200 photochemical reactor for different time intervals. For measurements in PBS, a 1 mL solution
19
containing the complex (OD = 0.1 at the irradiation wavelength), RNO (20 μM), and histidine (10 mM) was used instead. After each irradiation interval, the absorbances were recorded at 420 nm and these data were used to create plots of the variations in absorbance (A0 − A, where A0 is the
absorbance at time zero) over irradiation time. The slope of the linear regression (Ssample) for the
plot was calculated and compared against the slope of the linear regression of the reference compound (Sref) with inclusion of the absorbance correction factors (Iref/Isample) to determine the
quantum yield of singlet oxygen formation for the sample (фsample). The following equations were
used for the calculations:
∅𝑠𝑎𝑚𝑝𝑙𝑒 ∅𝑟𝑒𝑓 𝑆𝑠𝑎𝑚𝑝𝑙𝑒 𝑆𝑟𝑒𝑓
𝐼𝑟𝑒𝑓 𝐼𝑠𝑎𝑚𝑝𝑙𝑒
where: I = I0 (1 1 10 )
I0 = light intensity of the irradiation source in the irradiation interval, and A(λ) = absorbance of
sample at λ.
Cell lines and cell culture conditions
HeLa (human cervical cancer) cells were grown in DMEM (Gibco) medium supplemented with 10% fetal bovine serum and 1% penicillin/streptomycin. MRC5 (normal human fetal lung fibroblast) cells were maintained in F-10 (Gibco) medium supplemented with 10% fetal bovine serum and 1% penicillin/streptomycin. All cells were cultured at 37 ⁰C in a humidified atmosphere containing 5% CO2.
Dark and phototoxicity assays
The fluorometric resazurin (Promocell GmbH) assay was used to determine the cytotoxicity of the ruthenium complexes in vitro. HeLa (4000/well in 100 µL medium) and MRC5 (7000/well in 100
20
µL medium) cells were seeded in 96-well plates and incubated overnight. The following day, freshly prepared stock solutions (20 mM) of the ruthenium complexes in DMSO were serially diluted using culture media and 100 µL of the corresponding dilutions were added to each well (total volume 200 µL/well). Cells were then incubated for 48 h. The medium was aspirated, fresh media containing resazurin (0.2 mg.mL-1) was added (100 µL/well) and incubated for 4 h. The
fluorescence of the resorufin metabolite was quantified at 590 nm with an excitation wavelength of 540 nm using a SpectraMax M5 microplate reader.
For phototoxicity studies, cells were incubated with increasing concentrations of compounds for 4 h. Subsequently, the medium was replaced with 200 μL fresh medium and cells were irradiated for 20 min at 420 nm (9.27 J cm-2) in a Rayonet Chamber Reactor. Light doses were evaluated
with a Gigahertz Optic X1-1 Optometer. Afterwards, cells were incubated for an additional 44 h and cell viability was evaluated using the resazurin assay as described above. Fluorescence values were normalized to control wells and plotted as concentration of test compound versus % cell viability. IC50 values were interpolated from the resulting dose-dependence curves. The reported
IC50 values are the average from at least three independent experiments, each of which consisted
of either three or six replicates per concentration level.
Acknowledgements
This work was financially supported by an ERC Consolidator Grant PhotoMedMet to G.G. (GA 681679), the Swiss National Science Foundation (Professorships N° PP00P2_133568 and PP00P2_157545 to G.G.), the University of Zurich (G.G), the Novartis Jubilee Foundation (G.G and R.R.), the Forschungskredit of the University of Zurich (R.R.), the UBS Promedica Stiftung (G.G and R.R.), a Qlife prématuration funding (G.G. and R.V.), and has received support under the program Investissements d’Avenir launched by the French Government and implemented by the ANR with the reference
ANR-10-IDEX-21
0001-02 PSL (G.G.). M.P. gratefully acknowledge the financial supports from Department of Atomic Energy (DAE) and Tata Institute of Fundamental Research (TIFR). We thank Dr. Phuc Ung for helpful discussions.
Supporting Information
1H, 13C{1H} and 19F NMR spectra of dppz-F
2 (Figures S1-S3) and 2 (Figures S6-S8), 1H and
13C{1H} NMR spectra of 1 (Figures S4 and S5) and 3-5 (Figures S9-S15), dose response curves of
MRC5 cells incubated with test compounds for 48 h in the dark (Figure S16), dose response Curves of HeLa cells incubated with test compounds for 48 h in the dark (Figure S17), Dose response Curves of HeLa cells incubated with test compounds for 4 h, irradiated with 420 nm light (Figure S18).
22
References.
[1] Global Cancer Observatory http://gco.iarc.fr/ (accessed Apr 9, 2020).
[2] M. Arruebo, N. Vilaboa, B. Sáez-Gutierrez, J. Lambea, A. Tres, M. Valladares, Á. González-Fernández, Cancers 2011, 3, 3279–3330.
[3] D.E.J.G.J. Dolmans, D. Fukumura, R.K. Jain, Nat. Rev. Cancer 2003, 3, 380–387. [4] B.W. Henderson, T.J. Dougherty, Photochem. Photobiol. 1992, 55, 145–157.
[5] K. Plaetzer, B. Krammer, J. Berlanda, F. Berr, T. Kiesslich, Lasers Med. Sci. 2009, 24, 259– 268.
[6] A.E. O’Connor, W.M. Gallagher, A.T. Byrne, Photochem. Photobiol. 2009, 85, 1053–1074. [7] S.A. McFarland, A. Mandel, R. Dumoulin-White, G. Gasser, Curr. Opin. Chem. Biol. 2020,
56, 23–27.
[8] F. Heinemann, J. Karges, G. Gasser, Acc. Chem. Res. 2017, 50, 2727–2736.
[9] M. Jakubaszek, B. Goud, S. Ferrari, G. Gasser, Chem. Commun. 2018, 54, 13040–13059. [10] J. Karges, O. Blacque, P. Goldner, H. Chao, G. Gasser, Eur. J. Inorg. Chem. 2019, 2019,
3704–3712.
[11] J. Liu, C. Zhang, T.W. Rees, L. Ke, L. Ji, H. Chao, Coord. Chem. Rev. 2018, 363, 17–28. [12] J. Karges, S. Kuang, F. Maschietto, O. Blacque, I. Ciofini, H. Chao, G. Gasser, ChemRxiv
2020.
[13] R. Zhao, R. Hammitt, R.P. Thummel, Y. Liu, C. Turro, R.M. Snapka, Dalton Trans. 2009, 10926–10931.
[14] J. Karges, F. Heinemann, F. Maschietto, M. Patra, O. Blacque, I. Ciofini, B. Spingler, G. Gasser, Bioorg. Med. Chem. 2019, 27, 2666–2675.
[15] J. Karges, F. Heinemann, M. Jakubaszek, F. Maschietto, C. Subecz, M. Dotou, R. Vinck, O. Blacque, M. Tharaud, B. Goud, E. Viñuelas-Zahinos, B. Spingler, I. Ciofini, G. Gasser, J.
Am. Chem. Soc. 2020, 142, 6578–6587.
[16] J. Karges, P. Goldner, G. Gasser, Inorganics 2019, 7, 4.
[17] J. Karges, O. Blacque, M. Jakubaszek, B. Goud, P. Goldner, G. Gasser, J. Inorg. Biochem.
2019, 198, 110752–110760.
[18] J. Karges, T. Yempala, M. Tharaud, D. Gibson, G. Gasser, Angew. Chem. Int. Ed. 2020, 59, 7069–7075.
[19] S. Monro, K.L. Colón, H. Yin, J. Roque, P. Konda, S. Gujar, R.P. Thummel, L. Lilge, C.G. Cameron, S.A. McFarland, Chem. Rev. 2019, 119, 797–828.
[20] P. Gao, W. Pan, N. Li, B. Tang, ACS Appl. Mater. Interfaces 2019, 11, 26529–26558. [21] Y. Wen, C.L. Schreiber, B.D. Smith, Bioconjug. Chem. 2020, 31, 474–482.
[22] H. Huang, B. Yu, P. Zhang, J. Huang, Y. Chen, G. Gasser, L. Ji, H. Chao, Angew. Chem. Int.
Ed. 2015, 54, 14049–14052.
[23] J. Liu, Y. Chen, G. Li, P. Zhang, C. Jin, L. Zeng, L. Ji, H. Chao, Biomaterials 2015, 56, 140– 153.
[24] H. Huang, P. Zhang, B. Yu, C. Jin, L. Ji, H. Chao, Dalton Trans. 2015, 44, 17335–17345. [25] H. Yu, S. Huang, H. Chao, L. Ji, J. Inorg. Biochem. 2015, 149, 80–87.
[26] H. Deng, J. Li, K.C. Zheng, Y. Yang, H. Chao, L.N. Ji, Inorganica Chim. Acta 2005, 358, 3430–3440.
[27] L. Zeng, S. Kuang, G. Li, C. Jin, L. Ji, H. Chao, Chem. Commun. 2017, 53, 1977–1980. [28] J. Liu, X. Liao, K. Xiong, S. Kuang, C. Jin, L. Ji, H. Chao, Chem. Commun. 2020, Online
ahead of print.
[29] M.R. Gill, D. Cecchin, M.G. Walker, R.S. Mulla, G. Battaglia, C. Smythe, J.A. Thomas,
Chem. Sci. 2013, 4, 4512–4519.
23
[31] M.R. Gill, H. Derrat, C.G.W. Smythe, G. Battaglia, J.A. Thomas, ChemBioChem 2011, 12, 877–880.
[32] A. Ghosh, A. Mandoli, D.K. Kumar, N.S. Yadav, T. Ghosh, B. Jha, J.A. Thomas, A. Das,
Dalton Trans. 2009, 9312–9321.
[33] P.J. Jarman, F. Noakes, S. Fairbanks, K. Smitten, I.K. Griffiths, H.K. Saeed, J.A. Thomas, C. Smythe, J. Am. Chem. Soc. 2019, 141, 2925–2937.
[34] H.K. Saeed, P.J. Jarman, S. Archer, S. Sreedharan, I.Q. Saeed, L.K. Mckenzie, J.A. Weinstein, N.J. Buurma, C.G.W. Smythe, J.A. Thomas, Angew. Chem. Int. Ed. 2017, 56, 12628–12633.
[35] V. Ramu, S. Aute, N. Taye, R. Guha, M.G. Walker, D. Mogare, A. Parulekar, J.A. Thomas, S. Chattopadhyay, A. Das, Dalton Trans. 2017, 46, 6634–6644.
[36] A. Raza, S.A. Archer, S.D. Fairbanks, K.L. Smitten, S.W. Botchway, J.A. Thomas, S. MacNeil, J.W. Haycock, J. Am. Chem. Soc. 2020, 142, 4639–4647.
[37] S.A. Archer, A. Raza, F. Dröge, C. Robertson, A.J. Auty, D. Chekulaev, J.A. Weinstein, T. Keane, A.J.H.M. Meijer, J.W. Haycock, S. MacNeil, J.A. Thomas, Chem. Sci. 2019, 10, 3502–3513.
[38] E. Wachter, D.K. Heidary, B.S. Howerton, S. Parkin, E.C. Glazer, Chem. Commun. 2012,
48, 9649–9651.
[39] P.J. Dyson, G. Sava, Dalton Trans. 2006, 1929–1933.
[40] G. Li, L. Sun, L. Ji, H. Chao, Dalton Trans. 2016, 45, 13261–13276.
[41] J. Hess, H. Huang, A. Kaiser, V. Pierroz, O. Blacque, H. Chao, G. Gasser, Chem. – Eur. J.
2017, 23, 9888–9896.
[42] H. Yu, J. Liu, Z. Hao, J. He, M. Sun, S. Hu, L. Yu, H. Chao, Dyes Pigments 2017, 136, 416– 426.
[43] M.G. Walker, V. Gonzalez, E. Chekmeneva, J.A. Thomas, Angew. Chem. Int. Ed. 2012, 51, 12107–12110.
[44] S.P. Foxon, C. Green, M.G. Walker, A. Wragg, H. Adams, J.A. Weinstein, S.C. Parker, A.J.H.M. Meijer, J.A. Thomas, Inorg. Chem. 2012, 51, 463–471.
[45] P. Waywell, V. Gonzalez, M.R. Gill, H. Adams, A.J.H.M. Meijer, M.P. Williamson, J.A. Thomas, Chem. - Eur. J. 2010, 16, 2407–2417.
[46] S.P. Foxon, T. Phillips, M.R. Gill, M. Towrie, A.W. Parker, M. Webb, J.A. Thomas, Angew.
Chem. Int. Ed. 2007, 46, 3686–3688.
[47] C. Rajput, R. Rutkaite, L. Swanson, I. Haq, J.A. Thomas, Chem. - Eur. J. 2006, 12, 4611– 4619.
[48] C. Metcalfe, H. Adams, I. Haq, J.A. Thomas, Chem. Commun. 2003, 1152–1153.
[49] S.D. Fairbanks, C.C. Robertson, F.R. Keene, J.A. Thomas, M.P. Williamson, J. Am. Chem.
Soc. 2019, 141, 4644–4652.
[50] S.P. Foxon, M.A.H. Alamiry, M.G. Walker, A.J.H.M. Meijer, I.V. Sazanovich, J.A. Weinstein, J.A. Thomas, J. Phys. Chem. A 2009, 113, 12754–12762.
[51] H.K. Saeed, S. Sreedharan, P.J. Jarman, S.A. Archer, S.D. Fairbanks, S.P. Foxon, A.J. Auty, D. Chekulaev, T. Keane, A.J.H.M. Meijer, J.A. Weinstein, C.G.W. Smythe, J. Bernardino de la Serna, J.A. Thomas, J. Am. Chem. Soc. 2020, 142, 1101–1111.
[52] M.R. Gill, J. Garcia-Lara, S.J. Foster, C. Smythe, G. Battaglia, J.A. Thomas, Nat. Chem.
2009, 1, 662–667.
[53] A. Ghosh, P. Das, M.R. Gill, P. Kar, M.G. Walker, J.A. Thomas, A. Das, Chem. - Eur. J.
2011, 17, 2089–2098.
[54] Y. Liu, R. Hammitt, D.A. Lutterman, L.E. Joyce, R.P. Thummel, C. Turro, Inorg. Chem.
2009, 48, 375–385.
[55] Y. Sun, S.N. Collins, L.E. Joyce, C. Turro, Inorg. Chem. 2010, 49, 4257–4262.
[56] Y. Liu, R. Hammitt, D.A. Lutterman, R.P. Thummel, C. Turro, Inorg. Chem. 2007, 46, 6011– 6021.
24
[57] Y. Sun, D.A. Lutterman, C. Turro, Inorg. Chem. 2008, 47, 6427–6434.
[58] B. Peña, A. David, C. Pavani, M.S. Baptista, J.-P. Pellois, C. Turro, K.R. Dunbar,
Organometallics 2014, 33, 1100–1103.
[59] Y. Sun, L.E. Joyce, N.M. Dickson, C. Turro, Chem. Commun. 2010, 46, 6759–6761.
[60] W. Chen, C. Turro, L.A. Friedman, J.K. Barton, N.J. Turro, J. Phys. Chem. B 1997, 101, 6995–7000.
[61] C. Turro, S.H. Bossmann, Y. Jenkins, J.K. Barton, N.J. Turro, J. Am. Chem. Soc. 1995, 117, 9026–9032.
[62] Y. Sun, L.E. Joyce, N.M. Dickson, C. Turro, Chem. Commun. 2010, 46, 2426–2428. [63] E. Wachter, B.S. Howerton, E.C. Hall, S. Parkin, E.C. Glazer, Chem Commun 2014, 50, 311–
313.
[64] E. Wachter, D. Moyá, S. Parkin, E.C. Glazer, Chem. - Eur. J. 2016, 22, 550–559.
[65] H. Yin, M. Stephenson, J. Gibson, E. Sampson, G. Shi, T. Sainuddin, S. Monro, S.A. McFarland, Inorg. Chem. 2014, 53, 4548–4559.
[66] C. Mari, V. Pierroz, R. Rubbiani, M. Patra, J. Hess, B. Spingler, L. Oehninger, J. Schur, I. Ott, L. Salassa, S. Ferrari, G. Gasser, Chem. - Eur. J. 2014, 20, 14421–14436.
[67] M. Hernandes, S.M. Cavalcanti, D.R. Moreira, W. de Azevedo Junior, A.C. Leite, Curr. Drug
Targets 2010, 11, 303–314.
[68] K. Qiu, J. Wang, C. Song, L. Wang, H. Zhu, H. Huang, J. Huang, H. Wang, L. Ji, H. Chao,
ACS Appl. Mater. Interfaces 2017, 9, 18482–18492.
[69] Y. Wen, C. Ouyang, Q.-W. Li, T.W. Rees, K. Qiu, L. Ji, H. Chao, Dalton Trans. 2020, Advance article.
[70] J. Leveque, B. Elias, C. Moucheron, A. Kirsch-De Mesmaeker, Inorg. Chem. 2005, 44, 393– 400.
[71] X. Liu, B. Testa, A. Fahr, Pharm. Res. 2011, 28, 962–977.
[72] N.J. Farrer, J.A. Woods, V.P. Munk, F.S. Mackay, P.J. Sadler, Chem. Res. Toxicol. 2010, 23, 413–421.
[73] A. Leonidova, V. Pierroz, R. Rubbiani, J. Heier, S. Ferrari, G. Gasser, Dalton Trans 2014,
43, 4287–4294.
[74] N. Ueberschaar, H.-M. Dahse, T. Bretschneider, C. Hertweck, Angew. Chem. Int. Ed. 2013,
52, 6185–6189.
[75] P. Ung, M. Clerc, H. Huang, K. Qiu, H. Chao, M. Seitz, B. Boyd, B. Graham, G. Gasser,
Inorg. Chem. 2017, 56, 7960–7974.
[76] B. Maity, M. Roy, B. Banik, R. Majumdar, R.R. Dighe, A.R. Chakravarty, Organometallics
2010, 29, 3632–3641.
[77] E. Delaey, F. van Laar, D. De Vos, A. Kamuhabwa, P. Jacobs, P. de Witte, J. Photochem.
Photobiol. B 2000, 55, 27–36.
[78] A.J. McConnell, M.H. Lim, E.D. Olmon, H. Song, E.E. Dervan, J.K. Barton, Inorg. Chem.
2012, 51, 12511–12520.
[79] B. Krishnakumar, R. Velmurugan, S. Jothivel, M. Swaminathan, Catal. Commun. 2010, 11, 997–1002.
![Figure 2. Structures of the Ru polypyridyl complexes TLD-1433 and [Ru(bpy) 2 dppz] 2+](https://thumb-eu.123doks.com/thumbv2/123doknet/7772258.257117/7.892.186.714.104.302/figure-structures-ru-polypyridyl-complexes-tld-ru-dppz.webp)