ScienceDirect
Available online at www.sciencedirect.com
Procedia Computer Science 170 (2020) 67–74
1877-0509 © 2020 The Authors. Published by Elsevier B.V.
This is an open access article under the CC BY-NC-ND license (http://creativecommons.org/licenses/by-nc-nd/4.0/) Peer-review under responsibility of the Conference Program Chairs.
10.1016/j.procs.2020.03.140
10.1016/j.procs.2020.03.140 1877-0509
© 2020 The Authors. Published by Elsevier B.V.
This is an open access article under the CC BY-NC-ND license (http://creativecommons.org/licenses/by-nc-nd/4.0/) Peer-review under responsibility of the Conference Program Chairs.
Procedia Computer Science 00 (2019) 000–000
www.elsevier.com/locate/procedia
The 11th International Conference on Ambient Systems, Networks and Technologies (ANT)
April 6 - 9, 2020, Warsaw, Poland
Activity Recognition in the City using Embedded Systems and
Anonymous Sensors
R. Baghezza
a,∗, K. Bouchard
a, A. Bouzouane
a, C. Gouin-Vallerand
baLIARA Laboratory (UQAC), Chicoutimi, G7H 2B1, Canada bSherbrooke University, QC J1K 2R1, Canada
Abstract
This paper presents an embedded system that performs activity recognition in the city. Arduino Due boards with infrared, distance and sound sensors are used to collect data in the city and the activity, profile, and group size recognition performance of different machine learning algorithms (RF, SVM, MLP) are compared. The features were extracted based on fixed-size windows around the observations. We show that it is possible to achieve a high accuracy for binary activity recognition with simple features, and we discuss the optimization of different parameters such as the sensors collection frequency, and the storage buffer size. We highlight the challenges of activity recognition using anonymous sensors in the environment, its possible applications and advantages compared to classical smartphone and wearable based approaches, as well as the improvements that will be made in future versions of this system. This work is a first step towards real-time online activity recognition in smart cities, with the long-term goal of monitoring and offering extended assistance for semi-autonomous people.
c
2020 The Authors. Published by Elsevier B.V.
This is an open access article under the CC BY-NC-ND license (http://creativecommons.org/licenses/by-nc-nd/4.0/) Peer-review under responsibility of the Conference Program Chairs.
Keywords: Activity Recognition; Smart City; Machine Learning; Anonymous Data; Healthcare; Embedded Systems
1. Introduction
Activity recognition has been an area of interest for the past decades because of its various applications such as healthcare[1], surveillance[2], fitness[3], and many more. For healthcare in particular, smart homes have been used to monitor patients’ activities, in order to reduce the cost of human resources to assist people suffering from dementia[4]. Smart homes relying on a set of sensors and clustering methods to detect abnormalities, as well as recurrent neural networks to predict them have been presented by Lofti et al.[5]. Over the years, more emphasis has been put on the actual Wireless Sensor Networks used in these environments, and how to find cheap hardware and
∗Corresponding author. Tel.: +1-581-447-1613
E-mail address: [email protected]
1877-0509 c 2020 The Authors. Published by Elsevier B.V.
This is an open access article under the CC BY-NC-ND license (http://creativecommons.org/licenses/by-nc-nd/4.0/) Peer-review under responsibility of the Conference Program Chairs.
Available online at www.sciencedirect.com
Procedia Computer Science 00 (2019) 000–000
www.elsevier.com/locate/procedia
The 11th International Conference on Ambient Systems, Networks and Technologies (ANT)
April 6 - 9, 2020, Warsaw, Poland
Activity Recognition in the City using Embedded Systems and
Anonymous Sensors
R. Baghezza
a,∗, K. Bouchard
a, A. Bouzouane
a, C. Gouin-Vallerand
baLIARA Laboratory (UQAC), Chicoutimi, G7H 2B1, Canada bSherbrooke University, QC J1K 2R1, Canada
Abstract
This paper presents an embedded system that performs activity recognition in the city. Arduino Due boards with infrared, distance and sound sensors are used to collect data in the city and the activity, profile, and group size recognition performance of different machine learning algorithms (RF, SVM, MLP) are compared. The features were extracted based on fixed-size windows around the observations. We show that it is possible to achieve a high accuracy for binary activity recognition with simple features, and we discuss the optimization of different parameters such as the sensors collection frequency, and the storage buffer size. We highlight the challenges of activity recognition using anonymous sensors in the environment, its possible applications and advantages compared to classical smartphone and wearable based approaches, as well as the improvements that will be made in future versions of this system. This work is a first step towards real-time online activity recognition in smart cities, with the long-term goal of monitoring and offering extended assistance for semi-autonomous people.
c
2020 The Authors. Published by Elsevier B.V.
This is an open access article under the CC BY-NC-ND license (http://creativecommons.org/licenses/by-nc-nd/4.0/) Peer-review under responsibility of the Conference Program Chairs.
Keywords: Activity Recognition; Smart City; Machine Learning; Anonymous Data; Healthcare; Embedded Systems
1. Introduction
Activity recognition has been an area of interest for the past decades because of its various applications such as healthcare[1], surveillance[2], fitness[3], and many more. For healthcare in particular, smart homes have been used to monitor patients’ activities, in order to reduce the cost of human resources to assist people suffering from dementia[4]. Smart homes relying on a set of sensors and clustering methods to detect abnormalities, as well as recurrent neural networks to predict them have been presented by Lofti et al.[5]. Over the years, more emphasis has been put on the actual Wireless Sensor Networks used in these environments, and how to find cheap hardware and
∗ Corresponding author. Tel.: +1-581-447-1613
E-mail address: [email protected]
1877-0509 c 2020 The Authors. Published by Elsevier B.V.
This is an open access article under the CC BY-NC-ND license (http://creativecommons.org/licenses/by-nc-nd/4.0/) Peer-review under responsibility of the Conference Program Chairs.
an architecture yielding good activity recognition results[6]. Other recent approaches have considered using spatial reasoning to recognize a resident’s activities of daily living[7].
The vast majority of assisted living approaches focus on recognizing activites inside a smart home to provide assistance to the resident. The main idea we explore in this paper is to extend this vision to smart cities. What if we could extend this assistance and monitoring beyond the closed universe of a semi-autonomous person’s home? Using ambient sensors in the environment, we want to tackle the problem of activity recognition in the city from a new perspective. Cook at al. have presented a survey exploring possibilities for smarter healthcare in smart cities using machine learning, mobile and ambient sensors[8], which is in accordance with our perspective on the matter, with the addition of smartphones that we chose to exclude for a fully external and non-invasive approach. In this paper, we present a live experiment in which we have used anonymous sensors in the city to recognize pedestrians’ activities and profiles. Indeed extending activity recognition outside of one’s home raises privacy issues, and it becomes necessary to use sensor that cannot identify any of the subjects of the experiment. This is the first step to-wards a more powerful system that we aim to build, which is described in further details in the last section of this paper. The next section presents a quick survey of activity recognition techniques that have been used outside of smart homes. In the third section, we describe the hardware that was used as well as the experiment setup. In the fourth section, we describe the methods we have used to optimize the sensors collection frequencies, and the features we have extracted from the data. In the fifth section, we present and analyze the results obtained with RF, SVM and MLP for activity and profile recognition, as well as group size estimation. In the final section we discuss the challenges that will have to be faced to improve the system, and our future plans.
2. Related work
Most activity recognition methods outside of smart homes rely on smartphones or wearable devices[9]. The most straightforward approach has been to use smartphone sensors to collect data, and to perform activity recognition offline. Siirtola et al. have shown that using accelerometers, results were user and body-position independent for simple activities such as walking, running, cycling and driving a car[10]. They have used a decision tree with sliding windows, and have also achieved a high accuracy for online activity recognition directly on the device. Kose et al. have compared different models for online activity recognition using smartphone sensors, such as Naive Bayes and a clustered KNN[11]. They have shown that KNN performed well for online activity recognition, both in terms of accuracy, CPU and memory usage. Smartphone sensors have also been used in a healthcare context for fall detection by Zhao et al.[12]. A very high fall recognition accuracy has been achieved using decision trees once again. Boukhechba et al. have used smartphone’s raw GPS data to perform online activity recognition[13]. In a comprehensive survey, Su et al. have identified the main challenges for activity recognition using smartphones, such as subject and location sensitivity, spotting transitions between activities, dealing with insufficient training data to properly generalize models, and all the underlying energy and resource constraints[14]. One of the additional drawbacks of using smartphones for activity recognition is that an application has to be installed on the user’s phone, which can be seen as quite invasive and is not easily done for large populations of subjects. The position of the device itself can affect the activity recognition results as well[15].
With embedded systems becoming more efficient, and sensors becoming smaller, wearable devices have been used more in the past decades to perform activity recognition. Sztyler et al. have used a set of wearable sensors placed on the head, chest, upper arm, waist, forearm, thigh and shin to perform activity recognition[16]. They focused on generaliz-ing results from one subject to other subjects. Even though such a system performs well, it would be difficult to apply it to everyday life to monitor semi-autonomous people in the city, as it is quite bulky and invasive. Lara et al. have presented a survey about the challenges in activity recognition using wearable sensors, such as dealing with composite and overlapping activities, building flexible classifiers, and predicting future activities[17]. One of the main issues is the very limited datasets, as each experiment comes with a specific dataset and it is difficult to build very efficient generalized classifiers. By adpoting an external approach for activity recognition, we want to see what is achievable
and how well such a system could perform without the drawbacks of smartphone and wearable sensors based methods.
3. Experimental setup
With this experiment, we explore the performance of activity and profile recognition in the city using an external system with fully anonymous data. At this stage of the project, we collect the data first and perform activity recognition offline. Our end goal is to eventually perform real time distributed activity recognition directly on the nodes.
3.1. Hardware
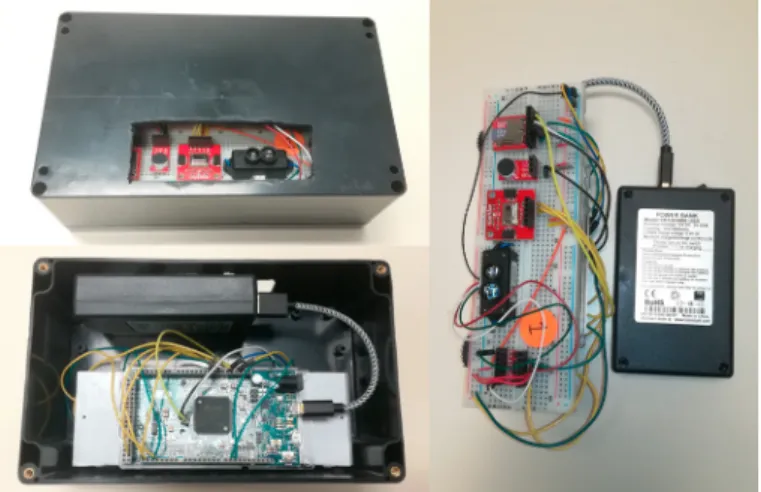
We ran the experiment using 4 Arduino Due boards because of their superior processing power, memory, and number of I/O pins compared to other Arduino devices. Each board is equipped with 3 different sensors to collect data, namely a Grid-EYE sensor, a LiDaR sensor and a small microphone. Each board is also equipped with a micro-SD card reader with a micro-SD card to store the data collected during the experiment. We then fit each board into a hard plastic box, with a rectangular hole cut in it (??), so the sensors could pick up data from the environment. Each node is powered by a 3000mAh power bank.
Fig. 1:Picture of one of the 4 nodes used in the experiment.
3.2. Sensors
We have used an Electret Microphone breakout board with an added amplifier (OPA344). It records the sound amplitude variations it picks up over a certain period of time and outputs a simple integer value of the difference between the lowest and highest peaks over that duration. We have also used a TFMini Micro LiDaR sensor that measures the distance to the object its laser reflects off of, as well as a value for the strength of the signal. Finally, we have used a Grid-EYE Infrared Array Breakout (AMG8833), which is a passive infrared array sensor that outputs a 64 square matrix with an individual temperature values for each cell. The granularity of the readings is 0.25◦C. In
order to save memory, we have converted the float values given by the Grid-EYE to integer values where a jump in 0.25◦C corresponds to a jump of 1 in integer value. This saves 2 bytes per recording, and doesn’t affect the results as
3.3. Experiment setup
The boxes are set 1m apart from each other, on a ledge next to the sidewalk, with the sensors facing the same direction to observe people as they walk by. The observer sits on a bench nearby, from a position where he can see the whole scene, and he uses a custom made application on an Android tablet to collect the observations that constitute the ground truth to label the data. As soon as a pedestrian walks by, the observer fills in the form, picking the right options in several fields: gender (male, female), group size (1, 2, 3+), activity (walking, talking, biking, using a wheelchair) and profile (adult, child, elderly), and finally, selecting the node where the observation happens.
At the time of saving each observation, a timestamp is saved by the application. Each Arduino board has a local clock that starts running as soon as it is powered on. At the beginning of the experiment, we record an initial observation for each node while covering all sensors for a few seconds. That starting point allows us to sync up all subsequent observations. In future prototypes, Bluetooth Low Energy will be used so that the app and boards can communicate and synchronize their clocks at the beginning of the experiment with a much higher precision. A total of 576 observations were recorded (144 similar for each node) over the course of two hours. Subsequent experiments using the new system described in the last section will last longer in order to collect more data as this sample size doesn’t allow for a sufficient representation of some classes. Because of the setup of the experiment, we cannot guarantee a 100% accuracy on the observations:
• When two people walk in two opposite directions at the same time, we can only track one at a time. We lose a potential observation, and there is added noise because of the second person’s movement being picked up by the sensors.
• Mistakes can be made when filling up the form, especially when high traffic is experienced.
• Some observation were missed, especially for bikes when they were just going too fast to be picked up Despite these difficulties, the observations were quite accurate. A few improvements will be made in the following experiments, such as finding the optimal distance between nodes, as well as the best height and orientation.
4. Data collection and feauture extraction
4.1. Sampling frequency optimization
The Arduino being a mono-thread system, one of the first considerations was to find a way to collect data from each sensor, as well as storing that data periodically in a way that would lead to the least amount of data loss. That means we had to optimize the following parameters: Grid-EYE, LiDar and microphone recording frequencies, microphone recording interval and the storage buffer size for each sensor. Because of the limited memory of the system (96KB), we have to dump the collected data on the SD card periodically so we don’t lose any. However, when the Arduino is busy writing data to the SD card, sensors cannot collect data. The writing time itself is negligible compared to the time to access the SD card, which led us to increase the buffer size, in order to decrease the amount of calls to the SD card storage methods.
The next step was to optimize the sensor frequencies so that we could collect enough of each type of data. Naturally, we wanted the microphone to have a higher frequency, to be able to pick up more subtle sound variations. However, going too high in frequency also meant that more data was stored, and that the storage methods would be called more often. We also did not want to have the microphone data over-represented, and miss out on valuable LiDaR and Grid-EYE data.
For frequencies ranging from 10 to 500Hz for the microphone, and 5 to 50Hz for the LiDaR and Grid-EYE, we ran many tests and computed the data loss, coverage, and the average LiDaR and Grid-EYE coverage to microphone
coverage ratio (LGM ratio). The data loss is obtained simply by comparing the theoritical number of recordings we should have based on the frequency to the actual recorded instances that were successfully stored. The coverage is a measure of the portion of time each sensors spends recording the environment. Even though a recording is instantaneous in real life, we assume that each recording, whatever the sensor is, lasts 1ms, so we can compute the coverage. Finally, the LGM ratio is simply the average of the Grid-EYE and LiDaR coverage divided by the microphone coverage. That gives us an idea of the over or under-representation of the microphone data compared to the other sensors. It was not possible to define an optimal value for LGM, as we didn’t know which sensor would yield the most useful features, but our main goals were to reduce data loss, achieve high coverage, while keeping LGM high enough. 0 50 100 150 200 0 2 4 6 8 Period (ms) Co verage (%) Mic coverage LiDaR/Grid-EYE coverage Average coverage LGM ratio
Fig. 2:Time coverage of the sensors as a function of Grid-EYE/LiDaR period (mic period = 10ms)
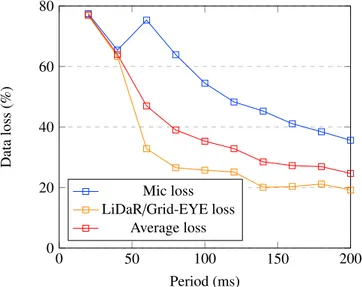
0 50 100 150 200 0 20 40 60 80 Period (ms) Data loss (%) Mic loss LiDaR/Grid-EYE loss Average loss
Fig. 3:Data loss of the sensors as a function of Grid-EYE/LiDaR period (mic period = 10ms)
Both graphs above represent the coverage and data loss of the sensors when the microphone’s frequency is set to 100Hz. It is easy to see on the first graph (??) that as the period of the LiDaR/Grid-EYE increases (decrease in
frequency), the mic coverage and average coverage increase, but the LGM ratio decreases. It is simply explained by the fact that less LiDaR and Grid-EYE data is collected, leading to the storage methods being called less often, and more microphone data being stored, bringing the coverage up and ratio down since its frequency is far superior. Similarly, the data loss (??) decreases as we store less Grid-EYE and LiDaR data, but the microphone is over-represented.
We found the optimal frequencies to be around 100Hz for the microphone, and 10Hz for the Grid-EYE and LiDaR. We set the Grid-EYE and LiDaR to have the same frequency so we could match one infrared matrix recording with one distance recording. Unfortunately, most of the data collected by the LiDaR turned out to be unusable. Without a wall or a surface close enough to reflect the signal while no one was walking by, the LiDaR couldn’t calibrate quickly enough to catch the signal of the pedestrians.
4.2. Features and classes
For each node, the data is stored in a separate text file. The observation application stores all the information in a text file stored on the tablet. Using the first window of observation, we were able to synchronize each node’s data with the subsequent observations. We then paired each observation with the right node, and computed a feature vector using this node’s data from a fixed sized window around the time of the observation. The following 76 features are computed:
• Microphone average, low value, high value, and difference between low and high values. • LiDaR average, low value, high value and difference between low and high values.
• Grid-EYE average over all 64 values, lowest average, highest average, and difference between low and high values, as well as the average for each individual cell.
We performed most of the analysis around activity and profile recognition, but also wanted to see if we could estimate pedestrian group sizes. We had to face the issue of class imbalance as there were much more people simply walking than performing any other activity, and many more adults than elders. We created balanced datasets for each case. 5. Results
As a first approach, we have decided to compare 3 basic machine learning models for each classification operation: Support Vector Machine (SVM), Random Forest (RF) and Multi-Layer Perceptron (MLP). We compare the accuracy and Cohen’s Kappa for each model. We performed binary classification for a few different targets: activity (presence or absence of activity based on the data), group size (single person vs two or more people), talking activity vs all other activities. As far as multiclass classification, we trained the models to recognize activities (walking, talking, biking, moving in a wheelchair) and profiles (adult, child, elder).
We used 50 estimators and 10-fold cross validation for the Random Forest, a RBF or a polynomial kernel for the SVM, depending on which one yielded the best results, and a MLP with a single hidden layer with 20 units. All training and testing was performed using Weka[18].
Table 1:Accuracy and kappa values formulticlass classification tasks for RF, SVM and MLP
RF SVM MLP
Activity Accuracy (%) 58.65 64.86 76.58
Kappa 0.21 0.40 0.60
Profile Accuracy (%) 63.68 79.09 75.45
R. Baghezza, K. Bouchard, A. Bouzouane, C. Gouin-Vallerand / Procedia Computer Science 00 (2019) 000–000 7 Table 2:Accuracy and kappa values forbinary classification tasks for RF, SVM and MLP
RF SVM MLP
Activity Accuracy (%) 86.01 94.17 81.12
Kappa 0.72 0.88 0.62
Group Size Accuracy (%) 59.25 54.01 55.66
Kappa 0.17 0.08 0.11
Talking vs All Accuracy (%) 54.67 57.66 66.42
Kappa 0.09 0.15 0.33
The most important and encouraging result is the accuracy of the SVM for binary activity detection (1). In this case, we have picked feature vectors at random, representing the absence of activity (no observation linked to that specific time frame), and we have compared them to feature vectors built on data captured in a fixed window around the observations timestamp. Using data combined for all 4 nodes, and adding the same quantity of ”no activity” vectors, we have obtained an accuracy of 94.17% for the SVM, with a Kappa value of 0.88. It has to be noted that because of ambient noise, environmental factors, missed observations, there is a probability that some no activity vectors actually represent a pedestrian walking by. A more careful selection of these vectors could lead to even better results. The RF also gives very encouraging results, 86.01% with a Kappa of 0.72.
All three algorithms have trouble estimating the group size, especially considering the low value of Kappa. Many factors can affect group size recognition, such as the cohesion of the group: if people are walking quite far apart, they could also be considered 3 different single person observations, and the distance between the nodes might make it difficult to record all of them quickly enough. In the current version of the system, all nodes features are independent, and it would most likely take more correlations between different nodes to be able to estimate a group size. When it comes to telling the talking activity apart from other activities (2), MLP performs the best, even if the value of Kappa is still a bit low. This is easily understandable because of the basic microphone features being used. It would most likely take more carefully engineered features, as well as a higher frequency to find specific patterns in the sound data to precisely pinpoint when pedestrians are talking. The microphone used is also very basic, and noise pollution in the city makes sound collection even more difficult. Other parameters such as the height of the nodes and the orientation of the sensors have a huge impact on the quality of collected data. Pedestrians have different heights, and it is impossible to aim the microphone directly at their head to be able to pick up the sound of their voice.
Multi-class classification results are quite encouraging, showing relatively high accuracies and Kappa values, with the MLP performing better for activity recognition, and the SVM for profile recognition. It is important to remember that these results have been obtained using basic, raw features from sensors, using fixed-size windows around activity times, without any feature engineering or advanced feature extraction techniques. The sample size was quite small as well, with only 144 similar examples per node, in a highly noisy environment. We expect to observe substantial performance in future versions of the system. Another parameter to take into account is the class distribution: there are way more adults than elders in the data, which is to be expected for a live experiment. This is a common problem in the field: the populations we are the most interested in are the hardest to collect data for.
6. Conclusion
As a first step towards non user-centered profile and activity recognition, the results obtained so far are encourag-ing. Lots of improvements will be made about feature extraction and algorithm selection and tuning, which should yield even better results. Based on the results we obtained, future prototypes will be built using more powerful boards than the Arduino Due. Indeed, if we want to exploit sound as a reliable source of information, the microphone frequency needs to be at least 44100 Hz, and it is simply not achievable without a huge amount of data loss on a single core board. We will also look into building custom nodes using different sensors, and focus on the communication, distribution, and real-time aspects of the system to achieve our final goal which is online real time distributed activity
recognition. Many challenges have to be faced, such as the limited memory and processing power of the boards, and the importance of scheduling collection, storage and communication tasks for each node in order to create an efficient and accurate system. It will be necessary to implement an economical communication protocol to allow the nodes to share information. We also want the system to be powered for several hours in order to collect more data than we did during the first experiment, and we are considering using small solar panels to help power the system. This project is a first step towards city-based activity recognition to provide assistance and monitoring for elders and semi-autonomous individuals, capitalizing on pervasive computing, embedded systems and data mining for activity recognition. Such a system could be used beyond the scope of healthcare, and provide valuable information for a smart city, such as real-time pedestrian traffic information, discovery of new points of interest and their associated populations profiles, estimation of population density in an emergency situation, and many other applications. The most attractive factor of such a system is anonymity: the system is able to collect real-time information without ever linking any of the knowledge to a specific person. Efficient algorithms would also make it possible to run the system on cheap boards, with cheap sensors, making it very cost-effective.
References
[1] A. Avci, S. Bosch, M. Marin-Perianu, R. Marin-Perianu, and P. Havinga, “Activity Recognition Using Inertial Sensing for Healthcare, Well-being and Sports Applications: A Survey Human Activity Recognition Using Smartphones View project EuroSSC2008 View project Activity Recognition Using Inertial Sensing for Healthcare, Wellbein,” 23th International Conference on Architecture of Computing Systems, ARCS 2010, 2010.
[2] S. Vishwakarma and A. Agrawal, “A survey on activity recognition and behavior understanding in video surveillance,” Visual Computer, vol. 29, no. 10, pp. 983–1009, 2013.
[3] K. M. Diaz, D. J. Krupka, M. J. Chang, J. Peacock, Y. Ma, J. Goldsmith, J. E. Schwartz, and K. W. Davidson, “Fitbit : An accurate andR reliable device for wireless physical activity tracking,” International Journal of Cardiology, vol. 185, pp. 138–140, 2015.
[4] J. Gaugler, B. James, T. Johnson, K. Scholz, and J. Weuve, “2016 Alzheimer’s disease facts and figures,” Alzheimer’s and Dementia, vol. 12, no. 4, pp. 459–509, 2016.
[5] A. Lotfi, C. Langensiepen, S. M. Mahmoud, and M. J. Akhlaghinia, “Smart homes for the elderly dementia sufferers: Identification and prediction of abnormal behaviour,” Journal of Ambient Intelligence and Humanized Computing, vol. 3, no. 3, pp. 205–218, 2012.
[6] R. S. Ransing and M. Rajput, “Smart home for elderly care, based on wireless sensor network,” 2015 International Conference on Nascent Technologies in the Engineering Field, ICNTE 2015 - Proceedings, 2015.
[7] K. Bouchard, B. Bouchard, and A. Bouzouane, “A new qualitative spatial recognition model based on Egenhofer topological approach using C4.5 algorithm: Experiment and results,” Procedia Computer Science, vol. 5, pp. 497–504, 2011.
[8] D. J. Cook, G. Duncan, G. Sprint, and R. L. Fritz, “Using Smart City Technology to Make Healthcare Smarter,” Proceedings of the IEEE, vol. 106, no. 4, pp. 708–722, 2018.
[9] L. Chen and C. D. Nugent, Human Activity Recognition and Behaviour Analysis. 2019.
[10] P. Siirtola and J. Roning, “Ready-to-use activity recognition for smartphones,” Proceedings of the 2013 IEEE Symposium on Computational Intelligence and Data Mining, CIDM 2013 - 2013 IEEE Symposium Series on Computational Intelligence, SSCI 2013, pp. 59–64, 2013. [11] M. Kose, O. D. Incel, and C. Ersoy, “Online Human Activity Recognition on Smart Phones,” Performance Evaluation, pp. 0–4, 2012. [12] Z. Zhao, Y. Chen, S. Wang, and Z. Chen, “FallAlarm: Smart phone based fall detecting and positioning system,” Procedia Computer Science,
vol. 10, pp. 617–624, 2012.
[13] M. Boukhechba, A. Bouzouane, B. Bouchard, C. Gouin-Vallerand, and S. Giroux, “Online recognition of people’s activities from raw GPS data: Semantic trajectory data analysis,” 8th ACM International Conference on PErvasive Technologies Related to Assistive Environments, PETRA 2015 - Proceedings, 2015.
[14] X. Su, H. Tong, and P. Ji, “Activity recognition with smartphone sensors,” Tsinghua Science and Technology, vol. 19, no. 3, pp. 235–249, 2014. [15] T. Sztyler and H. Stuckenschmidt, “On-body localization of wearable devices: An investigation of position-aware activity recognition,” 2016
IEEE International Conference on Pervasive Computing and Communications, PerCom 2016, 2016.
[16] T. Sztyler and H. Stuckenschmidt, “Online personalization of cross-subjects based activity recognition models on wearable devices,” 2017 IEEE International Conference on Pervasive Computing and Communications, PerCom 2017, pp. 180–189, 2017.
[17] Oscar D. Lara and M. A. Labrador, “A Survey on Human Activity Recognition using Wearable Sensors,” IEEE COMMUNICATIONS SURVEYS &TUTORIALS, vol. 15, pp. 1192–1209, 2013.
[18] M. Hall, E. Frank, G. Holmes, B. Pfahringer, P. Reutemann, and I. H. Witten, “The WEKA data mining software: An update,” ACM SIGKDD Explorations Newsletter, vol. 11, no. 1, pp. 10–18, 2009.