HAL Id: hal-01008668
https://hal.archives-ouvertes.fr/hal-01008668
Submitted on 16 Apr 2018HAL is a multi-disciplinary open access archive for the deposit and dissemination of sci-entific research documents, whether they are pub-lished or not. The documents may come from teaching and research institutions in France or abroad, or from public or private research centers.
L’archive ouverte pluridisciplinaire HAL, est destinée au dépôt et à la diffusion de documents scientifiques de niveau recherche, publiés ou non, émanant des établissements d’enseignement et de recherche français ou étrangers, des laboratoires publics ou privés.
Practical experience of bender-extender elements
Christophe Dano
To cite this version:
Christophe Dano. Practical experience of bender-extender elements. Workshop on Current Practises of the use of bender elements technique, 2003, Lyon, France. �hal-01008668�
PRACTICAL EXPERIENCE OF BENDER - EXTENDER ELEMENTS Christophe Dano1
ABSTRACT
This paper deals with a rather short practical experience of the use of bender elements (2000 – 2002) and since 2002, of bender – extender elements at the Research Institute in Civil and Mechanical Engineering (GéM). The bender – extender elements are piezo-ceramics transducers set up into a conventional triaxial cell. These new transducers allow one to transmit and receive both P-waves and S-waves with the same couple of elements. This new technique is applied to a dense dry Loire River sand along isotropic stress paths.
BENDER-EXTENDER ELEMENTS
Since their appearance at the end of the 70’s (Shirley & Hampton, 1978), bender elements have become an usual geotechnical testing device. Bender elements are piezo-ceramics transducers which could be embedded into different laboratory apparatus such as triaxial cells (see for instance Dyvik & Madhus, 1986 ; Brignoli et al., 1996 ; Kuwano et al., 1999 ; Lo Presti et al., 1999 ; Dano & Hicher, 2002), oedometer cells (Dyvik & Olsen, 1989)…These transducers transmit and receive shear waves (also noted S-waves). The wave propagation causes very small strains (ε≤ 0.001 %) and enables the determination of the shear modulus Gmax in the small strain domain (Viggiani & Atkinson, 1995 ; Dano & Hicher, 2002). A review of the bender elements technique can be found in the paper by Brignoli et al. (1996).
Independent compression waves transducers (P-waves) were sometimes associated with bender elements in order to identify another parameter of the Hooke’s law, either the Young’s modulus Emax or the Poisson’s ratio ν (Brignoli et al., 1996).
However, the simultaneous use of compression wave transducers and shear wave transducers has not been extensively developed until now. In order to remedy this inconvenience, Lings & Greening (2001) described a new transducer called bender-extender element. An unique couple of such bender-extender elements can transmit and receive both P-waves and S-waves : this property results from a slight modification of bender elements.. Therefore, these elements can be used to easily identify the Young’s modulus E and the shear modulus G in the small strain domain
2
changed by the introduction of the bender-extender elements embedded into the lower and upper pedestals of a conventional triaxial cell.
The principle of bender-extender elements is straightforward. The transmitter is excited by an electric signal : the new user-friendly system allows the experimenter to choose between a square signal, a sinusoidal signal or an user-defined signal. The input signal induces longitudinal (for P-waves) or tangential vibrations (for S-waves) which are propagated through the sample. The receiver is then submitted to longitudinal or tangential displacements which are inversely converted into an output electric signal. The input and output electric signals are recorded on the PC for a subsequent analysis. It has to be noted that the displacement amplitude in extension is about one order of magnitude smaller than the bending displacement (Lings & Greening, 2001). This can explain the fact that the P-waves output signals are sometimes more difficult to interpret than the S-waves output signals.
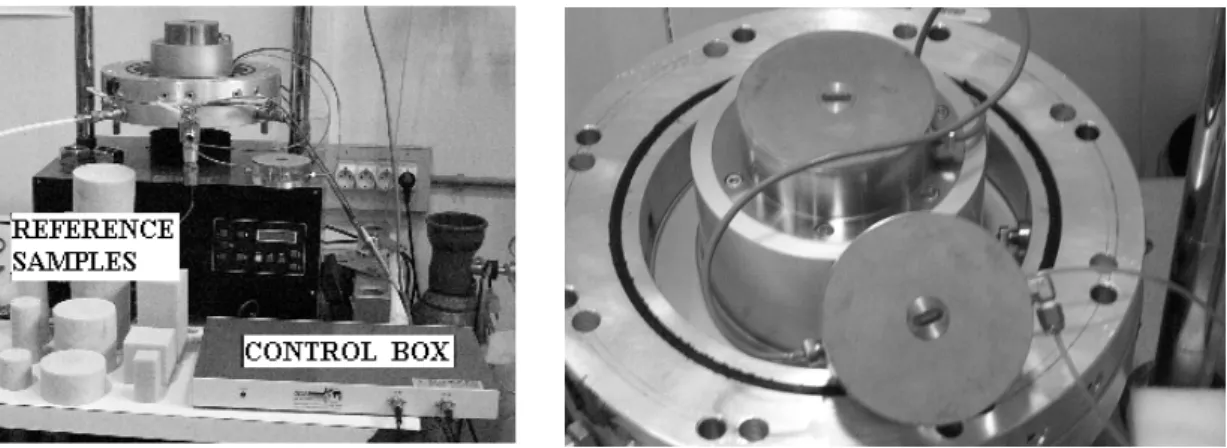
FIG. 1. Bender-Extender elements into the triaxial cell.
PHYSICAL PROPERTIES OF LOIRE RIVER SAND
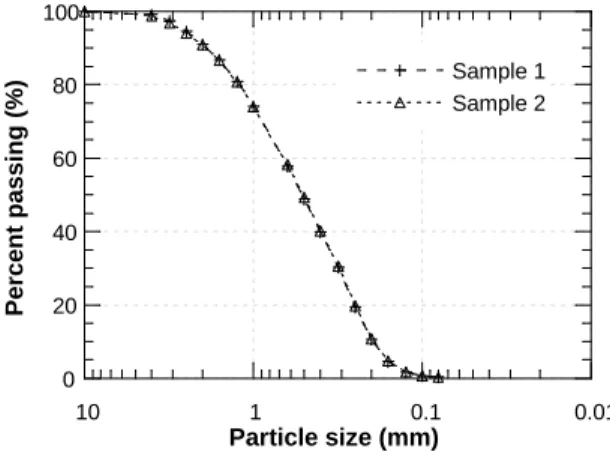
The Loire River sand consists of recent alluvial deposits of the Loire River, close to its mouth in the west part of France. It is composed of sub-rounded particles and elongated shell fragments. The grading curves obtained on two samples are represented in Fig. 2. The mean grain size D50 is 520 µm. The coefficient of uniformity Cu is equal to 3.5. The coefficient of curvature Cc is equal to 0.8. Therefore, the Loire River sand is a poorly graded sand (ASTM D2487-93).
The specific weight γs of the Loire River sand grains is 26.2 kN/m 3
(ASTM D854-92). The minimum unit weight γmin (ASTM D4254-91) and the maximum unit weight γmax (ASTM D4253-93) are respectively equal to 15.1 kN/m3 (emax = 0.738) and 18.5 kN/m3 (emin = 0.415).
0 20 40 60 80 100 0.01 0.1 1 10 Sample 1 Sample 2 P e rc e n t p a s s in g ( % ) Particle size (mm)
FIG. 2. Grading curves of the Loire sand.
SMALL STRAIN BEHAVIOR OF LOIRE RIVER SAND
As previously stated by many authors (Iwasaki & Tatsuoka, 1977 ; Hicher, 1996), the tangent modulus E greatly underestimates the value of the Young’s modulus because of the inaccuracy of conventional triaxial tests (Scholey et al., 1995). In the small strain domain (ε≤ 0.001 %), it is well-known that the Young’s modulus Emax and the shear modulus Gmax follow power laws such as (Hardin & Richart, 1963 ; Iwasaki & Tatsuoka, 1977 ; Hicher, 1996) :
E n E max p' e k E = × (1) 0 200 400 600 800 1000 1200 1400 0 2 4 6 8 10 12 D e v ia to r s tr e s s q (k P a ) Axial strain ε 1 (%) 100a 100b 200a 200b 400a 400b
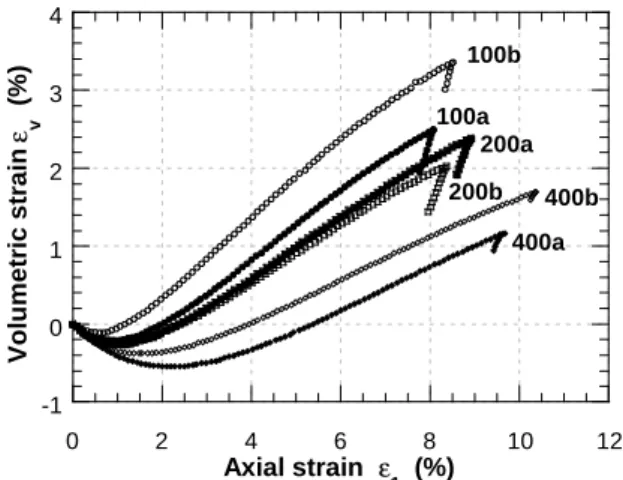
4 -1 0 1 2 3 4 0 2 4 6 8 10 12 V o lu m e tr ic s tr a in ε v (% ) Axial strain ε 1 (%) 100a 100b 200a 200b 400a 400b
FIG. 3. Large strain triaxial tests results.
TABLE 1. Parameters of the elastic perfectly plastic model. Test
reference
σ’c e0 E ν ψ c’ ϕ’p ϕ’res
kN/m2 MN/m2 degrees kN/m2 degrees degrees
100a 100 0.51 93 0.22 10.7 0 39.2 33.9 100b 100 0.48 97 0.27 12.4 200a 200 0.52 126 0.25 9.3 200b 200 0.48 118 0.23 8.9 400a 400 0.49 140 0.24 7.2 400b 400 0.50 146 0.21 6.9 G n G max p' e k G = × (2)
where e is the void ratio ; p’ is the mean effective stress (in kN/m²) ; kE, kG, nE and nG are constant values experimentally determined. If Emax and Gmax are expressed in MN/m², then kE is between 10 and 25 and kG is usually between 4 and 10 (Hardin & Richart, 1963 ; Iwasaki & Tatsuoka, 1977 ; Hicher, 1996 ; Dano & Hicher, 2002). The coefficients nE and nG are close to 0.5. Wave propagation tests on the Loire River sand were performed in order to establish similar equations for the Young’s modulus Ev,max and the shear modulus Gvh,max where the subscript “v” means that the wave are vertically propagated and the subscript “h” means that the shear wave is horizontally polarized (Kuwano et al., 1999).
Small strain experiments were carried out on a dry Loire River Sand in order to obtain a clear output signal for the P-waves (greatly affected by the aqueous phase). The sand was deposited by five successive layers. Each of them was compacted by tamping. The dry unit weight was then close to 17.5 kN/m3. A vacuum of 30 kN/m² was applied to the specimen during set-up within the
cell. The vacuum was released and the specimen opened to the atmosphere during the application of a cell pressure σ’c of 50 kN/m². Volume changes are determined by means of the external displacement gauge and the pressure-volume controller used to apply the cell pressure in return for some corrections due to the load cell movement.
The sample was subjected to the following loading program :
• an isotropic compression stress path from 50 kN/m² to 400 kN/m² ;
• an isotropic unloading from 400 kN/m² to 100 kN/m² ;
• an isotropic compression stress path from 100 kN/m² to 500 kN/m² ;
• an isotropic unloading from 500 kN/m² to 200 kN/m² ;
• a shearing stress path at a constant cell pressure σ’c = 200 kN/m² with a shear rate of 1.67 x 10⁻⁵ s-1 until ε1 = 3.8 % ;
• a discharge to an isotropic stress state with a mean effective stress p’ = 200 kN/m² ;
• an isotropic compression stress path from 200 kN/m² to 500 kN/m².
Bender-extender elements were excited by sinusoidal input signals with a frequency of 5 kHz and an amplitude of 10 V. Typical signals obtained on the Loire River sand are shown in Fig. 4. Brignoli et al. (1996) and Jovicic et al. (1996) have put forward that the ratio Rd = L / λw (where L is the distance of propagation of the wave and λw the wave length) controls the shape of the S-wave output signal. Here the ratio Rd is close to 3. This implies that near-field effects have to be taken into account for the determination of the propagation time Ts of the shear wave (Brignoli et al., 1996 ; Jovicic et al., 1996) : the arrival of the shear wave on the receiver corresponds to the first sign change of the signal derivative, as indicated in Fig. 4. As for the P-wave, the determination of the propagation time TP is straightforward : the first deviation of the output signal coincides with its arrival on the receiver (Fig. 4). The respective velocities VP and VS of the P-wave and the S-wave are therefore calculated (Viggiani & Atkinson, 1995 ; Brignoli et al., 1996 ; Jovicic et al., 1996):
P P T L V = (3) S S T L V = (4)
where L is the distance of propagation between the tips of the transducers.
Finally, the following equations are used to calculate the parameters of the Hooke’s law :
2 S 2 P 2 S 2 P 2 S max , v V V V 4 V 3 V E − − × ρ = (5)
6 where ρ is the density of the Loire River sand.
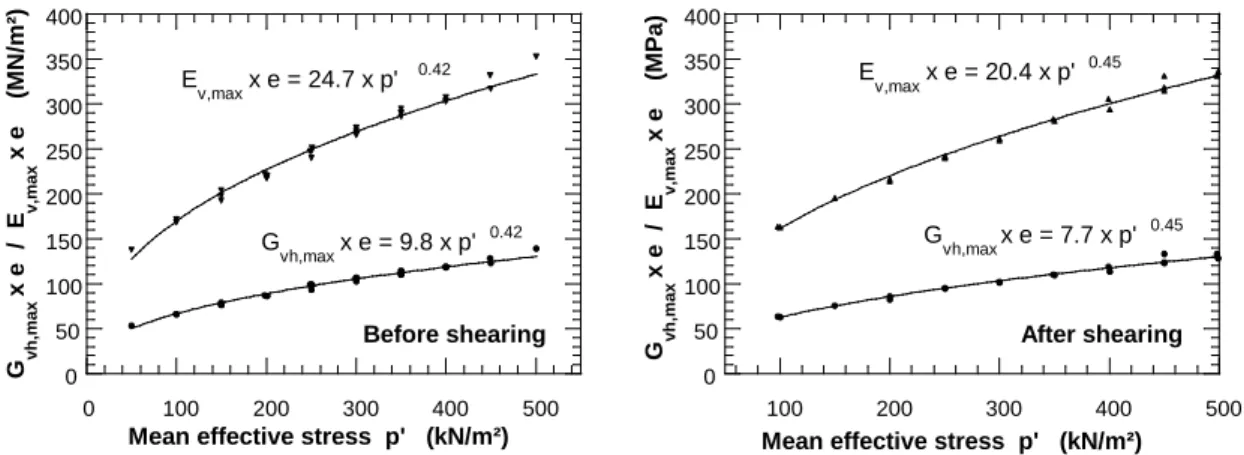
Along isotropic loading or unloading stress paths, the Young’s modulus Ev,max and the shear modulus Gvh,max evolves as indicated in Fig. 5. The following equations are deduced from the experimental results : • before shearing 42 . 0 max , v e 24.7 p' E × = × (8) 42 . 0 max , vh e 9.8 p' G × = × (9) • after shearing 45 . 0 max , v e 20.4 p' E × = × (10) 45 . 0 max , vh e 7.7 p' G × = × (11)
These equations prove the fabric change caused by the shearing phase. However, what is notable is the common value of the powers nE and nG in the equations (8) and (9) and in the equations (10) and (11). It means that the Poisson’s ratio does not change along isotropic stress paths. If nE = nG, then : 1 k 2 k 1 G 2 E G E − = − = ν (12)
Equation (12) applied to the tests on the Loire River sand leads to a value of the Poisson’s ratio ν equal to 0.26 before shearing and equal to 0.32 after shearing. This result is in accordance with the numerical results obtained by Aubry et al. (1982) who consider that the value of the Poisson’s ratio
ν does not depend on the mean effective stress p’ if p’ is greater than 150 kN/m².
0 50 100 150 200 A mp lit u d e o f th e s ig n a l Time scale (ms)
Loire River Sand
σ' c = 150 kN/m 2 P WAVE T p = 0.35 ms
Input signal Output signal
0 50 100 150 200
Time scale (ms)
Loire River Sand
σ' c = 150 kN/m 2 S WAVE T s = 0.64 ms A mp lit u d e o f th e s ig n a
FIG. 4. Electric signals obtained by use of bender-extender elements. 0 50 100 150 200 250 300 350 400 0 100 200 300 400 500 G v h ,m a x x e / E v ,m a x x e (M N /m ²)
Mean effective stress p' (kN/m²)
E v,max x e = 24.7 x p' 0.42 G vh,max x e = 9.8 x p' 0.42 Before shearing 0 50 100 150 200 250 300 350 400 100 200 300 400 500 G v h ,m a x x e / E v ,m a x x e (M P a )
Mean effective stress p' (kN/m²)
G vh,max x e = 7.7 x p' 0.45 E v,max x e = 20.4 x p' 0.45 After shearing
FIG. 5. Evolution of Ev,max and Gvh,max along isotropic stress paths (symbols :
experimental data ; continuous lines : fitting curves).
CONCLUSIONS
Improved piezo-ceramics transducers have been set up within a conventional triaxial cell in order to study the mechanical behavior of the Loire River sand in the small strain domain (ε≤ 0.001 %). An unique couple of bender-extender elements enables to transmit and receive both shear waves and compression waves. Therefore, the Young’s modulus Emax and the shear modulus Gmax can be simultaneously determined along isotropic and / or deviatoric stress paths. This new device was tested on the Loire River sand. Typical laws for the Young’s modulus and the shear modulus were found.
ACKNOWLEDGMENTS
The authors would like to acknowledge the companies RATP, INTRAFOR (France) for their financial support and the company GDS Instruments for their efforts in the development of the bender-extender elements.
REFERENCES
Aubry, D., Biarez, J., Boelle, J-L. and Meunier J. (1982), “Identification of elastic coefficients through resonant tests of soils samples”, Soil Dynamics & Earthquake Engineering Conference, Southampton, 65-75
Brignoli, E.G.M., M. Gotti, and K.H. Stokoe (1996), “Measurement of shear waves in laboratory specimens by means of piezoelectric transducers”, Geotechnical Testing Journal, 19(4),
8
Dyvik, R. and C. Madhus (1986), “Lab measurements of Gmax using bender elements”, Publication 161 of the Norwegian Geotechnical Institute, 1-7.
Dyvik, R. and Olsen, T.S. (1989), “Gmax measured in oedometer and DSS tests using bender elements”, 12th International Conference on Soil Mechanics and Foundation Engineering, Rio de Janeiro, 39-42.
Hardin, B.O. and F.E. Richart (1963), “Elastic wave velocities in granular soils”, Journal of the Geotechnical Engineering Division, ASCE, 89(1), 33-65.
Hareb, H. (2002), Internal report, Civil Engineering Laboratory of Nantes Saint-Nazaire.
Hicher, P-Y. (1996), “Elastic properties of soils”, Journal of Geotechnical Engineering, 122(8), 641-648.
Iwasaki, T. and F. Tatsuoka (1977), “Effects of grain size and grading on dynamic shear moduli of sands”, Soils and Foundations, 17(3), 19-35.
Jovicic, V., M.R. Coop, and M. Simic (1996), “Objective criteria for determining Gmax from bender element tests”, Geotechnique, 46(2), 357-362.
Kuwano, R., Connolly, T.M. and Kuwano, J. (1999), “Shear stiffness anisotropy measured by multi-directional bender element transducers, Proceedings of the International Symposium on Pre-failure deformation characteristics of geomaterials, Torino, Balkema, 205-212.
Lings, M.L. and Greening, P.D. (2001), “A novel bender/extender element for soil testing”, Geotechnique, 51(8), 713-717.
Lo Presti, D.C.F., Pallara, O., Jamiolkowski, M. and Cavallaro, A. (1999), “Anisotropy of small strain stiffness of undisturbed and reconstituted clays”, Proceedings of the International Symposium on Pre-failure deformation characteristics of geomaterials, Torino, Balkema, 3-9. Scholey, G.K., J.D. Frost, D.C.F. Lo Presti, and M. Jamiolkowski (1995), “A review of
instrumentation for measuring small strains during triaxial testing of soil specimens”, Geotechnical Testing Journal, 18(2), 137–156.
Shirley, D.J. & Hampton, L.D. (1978), “Shear-wave measurements in laboratory sediments”, Journal of Acoustics Soc. Am., 63(2), 607-613
Viggiani, G. and J.H. Atkinson (1995), “Interpretation of bender element tests”, Geotechnique,
45(1), 149–154. Standards
ASTM D854-92. Test method for Specific gravity of soils.
ASTM D4254-91. Test methods for Minimum index density and unit weight of soils and Calculation of relative density.
ASTM D4253-93. Test methods for Maximum index density and unit weight of soils using a vibratory table.
ASTM D2487-93. Test method for Classification of soils for engineering purpose.
NF P 94-074 (1994). Essai à l’appareil triaxial – Appareillage – Préparation des éprouvettes – Essais UU – CU + u – CD.