OATAO is an open access repository that collects the work of Toulouse
researchers and makes it freely available over the web where possible
Any correspondence concerning this service should be sent
to the repository administrator: tech-oatao@listes-diff.inp-toulouse.fr
This is an author’s version published in:
http://oatao.univ-toulouse.fr/25272
To cite this version:
Crousier, Claire and Pic, Jean-Stéphane and Albet, Joël
and Baig, Sylvie and
Roustan, Michel Urban Wastewater Treatment by Catalytic Ozonation. (2016)
Ozone: Science & Engineering, 38 (1). 3-13. ISSN 0191-9512
http://dx.dol.org/10.1080/01919512.2015.1113119
Urban Wastewater Treatment by Catalytic Ozonation
Claire Crousier", Jean-Stéphane Pic", Joël Albetb, Sylvie Baig' and Michel Roustana
•université de Toulouse -INSA - USBP, F-31077 Toulouse, France, INRA - UMR792, F-31400 Toulouse, CNRS - UMRSS04, F-31400 Toulouse; bUniversité de Toulouse, INPT-ENSIACET, LCA (Laboratoire de Chimie Agro-industrielle), 31030 Toulouse, France; INRA, UMR 1010 CAi, F-31030 Toulouse, France; <Suez, Treatment Solutions, Scientific Department, 92S00 Rueil-Malmaison Cedex. France
ABSTRACT
This study focuses on the catalytic ozonation of organic matter recalcitrant to usual water treatment technologies. Experiments aimed to investigate the efficiency of the process TOCCATA•, which uses a granular catalyst coupled with ozonation. Comparison was made between single ozonation, single adsorption onto the catalyst and catalytic ozonation. Adsorption was proven to contribute to decreased dissolved organic carbon. Catalytic ozonation enhanced organic matter removal and ozone transfer compared to single ozonation. Catalytic ozonation was modeled with global apparent first-order kinetics and single adsorption with pseudo-second-order sorption kinetics.
KEYWORDS Ozone; Adsorption; Advanced Oxidation Process; Catalytic Ozonation; Kinetic Modeling; Organic Matter; Tertiary Treatment; Wastewater Treatment
Introduction
Part of organic matter including micropollutants of concern persists at the outlet of usual wastewater treat ment plants (WWTPs) (Ternes 1998; Martin Ruel et al. 2011, 2012; Soulier et al. 2011). Conventional tertiary wastewater treatments such as oxidation processes, including ozonation which is known to be a powerful oxidation, are indeed quite sdective, leading to limited removal yields in organics and can be responsible for the emission of some undesired by-products depending on the application conditions (Ikehata, Naghashkar, and El-Din 2006).
The application of advanced oxidation processes can consequently be necessary to improve oxidation yields of resistant organic matter (Bailey 1978; Jans and Hoigné 1998). Catalytic ozonation appears to be an interesting solution as a tertiary treatment to create less selective and more oxidant species thanks to solid catalysts (Baig and Mouchet 2010; Merle et al. 2009), among them the TOCCA T N catalytic process (Fontanier et al. 2006). Like any surface catalysis phe nomenon in a three-phase medium, catalytic ozonation undergoes five main physicochemical phenomena: ozone transfer from the gaseous phase to the liquid phase, diffusion of dissolved molecules (ozone and organic matter) towards the active sites of the catalyst surface, followed by adsorption of both dissolved ozone and organic species, chemical reaction(s) onto the
catalyst surface and finally desorption of reaction pro ducts. This reaction induces substrate mineralization with the cleavage of covalent bonds and the formation of C02 and heteroatoms oxidized forms, as nitrate, phosphate or sulphate.
The applicability of heterogeneous catalytic ozona tion has mostly been studied in industrial wastewaters or synthetic waters containing model compounds (Ma et al. 2005; Alvarez et al. 2009; Faria, Orfao, and Pereira 2009; Li et al. 2010; Aboussaoud et al. 2014). Few studies have, however, focused on natural waters or on domestic-like water matrices, as fulvic acids and humic substances, with different heterogeneous cata lysts: titanium dioxide supported on alumina, nano Ti02 supported on zeolite and metals deposited on different supports as alumina, titanium dioxide and day (Allemane et al. 1993; Volk et al. 1997; Karpel Vel Leitner et al. 1999; Gracia et al. 2000; Kasprzyk Hordern et al. 2006; Wang et al. 2011). Their results are promising because of their high effectiveness in the conversion of refractory compounds.
Therefore, the present work deals with organic mat ter mineralization using the TOCCA T N catalytic ozo nation process (Degremont 1999). The process is compared to single ozonation in order to evaluate its possible application to urban wastewaters. One should refer to the past results published on the mineralization of model compounds or organic matter in industrial
wastewaters using the same catalytic system (Fontanier et al. 2005; Baig and Petitpain 2003). The heteroge neous catalyst involved in this process is made with supported-type metal oxides. Experiments were carried out on treated wastewater issued from biological treat ment to determine the performances, and the global kinetics of this process. As adsorption is an essential step for catalytic ozonation, a focus was made on its kinetics, and the experimental results were confronted to the most common models described in literature.
Materials and methods
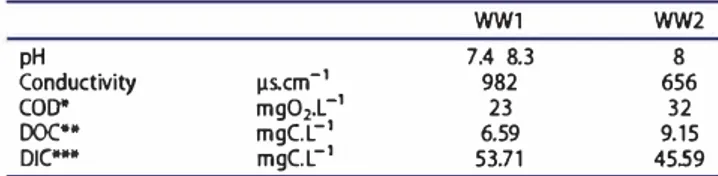
Urban wastewater effluents were collected at the outlet of the secondary clarifier in two French biological treat ment plants (WWl, WW2). Their characteristics are described in Table 1. TOCCATA catalyst is of type-Table 1. Urban wastewaters' characteristics.
WWl WW2 pH 7.4 8.3 8 Conductivity µs.cm-1 982 656 COD" mg02.L-1 23 32 DOC'* mgcr1 6.59 9.15 DIC*** mgcr1 53.71 4559
(*Chemical Oxygen Demand, ** Dissolved Organic Carbon, *** Oissolved lnorganic Carbon)
supported metal of granular shape characterized by 2-mm average diameter and 300 m2.g 1 surface area. The same load was used for ail experiments without any regeneration treatment except washing to complete the recovery of inorganic carbon.
Experimental tools
Figure 1 schematizes the experimental setup that was used for semicontinuous single ozonation and catalytic ozonation runs. It consisted in two glass column reac tors in parallel (6-cm inner diameter, 50-cm height), one was empty and the other was packed with 50 cm catalyst supported by a PTFE grid. Ozone was pro
duced from pure oxygen (alpha grade) using an ozone generator (Ozonia OZAT CFS-1/3 2G). A set of valves and a tlow controller ensured a constant 20 L.h 1 (tlowmeter value) inlet gaseous 03 tlow (OG,IN) into
the reactor, with 1.2 bar absolute pressure and ambient temperature conditions, equivalent to 19.7 L.h 1 (± 4%) NTP. The work was carried out with an uptlow co current of ozonized oxygen gas (continuous intake) and polluted liquid solution (batch mode). A pump ensured total liquid recirculation ( 40 L.h 1) inside the contactor through a 1-L buffer tank.
=' ...
___
-< .. ·· .. A ... A ...A
_..
____
.---Figure 1. Experimental setup.
o,
destructionv
Gas vent ··►·· Sodatrn1>(1Clm1nerallzed
.
.
analysis (Oalo.ou1.
.
=<·tiliia··-:· ... ••;):
f···lilit···tilil· ...
.
·+
.
.
.
.
.
.
.
• c;oo :o '1;: 'fJ� • o• o"·d'
0 • 0. () � •tf 0 q, o• • o•o o • o• o l+...,liilool�l!llil..jM " •d'_ " Flow indielrtor Oo: ... ····-:···•liilit•····;,
□
--[0-.1--o.-,•-M
analysis Ozone produetion···➔··· .. ··�··· ... .;c.. ..
➔
··=
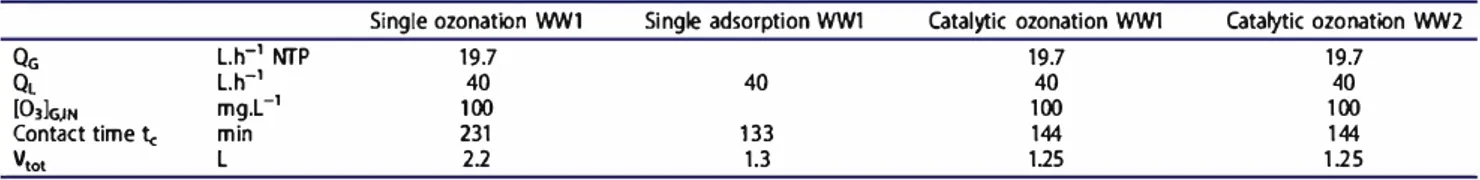
Table 2. Experimental operating conditions.
Single ozonation WW1 Single adsorption WW1 Catalytic ozonation WW1 Catalytic ozonation WW2
QG L.h-1 NTP 19.7 Ql L.h-1 40 40 [03)GJN mgr1 100 19.7 40 100 144 115 19.7 40 100 144 115
Contact time te min 231 133
V,oi L 21 1.3
(Qd gaseous volumetric flow, QL: liquid recirculation volumetric flow)
Gaseous ozone was continuously analyzed at the inlet and the outlet of the column with two UV ozone analyzers (BMT 964 model) and dissolved ozone was
measured at the half height of the catalytic bed with a polarographic dissolved ozone analyzer ( 410 Orbisphere model) equipped with an ozone sensor (31330 Orbisphere sensor). Carbon dioxide at the gas eous output was continuously trapped under lnorganic Carbon species (IC), representing the mineralized car bon, by circulating the contactor off-gas in a sodium hydroxide solution. The off-gas flow then went through an ozone thermal destructor ( 450 °C) before atmo spheric release.
Experiments have been run on WWl to compare single ozonation, catalytic ozonation and single adsorp tion onto the catalyst. Inlet conditions were gaseous superficial velocity UG = 7.1 m.h 1 (empty bed), ozone inlet concentration [O3)G,IN = 100 mg.L 1 ± 7%, and liquid recirculation superficial velocity UL = 14.1 m.h 1 (empty bed) for each experiment. Experimental operat ing conditions are summarized in Table 2.
Catalytic ozonation experiments have been run according to a fixed bed operation as follows: 15-min single adsorption at startup followed by 6-h simulta neous ozone and wastewater circulation through the catalyst bed. The experiment has been repeated on WW2 to compare the evolution of the parameters under study for two different wastewaters.
Analytical methods
First, 12-mL samples were regularly collected at the bottom of the column and were filtered at 0.45 µm before analysis.
Dissolved Organic Carbon (DOC), Dissolved lnorganic Carbon (DIC), and lnorganic oxidized Carbon (IC) were determined using a TOC analyzer (TOC-V csh, Shimadzu) that involves catalytic oxida tion at 720 °C prior to infrared detection of CO2
(Standard method NFT 90.102). pH was measured with a pH meter (pH 538 WTW) and a pH electrode
(Sentix 41 WTW).
COD (Chemical Oxygen Demand) was controlled with the NF T90-101 micromethod (2001), through a reaction with an acidic solution of potassium dichromate in the
presence of a sil ver catalyst and digested for 2 h at 150 °C: oxidizable organic compounds reduce the dichromate ion (Cr2o/·) to the chromic ion (Cr3+), and the decrease in
dichromate ion is measured with a spectrophotometer at 420 nm Initial and final solutions were analyzed with a spectrophotometer (Jasco 630) for UV-Vis absorbance. Contact time
Contact time was calculated from the passage time and the number of passages according to the circulating liquid flowrate and the volumes of contactor and solu tion, which lead to Equation [l).
Vi
te=
t.- (1)Vtot
With te the contact time (min), t the reaction time (min), VL the volume of liquid in the gas liquid con
tactor and V101 the total liquid volume (L).
Carbon mass balance
Carbon mass balances were calculated after each experiment by considering the amount of inorganic carbon trapped from the off gas and the dissolved inorganic and organic carbon concentrations remaining in the treated liquid solution.
Ozone mass balances
The different terms of the ozone mass balances were calculated considering experimental inlet and outlet gaseous ozone and dissolved ozone concentration as follows: (2) 03..transferred =
J
1
(03JGIN·QG.dt-J 1 (03JGour·OG-dt (3) 0 ' 0 ' 03..consumed =J
1
(03)GJN·QG.dt-J 1 (03)Gour-OG.dt 0 ' 0 ' - (03)L(t)· Vtot -[DJ]G,OUT(t)· Vd_ 03..applied - 03_1ranferred lOO
110 3 - ---03....applied X
(4)
With 03 applied, 03 consumed, and 03 transferred the ozone weights that were respectively applied, consumed, and transferred during reaction (g), 1103 the ozone transfer yield, {03}c,IN the inlet ozone concentration (mg.L 1
),
{03)c,our the outlet ozone concentration (mg.L 1 ), {03} the dissolved ozone concentration (mg.L 1), V101 the L
total liquid volume, Vd the reactor dead volume (L) and
t the reaction time (min). The ozone doses are calcu
lated from the related ozone weight divided by the liquid volume corrected by the sample volumes withdrawn.
Results and discussion
Experiments were carried out for single ozonation, catalytic ozonation and single adsorption. The investi gations focused on ozone consumption, variations of dissolved organic and inorganic carbon and oxidation rate. Figure 2 describes DOC evolution with contact time, Figure 3 shows DOC evolution with the trans ferred ozone dose, Figure 4 is DIC evolution with contact time and Figure 5 i s pH evolution with contact time. Ali experiments lasted 6 h, corresponding to a contact time of 130 min in the presence of solid and of 230 min in the ca se of exclusive liquid feed, because the introduced liquid volume amounts were different to fill the column with and without catalyst (1.25 L and 2.2 L, respectively). Each experiment was carried out twice with a satisfactory repeatability.
Single ozonation resulted in partly reducing DOC
(39% degradation) and DIC (15% degradation), and ozone transfer was very low (recovering 70% inlet ozone at the gaseous output). DOC decreased slowly during the first 20-min contact time until a stable value due to by-compounds resistant to ozone. Further addi tion of ozone did not achieve reduction of any of the remaining organic matter. pH was stable during the experiment (Figure 5). ::::.,
8
4 ...,Single oz.onaUon WW1 +Single adsorption WW1 +Catalytlc ozonation WW1 -9-Catalyllc ozonation WW2 0+----�---�---�---�--� 0 50 100 150 200 250Contact timo (min)
Figure 2. DOC evolution with contact time.
• Single ozonat.ion WW1
-&-Catalytlc ot.onatlon WW2
..-catalytlc ozonaUon WW1
0+---�---�---�--4
Transferred o, dose (9.L·') Figure 3. DOC evolution with transferred ozone dose.
50 •o �
î
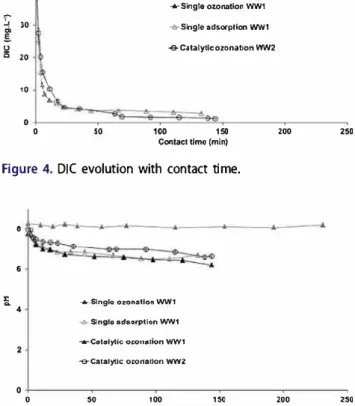
30 � 20 10 0 0 �-50 *Single ozonation WW1 "6-"Singleadsorption WW1 -&-Catalytlc ozonatlon WW2 100 150Contacl lime (min) Figure 4. DIC evolution with contact time.
8 6 i 4 -.rrSlnglo ozonatlon WW1 -6-Slnglo adsorption WW1 -.-cotolytiç o�on111tion WW1 -e-Catalytlc ozonation WW2 0 0 50 100 150
Contact lime (min)
Figure S. pH evolution with contact time .
200
200
250
250
Catalytic ozonation enhanced DOC removal yield
up to 90% and DIC removal accordingly (99%). Ozone transfer yield was close to 70%. Figure 10 indeed reveals that the presence of the catalyst ensures a virtually linear increase in the transferred ozone dose as a func tion of applied dose whatever the water used. Despite the high ozone transferred dose, dissolved ozone con centration was stable at low value around 0.4 mg.L 1
during catalytic ozonation experiments, because the catalyst highly decomposes 03• Then, 66% removal of
DOC was already recorded upon adsorption at startup, DOC then decreased slower during catalytic ozonation.
Regarding single adsorption onto the catalyst, DOC decreased sharply (70%) during the first 20 min and then slower. Removal yields reached 85% for DOC and 95% for DIC after 6-h treatment duration.
pH decreased until a stable value in both experi ments with catalyst (Figure 5) with an acidification of the wastewater matrix due to the acidic surface of the catalyst and to the formation of acidic intermediates during ozonation.
Catalytic ozonation therefore enhances DOC and DIC decrease compared to single ozonation, and the presence of the catalyst improves ozone transfer and ozonation efficiency for reducing persistent com pounds. Single adsorption is also responsible for a sharp decrease of DOC and DIC but only concentrates it at the surface of the catalyst.
A study of the kinetics can be useful to better under stand the involved mechanisms. In particular, any surface catalysis phenomena is initiated by the adsorption of reac tants onto the catalyst so that the apparent rate indudes adsorption kinetics. A focus on single adsorption was, therefore, first carried out to evaluate adsorption kinetics versus the global ones by uncoupling the mechanisms. Adsorption kinetics
Single adsorption onto the catalyst was performed dur ing 6 h and reached 86% removal yield for DOC. During the first 20 min, DOC showed a sharp decrease (70%), which then becomes slower. The single adsorp tion process can usually be described by four main steps: molecule migration towards the catalyst (partide convection), diffusion through the boundary layer onto the catalyst surface, pore diffusion, and bonding with the surface active sites of the catalyst.
A kinetic modeling was therefore investigated to estimate sorption rates and to approach possible mechanisms controlling the adsorption process. Most common literature models used to describe adsorption kinetics were studied: Lagergren pseudo-first-order model (Lagergren 1898) based on solid capacity, Ho and McKay pseudo-second-order model (Ho and
McKay 1999, 1998) that assumes chemisorption as the controlling step, the Weber and Morris intraparticle diffusion model (Weber and Morris 1963) and the Elovich equations (Elovich 1939) based on multilayer adsorption.
These models are described in Table 3, Equations [ 6], [7], [8], [9] where te is contact time (min), qe the amount
of DOC adsorbed at equilibrium (mgooc.gc;,.ta1yst 1), (}t the amount of DOC adsorbed on the surface of the catalyst at any time t (mgooc.gc;,.ta1yst 1
), k1 the pseudo
first-order chemical sorption rate constant (min 1 ), k2 the pseudo-second-order chemical sorption rate con
stant (gc;,.ta1yst.mgooc 1 .min 1 ), k; the intraparticle diffusion rate constant (mgooc.gc;,.talyst 1.min 112),
c the intercept for the Weber and Morris
model (mgooc.gc;,.ta1yst 1
), a and� Elovich rate constants (gc;,.ta1yst•mgooc 1.min 1). Table 4 develops the different models linearization results (Equations [10], [11], and
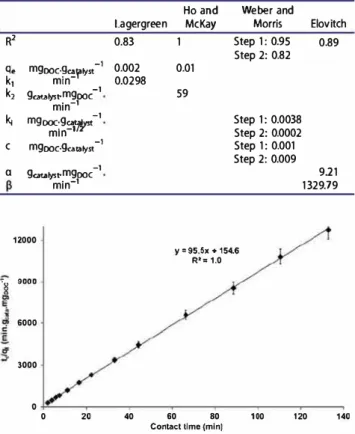
[12]); the correlation coefficient with experimental data and the kinetic constants were calculated for each model. The reaction is not likely to be a pseudo-first order reaction even if the Lagergren model lineariza tion plot has a high correlation coefficient with the experimental data. Indeed, the experimental maxi mum adsorbed amount used for calculation (qexp
=
0.01 mgooc.gc;,.ta1yst 1) differs highly from the intercept of the Lagergren model linearization (qe
=
0.002 mgooc.gc;,.ta1yst 1). The Elovich model was also excluded because of a bad linearization correlation coefficient.The model that best fits with the experiment data is, therefore, the Ho and McKay pseudo-second-order model, which gives a good value for the amount of adsorbed DOC at equilibrium and the best correlation coefficient with the experimental data. Figure 6 draws the pseudo-second-order linearization (Equation [ 11 ]), based on Ho and Mc Kay theory, which assumes both a fast fixation of the pollutants onto the most reactive sites and a slow fixation onto the low energy sites. The follow ing sorption parameters can then be calculated: qe
=
0.01 mgooc.gc;,.1a1yst 1 and k2=
59 �st.mgooc 1.min 1•According to the literature, this model supports the hypothesis that chemisorption is the rate-controlling step during adsorption, involving valency forces through Table 3. Adsorption kinetic models' equations and linear equations.
Equation Linear equations
L.agergren Pseudo first order � k,(q. q,) (6) log(q. q,) log(q.) ritJt (10)
Ho and McKay � k2(q. q,)2 (7) .1. �+t (11)
Pseudo second order q,
Weber and Morris
lntraparticle diffusion q, !<it
1/2 + C (8)
Elovich � ae-pq, (9) q, �+iln(t) (12)
Table 4. Comparison of different kinetic models for single adsorption.
Ho and Weber and
L.agergreen McKay Morris Elov itch
R2 q. mgooc-�<!Y,lyst -1 k1 mm k2 9cata1ys,mgooc -l min-1 k; mgooc:9�? -1 mm 1 C mgooc-9catalyst -1 a 9cata1ys,mgooc -l min-1 12000
·�
9000 6000 3000 0 0 20 0.83 0.002 0.0298 40 1 0.01 59 Step 1: 0.95 0.89 Step 2: 0.82 Step 1: 0.0038 S tep 2: 0.0002 Step 1: 0.001 S tep 2: 0.009 911 1329.79 y • 95.5x + 154.6 R'• 1.0 60 80 100 120 140Contact lime (min}
Figure 6. Ho and Mc Kay Pseudo-second-order adsorption
kinetic s applied to WW1 single adsorption.
0.012 _0.008
J
t
r!1 0.004 y• 0.004x • 0.001 R1•0.95 y • 0.0002x + 0.0085 R' • 0.82 0.000 --�--�--�--�--�-�-8 8 te'-' (min'-') 10 12Figure 7. Weber and Morris intraparticle adsorption model correlated with WW1 single adsorption experimental data.
sharing or exchange of electrons between the adsorbent and the adsorbate.
To further understand the diffusion mechanism, the Weber and Morris model (Weber and Carell Morris
1963) has also been investigated This mode! assumes
negligible film diffusion and intraparticle diffusion as the rate controlling step. According to Equation [ 8), the plot of qt versus t/5 in Figure 7 shows two different linear sections with different slopes because of different
successive steps occur during adsorption. This can be due to DOC adsorption onto the extemal surface of the catalyst (including macropores and micropores) that first takes place, followed then by DOC interaction with the micropores, causing diffusion resistance increase and the diffusion rate decrease (Crini and Badot 2010).
However, the Ho and McKay model limited by adsorp tion seems to be more consistent with the experimental data than the Weber and Morris mode! limited by diffu sion. Indeed, the catalytic material is mesoporous, which is more consistent with the Ho and McKay model frame work than the Weber and Morris model applicable to microporous materials. As a conclusion, single adsorption seems to be governed by pseudo-second-order kinetics as in the Ho and McKay mode!, which considers chemisorp tion as the rate-controlling step.
Single ozonation kinetics
Generally, a global second-order reaction rate is used in ozonation processes (first order with respect to organic matter and to dissolved ozone, Equation [13)). To obtain an estimation of the second-order rate constant, a rough "integration" of the rate law was done and
DOCg�OC evolution versus [ 03)L x te was plotted
(Fontanier 2003). The correlation parameter was quite high (If = 0.89) and the following second-order con stant was calculated: k single 03 = 7.10-4 L.mg 1.min 1
i.e. k single o3 = 33.6 L.mol 1.min 1 for WWl single
ozonation, in relation with:
(13)
Catalytic ozonation kinetics
In the case of the catalytic ozonation experiment, dis solved ozone concentration remained quite low and con stant (maximum dissolved ozone values: 0.87 mg.L 1 for
WWl; 0.74 mg.L 1 for WW2, mean dissolved ozone
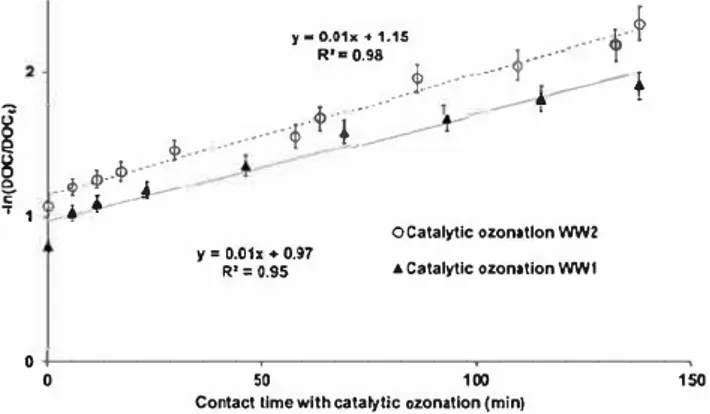
values: 0.40 mg.L 1 for WWl; 0.21 mg.L 1 for WW2) along the experiments. Thus, kinetic order degenerates to pseudo-first-order kinetics as defined by Equation [14), which can be integrated and put in the linear form ofEquation [ 15). The corresponding linearization curve is plotted in Figure 8. dDOC --d-te
=
kco.DOC (14) DOC ln( DOCo)=
-kco.tc
(15)y• 0.01x • 1.1S ....
-
-
;k,
�
·
Î
R'• 0.98 •••-···½···
T[
j,
...
•··
·
··
f
<f,-
f
····
0 4>•..• .. •·_t
.. •··
1---I .• __...-, T e. .. , cp·· . ♦ -9 1 -♦-• ---y= 0.01x • 0.97 R1 = 0.95 oCatatytJc ozonatlon WW2 & C.atatytJc ozonation WW10+---�---�---�
0 � 100 1�
Contact lime with catatytic ozonation (min)
Figure 8. First-order kinetic model linearization for catalytic ozonation experiments.
With kco the apparent first-order kinetic constant for catalytic ozonation (min 1
) , DOC and OOC0 the cur
rent and initial Dissolved Organic Carbon (mgC.L 1 ), and t contact time (min).
The linear regression gives quite good results, con firming that catalytic ozonation follows a pseudo-first order kinetic mode! during the ozonation after the initial adsorption step (i.e., after 5-min contact time between liquid and catalyst at startup). The corre sponding pseudo-first-order constant rate is kco = 0.01 min 1 for both wastewaters.
Mineralization extent
Conceming both single ozonation and catalytic ozonation
experiments, carbon balances (Figure 9) showed that all
organic carbon removed from the solution was minera lized into carbon dioxide further trapped at the gaseous output under inorganic carbon using soda solution.
Mineralized IC and desorbed IC in Figure 9, respectively,
stand for the inorganic carbon amount measured at the gaseous output directly during the experiment and after
post-washing treatment. Figure 9 highlights that the bal
ances are consistent since the amounts of DOC and DIC removed from wastewater correspond to the quantity of
.-
:.., 601
40 'ô li !: 20 0 (J FlnalWW1 Ca1aly1fc ozonallon■DOC BDIC □Mlnorallzod C BOeoorbodlC
Figure 9. Carbon mass balances.
carbon dioxide recovered under carbonate ions, with an acceptable error with respect with measurement accuracy: 12.7%, 5.7%, and 6.4% for catalytic ozonation on WWl, WW2, and single ozonation on WWl, respectively.
Regarding WWl single ozonation, most DOC and DIC remained in the liquid solution and only 27% of the total recovered carbon was found in the soda trap as inorganic carbon. DOC was consequently not totally oxi dized probably because of the formation of products more resistant to ozone molecular attack, which is known to be rather selective. Regarding WWl catalytic ozonation, removed DOC and DIC were mostly recovered as carbon dioxide at the gaseous output (98%). Regarding WW2 catalytic ozonation experiments, 94% of initial DOC and DIC were recovered, mostly at the gaseous output. Only 47% was however recovered during the reaction, because the remaining 53% stayed adsorbed onto the catalyst. Inorganic carbon recovery was consequently achieved in WW2 experiment by implementing catalyst washing using ultra pure water circulation under oxygen purging as post-treatment. A higher DOC initial value in WW2 was probably responsible for this specific behavior. Regarding carbon balances, the addition of the catalyst therefore enhances oxidation efficiency for mineralizing organic matter by achieving less-selective reactions with faster kinetics than single ozonation.
Ozone transfer efficiency
Figure 10 focuses on ozone transfer. The transfer yield, 1103, was constant during each experiment. Catalytic ozo nation experiments on wastewaters were also compared to experiments with ultrapure water under similar condi tions. Catalytic ozonation experiments showed the same yield (1103 close to 65%) whether they were performed using different wastewaters or ultrapure water. The cata lyst is therefore able to govern ozone transf er so that no influence of the water quality appears. The catalyst/ ozone reaction was fast enough to produce a very low dissolved
10 8 : 6 ô e • ... 2 +-Catalytic ozonatlon WW1 -&-Catalytic ozonation WW2
+-Catalytic ozonatlon uttrapure water
.... single ozonation WW1
4 6
Applled O, dose (g.L·1)
ozone concentration (0.4 mg.L 1). Ali these observations are consistent with a reaction pathway based on two successive reactions as evoked by Fontanier (Fontanier et al. 2006). The first consists in the fast formation of highly reactive metal oxide from ozone and catalyst inter action. Single ozonation had a much lower transfer yield (TJ03 = 24% for WWl), due to lower kinetics for ozone reactions occurring in the wastewaters resulting in lower ozone demand. The measured dissolved ozone concen tration was consequently much more important during
single ozonation (26 mg.L 1 reached in the 20 first min of
reaction time with WWl), compared to catalytic ozona
tion. Thus catalytic ozonation enhanced 03 transfer com
pared to single ozonation because of fast ozone consumption by the catalyst. However, it is worth noting that hydrodynamic conditions were not strictly the same for single ozonation and catalytic ozonation experiments. The catalytic packing indeed accelerates water and gas velocities that favor mass transfer. A little improvement of ozone transfer rate can then be expected
Impact on other wastewater characteristics
Other parameters have also been evaluated for initial and final solutions after experiment with ozone to better understand which compounds have been degraded, and to characterize treated wastewater after catalytic ozonation.
The control of Chemical Oxygen Demand has shown that the initial COD (23 mg02.L 1) has been reduced down to the detection limit equal to 10 mg02.L 1 for both experiments related to single and catalytic ozona tion applied to WWl and WW2. This occurs when DOC removal rates highly differ, which highlights dif ferent oxidation pathways.
A focus on UV-Vis absorbance was realized for a better understanding of which kind of organic com pounds have specifically been degraded. Figure 11 and
0.12 :!! 0.09 0.06 0.03 0 250 290 -RowWW1 -Single Ozonatlon -Catalytic ozonation 330 370 Wavelenght (nm) 410
•••
Figure 11. UV Absorbance spectra in the range 250-450 nm for raw WW1 and after single and catalytic ozonation.
Figure 12 stress the main differences in absorbance spectra for raw WWl and after the different treatments. Major absorbance occurred in the region with wave lengths under 250 nm.
Regarding absorbance spectra in the range 250 nm-450 nm (Figure 11), one can observe first that both oxidation systems greatly affected UV absorbance spectra. It can be noticed that proteins (specific amino acids as tyrosine and tryptophan) and compounds absorbing at 280 nm were only present into raw water. In a general way single ozonation showed higher final values of absorbance compared to catalytic ozonation. The absorbance peak at 210 nm was still remaining whatever the treatment applied Aromatic compounds absorbing at 254 nm (Silverstein et al. 1998) were highly reduced in both treat ments but single ozonation was less efficient than catalytic ozonation (nearly total removal). Regarding higher wave lengths values, only raw water sample has shown some UV absorption. This indicates that the corresponding compounds were then removed during both oxidation processes.
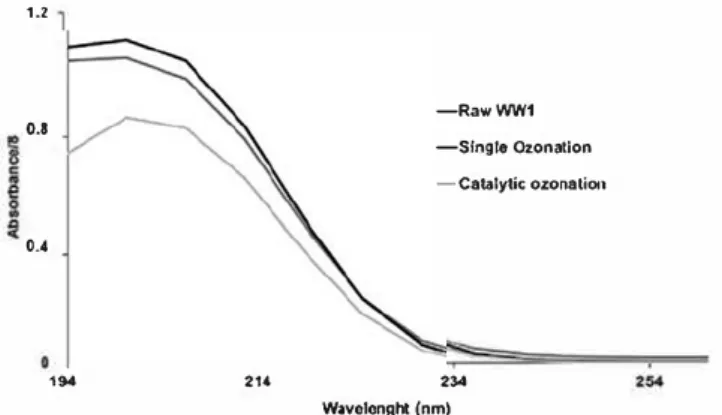
Figure 12 corresponds to the spectra of the samples
with eightfold dilution because of absorbance satura tion in this wavelength area. A high absorbance at wavelengths around 210 nm was noticed in all cases, corresponding to compounds such as aldehydes, car boxyl, esters, nitrates, and numerous other organic compounds (Silverstein et al. 1998). Single ozonation showed a slight increment in absorbance values com pared to raw WWl. This can be due to the compounds absorbing at higher wavelengths (as aromatics) that are converted into by-products absorbing at lower wave lengths during reaction. Regarding catalytic ozonation experiment, a reduction around 20% of 210 nm absor bance can be noticed. This shows an enhancement of oxidation yields for catalytic ozonation compared to single ozonation. 1.2 o.s 0.4 HM 214 -RawWW1 -Slngle Ozonation -catalytic ozonation 234 Wavolcnght (nm)
Figure 12. Diluted (eightfold) UV Absorbance spectra in the
range 190-250 nm for raw WW1 and after single and catalytic
Ali complementary analyses showed that catalytic ozonation is more efficient for reducing wastewater characteristic polluting parameters compared to sin gle ozonation. Catalytic ozonation therefore enhances the reduction of the organic compounds present in the wastewater matrix, particularly aromatic com pounds that represented a part of resistant pollutants so far.
Conclusions
Experiments have been carried out on urban waste waters for comparing single ozonation, single adsorp tion and catalytic ozonation according to the TOCCA T N process, in terms of organic matter removal efficiency and ozone transfer.
Single ozonation was selective for reducing waste water organic matter (only 39% DOC removal and 27% mineralization), probably because of the presence of compounds refractory to molecular ozone. Catalytic ozonation according to the TOCCATA process was able to enhance the oxidation extent achieving 90% DOC removal and 98% mineralization under similar conditions. As expected, adsorption contributed to DOC decrease during the catalytic process as the first step of catalytic mechanism. A pseudo-second-order kinetic model was presented for single adsorption, and some specific sorption parameters have been deduced such as the equilibrium sorption capacity and the rate constant. An apparent first-order kinetic model was proposed for DOC mineralization during catalytic ozonation which fitted well to experimental data.
Carbon balances stressed that catalytic ozonation achieved a high organic carbon mineralization com pared to single ozonation. Besides, ozone mass transfer was enhanced from 24% to 68%, when ozone reaction took place in the presence of catalyst, and dissolved ozone concentration was much lower. Ozone transfer enhancement was therefore highlighted under catalytic reaction.
UV absorbance showed that more organic com pounds were oxidized during catalytic ozonation com pared to single ozonation, particularly aromatic compounds that absorb at 254 nm.
The TOCCATN catalytic process was therefore much more efficient than traditional single ozonation for reducing recalcitrant organic matter with ozone transfer and reactivity enhancement.
Nomenclature and abbreviations Abbreviations/
Nomenclature Sig nificance Unit
ww Wastewater
COD Chernical Oxygen Dernand mg01,C1
DOC Dissolved Organic Carbon mgC.C'
DIC Dissolved lnorganic Carbon mgC.C'
/C lnorganic carborr CO2 trapped at the mgC.C'
gaseous output
Lh-1 QG Gaseous volumetric ffow
QL Uquid volumetric ffow Lh-1
UL Empty Bed Liquid Superficial velocity m.h-1
UG Empty Bed Gaseous Superficial velocity m.h-1
[O:J41N ln/et ozone concentration mg03-C1
[O:J4our Out/et ozone concentration mg03-C1
[O:JL Dissolved ozone concentration mgO
c'
Apparent first order kinetic constant for min--t
catalytic ozonation
O3_<pp1ied Ozone amount applied during reaction g
O3_œn,um,d Ozone amount consumed during g
reaction
O3_1ra,.fetred Ozone amount transferred during g
reaction
Vd Reactor dead volume L
k ,;,,gi,_03 Single 03 second order constant Lmor'.
min-1
R2 Unearization co"elation parameter
t, Contact lime min
t Reaction time min
v.,, Total liquid volume L
VL Volume of liquid in the reactor L
q, Amount of DOC adsorbed at equilibrium mgooc,
9caO>lyst-1
q, Amount of DOC adsorbed on the surface mgooc,
of the catalyst at any time t g,'!"'!/f"
_,
k, Pseudo first order chemical sorption rate mm constant
k2 Pseudo second order chernical sorption 9caO>
lyst-rate constant mgooc-'•
min-1
k; lntraparticle diffusion rate constant mgooc,
_,
g,'!.,_� .mm
C lntercept for Weber and Morris made/ mgooc,
9caO>lyst -1
a, /3 Elovich rate constants 9caO> lyst-mgooc-'• min-1 q.,..p Experimental maximum adsorbed mgooc,
amount 9caO>lyst -1 f1o3 Ozone transfer yield %
Acknowledgments
The authors would like to thank Bernard Reboul and Manon Montaner for their technical support in this project.
References
Aboussaoud, W., M. H. Manero, J. S. Pic, and H. Debellefontaine. 2014. "Combine d Ozonation Using Alumino Silica Materials for the Removal of 2,4 dimethyl phenol from W ater." Ozone: Science & Engineering 36:221 8. doi: 10.1080/01919512.2014.883273.
Allemane, H., B. Delouane, H. Paillard, and B. Legube. 1993.
"Comparative Efficiency Of Three Systems (03, O3'H2O2, and O3/fiO2) For The Oxidation Of Natural Organic
Matter In Water." Ozone: Science & Engineering 15 (5):419 32. doi:10.1080/01919512.1993.10555733.
Alvarez, P. M., F. J. Beltran, F. J. Masa,andJ. P. Pocostales. 2009.
"A Comparison Between Catalytic Ozonation and Activated Carbon Adsorption/Ozone Regeneration Processes for Wastewater Treatment" Applie,d Catalysis B: Environmental
92:393 400. doi: 10.1016/j.apcatb.2009.08.019.
Baig, S., and P. Mouchet 2010. "Oxydation Et Réduction Appliquées Au Traitement De L'eau: Oxygène, Chlore Et Dérivés." Techniques De L'ingénieur W2702. Environnement
Sécurité, Technologies de l'eau. Paris, France.
Baig, S., and F. Petitpain. 2003. "Catalytic Ozonation for Advanced Treatrnent of Industrial Wastewaters." In IOA EA3G International Conference. Ozone, a Clean Source for Activated Oxygen Oxidations and Disinfection. Berlin, Germany.
Bailey, P. S. 1978. Ozonation in Organic Chemistry, vol. 1, Olefinic Compounds. New York, NY: Academic Press.
Crini, G., and P. M. Badot. 2010. Sorption Processes and Pollution. Conventional and Non Conventional Sorbents For Po/lutant Removal From Wastewaters. Besançon, France: Presses universitaires de Franche Comté.
Degremont, S. A. December 23 1999. Method for Mineralization of Organic Pollutants in Water by Catalytic Ozonation. WO 99/65828.
Elovich, S. 1939. The Journal of Physical Chemistry (USSR)
13:1761.
Faria, P. C. C., J. J. M. Orfao, and M. F. R Pereira. 2009. "Activated Carbon and Ceria Catalyst Applied to Catalytic
Ozonation of Dyes and Textile Effluents." Applied
Catalysis B: Environmental 88:341 50. doi:10.1016/j.
apcatb.2008 .1 1.002.
Fontanier, V. 2003. Mise Au Point D'un Procédé D'ozonation Catalytique Pour Le Traitement Des Effluents Aqueux Application
A
L'industrie Papetière. Toulouse, France:INP Toulouse.
Fontanier, V., V. Farines, J . . Albet, S. Baig, and J. Molinier. 2006. "Study of Catalyzed Ozonation for Advanced Treatment of Pulp and Paper Mill Effluents." Water Research 40 (2):303 10. doi:10.1016/ j.watres.2005.11.007.
Fontanier, V., V. Farines, J. Albet, S. Baig, and J. Molinier. 2005. "Oxidation of Organic Pollutants of Water to
Mineralization by Catalytic Ozonation." Ozone: Science &
Engineering 27 (2):115 28. doi:10.1080/
01919510590925239.
Gracia, R., S. Cortes, J. Sarasa, P. Ormad, and J. L. Ovelleiro.
2000. "TiO2 Catalysed Ozonation of Raw Ebro River
Water." Water Research 34 (5): 1525 32. doi:10.1016/ S0043 1354(99)00297 3.
Ho, Y. S., and G. McKay. 1998. "Sorption of Dye from
Aqueous Solution by Peat." Chemical Engineering Journal
70 (2):115 24. doi:10.1016/S0923 0467(98)00076 1.
Ho, Y. S., and G. McKay. 1999. "Pseudo Second Order Model for Sorption Processes." Process Biochemistry 34 (5):451 65. doi:10.1016/S0032 9592(98)00112 5.
Ikehata, K., N. J. Naghashkar, and M. G. El Din. 2006. "Degradation of Aqueous Pharmaceuticals by Ozonation and Advanced Oxidation Processes: A Review." Ozone: Science & Engineering 28 (6):353 414. doi:10.1080/ 01919510600985937.
Jans, U., and H. Jürg. 1998. "Activated Carbon and Carbon Black Catalysed Transformation of Aqueous Ozone into OH Radicals." Ozone: Science and Engineering 20 (1):67 90. doi: 10.1080/01919519808547291.
Kasprzyk Hordern, B., U. Raczyk Stanislawiak, J. Swietlik, and J. Nawrocki. 2006. "Catalytic Ozonation of Natural Organic Matter on Alumina." Applied Catalysis B:
Environmental 62 (3 4):345 58. doi:10.1016/j.
apcatb.2005.09.002.
Lagergren, S. 1898. "Zur Theorie der Sogenannten Adsorption Gelôster Stoffe." Kungliga Svenska Vetenskapsakademiens Handlingar 24:1 39.
Leitner, K. V., N.B. Delouane, B. Legube, and F. Luck. 1999. "Effects Of Catalysts During Ozonation Of Salicylic Acid, Peptides And Humic Substances In Aqueous Solution."
Ozone: Science & Engineering 21 (3):261 76. doi:10.1080/ 01919519908547240.
Li, B., X. Xu, L. Zhu, W. Ding, and Q. Mahmood. 2010.
"Catalytic Ozonation of Industrial Wastewater
Containing Chloro and Nitro Aromatics Using Modified Diatomaceous Porous Filling." Desalination 254 (1 3):90 8. doi: 10.1016/j.desal.2009.12.009.
Ma, J., M. Sui, T. Zhang, and C. Guan. 2005. "Effect of pH on MnOx/GAC Catalyzed Ozonation for Degradation of
Nitrobenzene." Water Research 39 (5}:779 86.
doi: 10.1016/j.watres.2004.11.020.
Martin Rue� S., J. M. Choubert, H. Budzinski, C. Miège, M.
Esperanza, and M. Coquery. 2012. "Occurrence and Fate of Relevant Substances in Wastewater Treatrnent Plants Regarding Water Framework Directive and Future Legislations." Water Science & Technology 65 (7}:1179 89. doi: 10.2166/wst.2012.943.
Martin Ruel, S., J. M. Choubert, M. Esperanza, C. Miège, P. N. Madrigal, P. H. Budzinski, K. L. Ménach, V. Lazarova, and M. Coquery. 2011. "On Site Evaluation of the Removal of 100 Micro Pollutants through Advanced Treatments for Reuse Applications." Water Science & Technology 63 (11):2486 97. doi:10.2166/ wst.2011.470.
Merle, T., J. S. Pic, M. H. Manero, and H. Debellefontaine. 2009. "Enhanced Bio recalcitrant Organics Removal by Combined Adsorption and Ozonation." Water Science & Technology 60 (11):2921 8. doi:10.2166/wst.2009.711. Norme NP T90 101. 2001. "Qualité de l'eau Détermination
de la demande chimique en oxygène." AFNOR.
Silverstein, R. M., G. C. Basler, and T. C. Morill. 1998. Identification Spectrométrique de Composés Organiques.
Paris, France: De Boeck University.
Soulier, C., V. Gabet, S. Lardy, K. Lemenach, P. Pardoni, M.
Esperanza, C. Miège, J. M. Choubert, S. Martin, A. Bruchet, M. Coquery, and H. Budzinski. 2011. Zoom Sur Les Substances Pharmaceutiques: Présence, Partition, Devenir En Station D'epuration. Techniques Sciences Et Méthodes(½}: 63 77. doi: 10.1051/tsrn/201101063
Ternes, T. A. 1998. "Occurrence ofDrugs in German Sewage Treatment Plants and Rivers." Water Research 32 (11):3245 60. doi:10.1016/S0043 1354(98)00099 2.
Volk, C., P. Roche, J. C. Jor et, and H. Paillard 1997. "Comparison of the Effect of Ozone, Ozone Hy drogen Peroxide System and Catalytic Ozone on the Biodegradable
Organic Matter of a Fulvie Acid Solution." Water Research 31
(3):650 6. doi:10.1016/S0043 1354(96)00302 8.
Wang, S. J., M. Jun, Y. X. Yang, J. Zhang, and T. Liang. 2011. "Degradation and Transformation of Organic Compounds in Songhua River Water by Catalytic Ozonation in the Presence of TiO 2 /Zeolite." Ozone: Science & Engineering
33 (3):236 42. doi:10.1080/01919512.201 l.560561.
Weber, W. J., and J. Carell Morris. 1963. "Kinetics of
Adsorption on Carbon from Solution." Journal of the