O
pen
A
rchive
T
OULOUSE
A
rchive
O
uverte (
OATAO
)
OATAO is an open access repository that collects the work of Toulouse researchers and
makes it freely available over the web where possible.
This is an author-deposited version published in :
http://oatao.univ-toulouse.fr/
Eprints ID : 18297
To link to this article :
DOI: 10.1109/ICC.2016.7510842
URL :
http://dx.doi.org/10.1109/ICC.2016.7510842
To cite this version : Lucciardi, Jean-Alain and Thomas, Nathalie and
Boucheret, Marie-Laure and Pouillat, Charly and Mesnager, Gilles Trade-Off
between spectral efficiency increase and PAPR reduction when using FTN
Signaling: impact of non linearities. (2016) In: ICC 2016 (International
Conference on Communications), 23 May 2016 - 27 May 2016 (Kuala Lumpur,
Malaysia).
Any correspondence concerning this service should be sent to the repository
administrator: [email protected]
Trade-Off Between Spectral Efficiency Increase
And PAPR Reduction When Using FTN Signaling:
Impact Of Non Linearities
Jean-Alain Lucciardi
∗, Nathalie Thomas
†, Marie-Laure Boucheret
†, Charly Poulliat
†and Gilles Mesnager
∗∗ Embedded Systems, IRT Saint-Exupery, Toulouse, France
Email: [email protected]
†University of Toulouse, INPT-ENSEEIHT/IRIT, Toulouse, France
Email: [email protected]
Abstract—Faster-than-Nyquist (FTN) signaling appears as an attractive method to improve spectral efficiency at the price of an increased complexity at the receiver. The receiver generally implements a turbo-equalization/detection scheme to benefit from all the promises of the FTN signaling. However, this is not the only limitation we have to deal with. Indeed, compressing in the time domain impact the emitted signal and it usually results in an increase of the envelope fluctuations. This leads to an inherent multi-objectives trade-off between performance, targeted spectral efficiency and limited Peak to Average Power Ratio (PAPR). The last aspect is crucial when considering a satellite communication link due to non-linear amplification effects that can occur on-board the satellite. Usually, FTN studies focus on spectral efficiency increase for a fixed modulation order, trying to trade-off between performance and PAPR properties. In this paper, we show that, for a given asymptotic spectral efficiency, we can compress low order modulations to increase the spectral efficiency of these schemes while controlling the PAPR increase to achieve a better PAPR than the non compressed scheme with a higher modulation order. Thus, for the same asymptotic spectral efficiency, we can achieve 1 dB gain in terms of PAPR and 2 dB gain in Bit Error Rate (BER) performances for a coded 8-PSK FTN system compared to a coded 16-APSK. For the same BER performances, the asymptotic spectral efficiency gain obtained in linear context is over 20 %, higher when non-linearities are taken into account.
I. INTRODUCTION
FTN signaling consists of a symbol compression in time domain to increase the spectral efficiency. In that case, the Nyquist criterion is not satisfied anymore, leading to inherent inter symbol interference (ISI) in the emitted signal. Using FTN signaling implies an increased complexity at the receiver that has to deal with the introduced ISI. This is usually achieved using equalization and decoding or improved sub-optimal scheme based on turbo-equalization. First investigated by Mazo for binary case and cardinal sine shaping pulses [1], the introduced ISI decreases the minimum euclidean distance when compression is over 25%, and thus it degrades the bit error rate. This compression threshold is often referred to as the Mazo limit. This limit also exists for Root Raised Cosine (RRC) shaping filters and scales with the excess bandwidth [2]. In this latter scheme, the emitter remains unchanged and
the RRC shaping filter offers a constant user bandwidth with a higher symbol rate, increasing the spectral efficiency.
When the compression is beyond this theoretical limit, Maximum Likelihood (ML) receivers such as Forney’s [11] and Ungerboeck’s [9] are used to enable sequence detection over the resulting ISI channel. An iterative symbol detection is necessary to obtain an interesting performance gain [3], hardly increasing the computation at the receiver. With the advents of reduced complexity turbo-equalization techniques [4], FTN has appeared as an attractive waveform candidate to improve spectral efficiency in both single-carrier and multi-carrier contexts over the last decade.
In this paper we study the interest of such waveforms for satellite communications when on-board non linearities are taken into account. By using FTN, for a given asymptotic spectral efficiency, we show that we can send the information with a lower modulation order while reducing the signal’s envelope fluctuations. We then obtain gains in terms of both BER performances and PAPR, resulting in more robust yet efficient waveforms in the non linear context.
The paper is organized as follows. Section II reviews the end-to-end FTN signaling system we are considering in this paper. Both emitter and considered receivers are described. Section III introduces on-board satellite non-linear amplifica-tion and shows the FTN signaling’s robustness against this phenomenon. Section IV gives a Bit Error Rate performances comparison of both FTN signaling and DVB-S2X signaling. Finally, finally in Section V, conclusions are given and some perspectives are drawn.
II. FASTER-THAN-NYQUIT SYSTEM AND NOTATIONS
A. Faster-than-Nyquist baseband signaling
At the transmitter, a binary message vector u ∈ FK2 is first
encoded into a codeword c ∈ FN2, where F2 is the binary
field, using an error correcting code of coding rate R = K/N . Convolutionnal coding (7,15) is applied. Each codeword c is then interleaved and mapped into NS M -ary complex
symbols a[k], k = 1 · · · Nsand finally pulse-shaped using FTN
signaling. Gray mapping is considered for M -PSK (M-ary Phase Shift Keying) modulations while quasi-Gray is adopted
for M -APSK (Amplitude-Phase Shift Keying) modulations. The FTN signaling consists in sending the coded complex symbols a[k] at an increased symbol rate Rs = T1
s =
1 αT
symbols per second while using a T -orthogonal pulse shaping filter h(t). In this paper, we consider RRC pulse shaping filters. The emitted FTN signal is given by
x(t) =X
k
a[k]h(t − kαTs) (1)
where a[k] denotes the set of emitted complex symbols. Tsis
the symbol period and α is the compression factor, α ∈ [0, 1]. Note that α = 1 corresponds to the classical Nyquist signaling. At the receiver end, x(t) is affected by an additive white Gaussian (AWGN) noise b(t) with Power Spectral Density (PSD) Sb(f ) = N0. The received signal is filtered by the
matched filter hr(t) = h∗(−t), where .∗denotes the conjugate.
The continuous received signal is given by
xr(t) = g ∗ x(t) + b0(t) (2)
where ∗ denotes the convolution operator, g(t) = h ∗ hr(t) is
a raised cosine function and b0(t) = hr∗ b(t). After sampling
at the symbol rate Rs, the Nyquist criterion is not satisfied
anymore since g(kαT ) 6= 0, ∀k ∈ INs. The discrete received
baseband signal is finally given by x[k] =X
j
a[k]g[k − j] + bc[k] (3)
where the equivalent discrete baseband channel response of length 2L+1 is given by g[k] = g(kαT ) and bc[k] is a centered
colored noise with auto-correlation Rbc[k] = N0g[k].
B. Symbol based MAP equalization
In this paper, we are interested in applying turbo-equalization based receivers that perform iteratively symbol based maximum a posteriori (MAP) detection and soft channel decoding [7]. Without lack of generality, we will consider trellis based symbol MAP detection. In our context, due to the colored noise after sampling at Rs, two approaches are
possible depending on the spectral properties of the colored noise. If spectral factorization is allowed (ie. the PSD of the noise has not null-values), then a whitening filter can be applied to the sampled signal given in equation (3). Data-whitening is only possible when the compression factor is above a given threshold (low compression regime). The new observation model for detection, often referred to as Forney’s model[11], is given as follows
y[k] =X
j
a[k]f [k − j] + w[k] (4) where fk is a causal equivalent whitened channel response
and w[k] is a centered AWGN with variance σ2
w= N0. Based
on this model, a classical symbol based MAP estimation can be applied using the BCJR algorithm [7]. The optimal Forney branch metric from a state m0 to a state m for the t−th section of the corresponding trellis is given in the log-domain by
γt(m0, m) ∝ |y[k] − +L
X
l=0
f [l]a[k − l]|2+ 2N0lnP (a[k]) (5)
Unfortunately, if the spectral factorization is not possible, one has to resort to the observation model as given initially in equation 3, often referred to as Ungerboeck’s model [9]. It has been proposed in [8] to apply the BCJR algorithm to this observation model by considering the underlying trellis and by applying the branch metric as proposed by Ungerboeck for this observation model in its seminal paper [9]. According to [8], the Ungerboeck’s branch metric computation for the model should be given in the log-domain by
γt(m0, m) ∝ Re(a∗[k + 1](x[k + 1] − 1 2a[k + 1]g[0] − L X l=1 g[l]a[k + 1 − l])) + N0lnP (a[k]) (6)
For practical considerations and especially for high order modulation, one often has to apply a truncation to the discrete channel response to avoid a prohibitive trellis complexity. This would be dependent on the roll-off and the compression factor. This leads to a sub-optimal detection with degraded perfor-mances compared to the ideal case. To define the order of the truncation, we define η the ratio between the discrete signal energy generated from the truncated channel response and the received noise-free discrete signal xk energy as follows:
η = | Pj=+L
j=−La[k]g[k − j]| 2
|x[k]|2 (7)
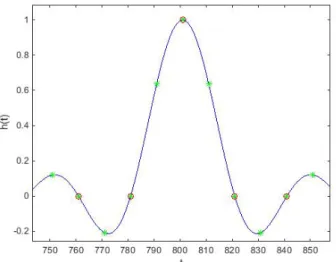
It will be used to define an order of truncation as illustrated in the following. Let us consider g(t) as a raised cosine with a 0.35 roll-off as the global filter of the transmission. Figure 1 illustrates the samples of the channel response gk for a
Nyquist signal and a FTN signal 50% compressed (α = 0.5): The number of states in the trellis depends on the order of the modulation M and the length of the truncated channel response 2L + 1.
Fig. 1. Truncated interferences for FTN signal with 0.5 compression factor (green) Vs Nyquist criterion (red).
Fig. 2. Number of channel taps necessary to achieve 95 % of the continuous domain’s energy with the discrete domain
Figure 2 gives, for different roll-offs, the necessary length of the channel response to achieve η = 95% as a function of the compression factor.
It can be noticed that the channel length to estimate correctly the emitted energy increases when the compression factor α or the roll-off decrease. These observations will be used in the following to set the length of the truncated channel model that will lead to an inherent mismatched decoding. But parameters will be set to limit the performance degradation.
III. ON SOME PRACTICAL BENEFITS OF
FASTER-THAN-NYQUISTSIGNALING FOR SATELLITE COMMUNICATIONS
In satellite communications, on-board amplification is a point of crucial interest since on-board amplifiers are often operating near the saturation. Thus, the introduced signal distortions can lead to the addition of some non linear in-terference that can degrade the bit error rate performances of the transmission, unless a sufficient input power back-off has been applied. More generally, a signal exhibiting high signal envelope fluctuations, usually captured in part by the PAPR, will be naturally more subject to these non linear distortions. For FTN signaling, the analysis of the impact of non-linearities becomes crucial since the time compression often implies an increase of the PAPR. The arising question is now the following: can we define a proper FTN scheme that can help to improve the end-to-end performance? (ie. not necessary to focus only on the spectral efficiency increase for a given modulation order). In the section, we first briefly review the non linear model we are considering. Then, we study the PAPR properties of the FTN and the impact of the non linearities on such a waveform.
A. Impact of non-linear amplification on-board the satellite for FTN
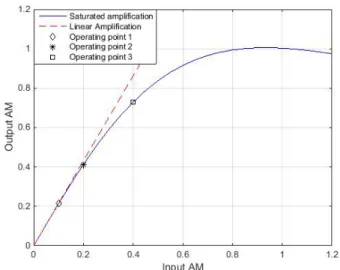
1) The Saleh model: Memoryless non-linearities in a satel-lite communication channel can be modelled using the Saleh’s model [6]. It gives non linear relations for both the amplitude and the phase distortions. Let x denote the input of the amplifier. Then, the output amplitude |y| and phase φ(y) can be written as |y| = αs1|x| 1 + βs1|x| 2, (8) φ(y) = αs2|x| 2 1 + βs2|x|2 (9) 2) Impact of non-linearities for usual and FTN modula-tions: Figure 3 highlights the impact of non-linearities on a compressed 4-PSK and a 16-APSK. The higher the modulation order is, the more important the degradation due to non-linearities is. Moreover, a compressed modulation also exhibit higher envelope fluctuations than the non compressed version of the same order. Applying FTN to increase the spectral effi-ciency should be balanced by the introduced signal envelope fluctuations and its impact when encountering non linearities. Thus, signal envelope fluctuations should be also compared to the non compressed scheme with the same spectral efficiency to observe a potential end-to-end improvement. The remaining open question is now: can we define a FTN signaling scheme with better signal envelope robustness compared to a non compressed one? We will see that by carefully selecting the order of the compressed modulation, we can achieve by time compression the same asymptotic spectral efficiency than a non compressed higher order modulation while gaining in PAPR. This will leads to a more robust yet efficient FTN scheme.
Fig. 3. Received constellation when linear (blue) and non-linear (red) amplification on FTN 4-PSK (left) and 16-APSK (right).
B. Study of Peak to Average Power Ratio (PAPR) The PAPR is defined as follows
PAPR = max(|x|
2
)
E(|x|2) (10)
When the PAPR is high, we have to increase the input power back-off (IBO) of the system to avoid signal distortions due to the amplifier.
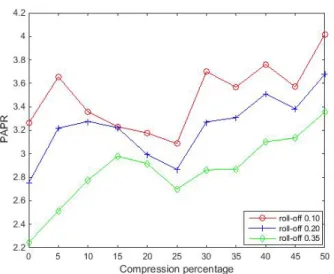
Fig. 4. PAPR for different roll-offs function of the compression percentage
The robustness of the signal against non-linearities depends on the emission filter and the inter-symbol interference introduced by the compression. A trade-off has to be found for the choice of the roll-off factor and the compression rate [β, α] of the FTN signal optimizing the complex envelope property. Figure 4 illustrates the evolution of the PAPR as a function of the roll-off factor and the compression rate. Two major conclusions appear:
• the higher the roll-off is, the lower the PAPR for a given
compresion rate is;
• For each roll-off, there exists a compression rate that is
optimal and that offers a reduced PAPR. C. Faster-than-Nyquist benefits
This study is motivated by the fact that FTN signaling with 8-PSK modulation can reach the spectral efficiency of DVB-S2X signaling’s higher order modulations. We first define the compression factor to achieve the same asymptotic spectral efficiency. Then, we compare the PAPR properties of equal asymptotic spectral efficiency FTN and DVB-S2X signals. We derive first the theoretical gain in terms of spectral efficiency offered by the FTN signaling. For the same spectral efficiency we also show that FTN transmissions allow the use of lower order modulations. The spectral efficiency of a communication system is defined by the ratio between the bit rate Rb and
the transmission bandwidth B. Considering a Square Root Raised Cosine shaping Filter with roll off factor β , a M -order modulation and the coding rate R , Γ is given by
Γ = Rslog2(M )R Bu(1 + β)
(11) where Rs denotes the symbol rate and Bu the useful filter
bandwidth. For a Nyquist transmission Bu is equal to Rs,
leading to
ΓDV B=
log2(M )R
1 + β (12)
When FTN signaling, the symbol rate is given by Rs
α = Bu
α ,
leading to the following spectral efficiency: ΓF T N =
log2( ˜M ) ˜R
α(1 + ˜β) (13)
where ˜M and ˜R respectively denote the order of the modula-tion and the coding rate of the FTN transmission. ˜β denotes the roll-off factor of the FTN transmission. For the same modulation and coding, the theoretical gain in terms of spectral efficiency offered by the FTN signaling is then given by
ΓF T N
ΓDV B =
1
α. But it is also possible to consider the same
spectral efficiency for FTN and DVB-S2 transmissions to define a compression factor like:
αiso=
(1 + β)log2( ˜M ) ˜R
(1 + ˜β)log2(M )R
(14) In that case FTN signaling allows the use of lower order modulations (such as 8-PSK instead of 16-APSK for example) to achieve the same spectral efficiency. The interest is now to design FTN-based waveforms with lower PAPR. Of course the price to pay in both cases is the introduction of inter-symbol interference to be canceled at the receiver.
We define four FTN signals with the same spectral effi-ciency than a DVB-S2X 16APSK, the compression rate for each roll-of factor is computed thanks to (14). The Table I gives the corresponding PAPR for each configuration:
TABLE I FTNCONFIGURATIONS. Configuration DVB-S2X FTN 1 FTN 2 FTN 3 FTN 4 Modulation 16APSK 8PSK 8PSK 8PSK 4PSK Code rate 1/2 1/2 1/2 1/2 1/2 Roll-off 0.10 0.10 0.20 0.35 0.20 Compression none 0.7500 0.6875 0.6111 0.4583 PAPR P AP R0 3.64 3.52 3.39 3.39 P AP R P AP R0 1 0.833 0.806 0.776 1.065 Gain (dB) 0.80 dB 0.95dB 1.10dB -0.28dB
For the same asymptotic spectral efficiency, a signal with the 8-PSK FTN method has a lower PAPR than the DVB-S2X/16APSK solution, e.g. between 0.8 dB and 1.1 dB gain. This result confirms the gain in terms of PAPR offered by some FTN configurations given by [5]. The three 8-PSK FTN configurations have the same spectral efficiency with different roll-off/compression parameters. The best PAPR is obtained for a higher roll-off with a more compressed signal. The last observation is the high PAPR for a 4-PSK highly compressed to obtain the 16-APSK spectral efficiency: it explains our choice of using 8-PSK based FTN scheme.
IV. FTN VSDVB-S2X,END-TO-END COMPARISON OF THE PERFORMANCES
We consider the scenarios defined in Section III. The three 8-PSK FTN configurations offer the same theoretical spectral efficiency than an usual 16-APSK. We will first compare the configurations at the same spectral efficiency in a linear channel context. In a second time we search for the maximum
achievable gain for spectral efficiency with an equivalent BER, still without non-linearities. Finally, we will operate the am-plifier at different amplification operating points, introducing non-linear distorsions in the channel.
A. Asymptotical iso-spectral efficiency comparison
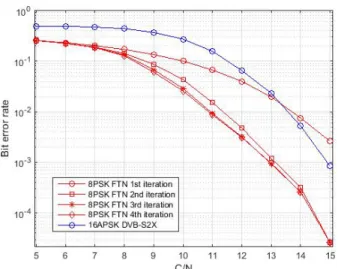
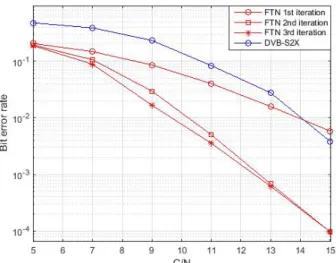
We compare in this paragraph the BER performed by 8-PSK FTN configurations defined in Table I. The iterative turbo-equalization is limited to three iterations. The three FTN signals offer an improved BER compared to the DVB-S2X link (Figures 5 to 7). The same BER as the 16-APSK is achieved with a 2 dB gain on the third iteration for our FTN scheme.
The second scenario in Figure 6 has better BER perfor-mances (0.5 dB gain) than the two other configurations (Figure 5 and 7). We added the 4th iteration to show that 3 iterations are enough. Considering its PAPR reduction (see Table I), it offers the best trade-off.
Fig. 5. BER - Scenario 1 - 8PSK FTN (compresison 0.75 - roll-off 0.10) Vs 16APSK DVB-S2X (roll-off 0.10).
B. Which gain in terms of spectral efficiency for a linear satellite channel ?
We improve the compression of the second scenario, with the 0.20 roll-off, for a 10 % and a 20% gain on the spectral efficiency.
Figure 8 shows that a 10 % gain can be achieved with only two turbo-equalization iterations and has still 1 dB BER gain performed. The configuration offers still a 0.75 dB gain in terms of PAPR reduction and the third iteration is still 2 dB better than the Nyquist 16-APSK.
Figure 9 shows that the 20 % gain configuration needs three turbo-equalization iterations with still a BER performance gain around 0.75 dB. The reduced PAPR gain is 0.70 dB.
C. Non-linear context simulations
The result of the AM/AM non-linearity applied to the different modulations in Section III explains the needs for the user to keep an important Input Back-Off (IBO). The
Fig. 6. BER - Scenario 2 - 8PSK FTN (compresison 0.69 - roll-off 0.20) Vs 16APSK DVB-S2X (roll-off 0.10).
Fig. 7. BER - Scenario 3 - 8PSK FTN (compresison 0.61 - roll-off 0.35) Vs 16APSK DVB-S2X (roll-off 0.10).
PAPR reduction of our 8-PSK FTN solution motivates our simulation of the previous scenario FTN 2 from Table I with non-linear amplification. Only amplitude distortions are considered, phase distortion is not implemented in this paper. The amplifier is operated at three different points highlighted in Figure 10. When nlinear amplification is applied on-board, the BER gains are over 4 dB (Figures 11 to 13). When spectral efficiency is increased by 10 % and 20 %, the BER performance gains are higher in the non-linear context (see Figure 14 and 15) than in the linear context (see Figure 8 and 9).
Table II summarizes the best BER Vs SNR performances gains obtained with the 8-PSK FTN signaling compared to an usual 16-APSK signaling. We operate the Saleh model at the second (10% gain) and the first (20% gain) operating points in non linear context.
Fig. 8. BER - 8PSK FTN Vs 16APSK DVB-S2X - 10% Gain .
Fig. 9. BER - 8PSK FTN Vs 16APSK DVB-S2X - 20% Gain.
V. CONCLUSION
The purpose of the paper was to find an alternative to high order modulations thanks to compressed lower order modulations based on FTN signaling, decreasing the signal’s sensitivity to the non-linear amplification. We can conclude from this study that a 8-PSK FTN signal can offer an increase of the spectral efficiency of satellite communications in the usual range of SNR when the trade-off roll-off / compression is addressed. The gain is higher when non-linear amplification are taken into account.
Further studies will be dedicated to FTN schemes enabling to reach the spectral efficiency of higher modulations such as 64-APSK to 256-APSK. Some other issues are the phase noise robustness and the synchronization of such waveforms.
REFERENCES
[1] J.E. Mazo, ”Faster than Nyquist Signaling”Bell Syst. Tech. J., vol. 54, pp, 1451-1462, Oct. 1975.
Fig. 10. Non-linear amplification - AM/AM response and 3 operating points
Fig. 11. BER - FTN 2 Vs 16APSK DVB-S2X - Operating point 1 (mean input = 0.10).
[2] A. D. Liveris, C. N. Georghiades, ”Exploiting Faster-Than-Nyquist Sig-naling”IEEE Transactions on Communications, Vol. 51, No. 9, Sept. 2003 [3] F. Rusek and J. B. Anderson, ”Constrained capacities for faster than Nyquist signaling”, IEEE Trans. Inf. Theory, vol. 55, no. 2, pp. 764-775, Feb. 2009.
[4] M. Loncar and F. Rusek, ”On Reduced-Complexity Equalization Based on Ungerboeck and Forney Observation Models”, IEEE Transactions on Signal Processing, Vol. 56, No. 8, AUG. 2008
[5] C. Le, M. Schellmann, M. Fuhrwerk and J. Peissig , ”On the Practical Benefits of Faster-than-Nyquist Signaling”, ATC 14
[6] Adel A. M. Saleh, ”Frequency-Independent and Frequency-Dependent Nonlinear Models of TWT Amplifiers”, Senior Member IEEE, IEEE Transactions on Communications, vol. com-29, No. 11, Nov. 1981 [7] L. R. Bahl, J. Cocke, F. Jelinek, and J. Raviv , ”Optimal Decoding of
Linear Codes for Minimizing Symbol Error Rate”, IEEE Transactions on Information Theory, March 1974
[8] G. Colavolpe and A. Barbieri, ”On MAP Symbol Detection for ISI Chan-nels Using the Ungerboeck Observation Model”, IEEE Communications Letters, Vol. 9, No. 8, Aug. 2005
[9] G. Ungerboeck, ”Adaptive Maximum-Likelihood Receiver for Carrier-Modulated Data-Transmission Systems”, IEEE Transactions on
Commu-Fig. 12. BER - FTN 2 Vs 16APSK DVB-S2X - Operating point 2 (mean input = 0.20).
Fig. 13. BER - FTN 2 Vs 16APSK DVB-S2X - Operating point 3 (mean input = 0.40).
nications, vol. COM-22, No. 5, May 1974
[10] F. Rusek, M. Loncar and A. Prlja, ”A Comparison of Ungerboeck and Forney Models for Reduced-Complexity ISI Equalization”, IEEE GLOBECOM 2007
[11] G. David Forney, ”Maximum-Likelihood Sequence Estimation of Digital Sequences in the Presence of Intersymbol Interference ”, Jr Member IEEE, IEEE Transactions on Information Theory, vol. IT-18, No. 3, May 1972
Fig. 14. BER - FTN 2 Vs 16APSK DVB-S2X - Operating point 2 (mean input = 0.20) - Gain 10%.
Fig. 15. BER - FTN 2 Vs 16APSK DVB-S2X - Operating point 1 (mean input = 0.10) - Gain 20%.
TABLE II
GAINS FORBERPERFORMANCES OBTAINED THANKS TOFTN SIGNALING.
Linear context Non-linear context
Iso Spectral Efficiency 2dB 4dB
10 % gain for Spec. Eff. 2dB 3.5dB 20 % gain for Spec. Eff. 0.7dB 1dB