© Imen Farhat, 2019
Inter-Provider Variation in Resource Use Intensity for
Elderly Injury Admissions : A Multicenter Cohort Study
Mémoire
Imen Farhat
Maîtrise en épidémiologie - avec mémoire
Maître ès sciences (M. Sc.)
Inter-Provider Variation in Resource Use Intensity for
Elderly Injury Admissions
A Multicenter Cohort Study
Mémoire
Imen Farhat
Sous la direction de :
Lynne Moore, directrice de recherche
Julien Clément, codirecteur de recherche
iii
Résumé
Les aînés (≥65 ans) représentent une proportion grandissante des admissions pour traumatismes. Cependant, on connait peu sur leur utilisation des ressources hospitalières. Pour améliorer les connaissances sur l’utilisation des ressources, nos objectifs étaient d’identifier les déterminants de l’utilisation des ressources, étudier la variation inter-hospitalière et évaluer l’association avec les résultats cliniques. Nous avons réalisé une étude de cohorte multicentrique en incluant tous les aînés admis dans le système de traumatologie du Québec (2013-2016) avec blessures traumatiques (N=16463) et avec fractures de fragilité (N=16721). Nous avons estimé l’utilisation des ressources avec la méthode de coûts basés sur les centres d’activité. Nous avons utilisé des modèles linéaires et logistiques multiniveaux pour nos analyses. L’utilisation des ressources augmentait avec l’âge et le nombre de comorbidités. La destination à la sortie de l’hôpital était aussi un important déterminant (soins longue durée vs domicile; blessures traumatiques; ratio de moyennes géométriques [RMG]=1,68; IC 95%=1,61-1,75; fracture de fragilité; RMG=1,28 IC 95%=1,24-1,32). L’utilisation des ressources ajustée variait significativement entre les hôpitaux. Cette variation était plus importante chez les patients avec des fractures de fragilité (coefficient de corrélation interclasse [CCI]=0,093; IC 95%=0,079-0,102) que chez ceux avec des blessures traumatiques (CCI=0,047; IC 95%=0,037-0,051). Les hôpitaux avec une plus importante utilisation des ressources avaient tendance à avoir une incidence plus élevée de mortalité (fracture de fragilité : coefficients de corrélation de Pearson [r]=0,41; IC 95%=-0,16-0,60) et de complications (blessures traumatiques : r=0,55; IC 95%=0,33-0,71; fracture de fragilité : r=0,54; IC 95%=0,32-0,70). Nos résultats suggèrent qu’il y a place à l’optimisation des ressources pour les aînés admis pour blessures. L’augmentation de mortalité et morbidité dans les hôpitaux utilisant plus de ressources pourrait être expliquée par la confondance résiduelle mais aussi par les effets indésirables reliés aux interventions ou aux journées d’hospitalisation potentiellement non-nécessaires. Ces hypothèses seront à confirmer lors d’études futures.
iv
Abstract
Elderly trauma admissions are increasing exponentially. However, little is known about resource use for this population. To advance knowledge on resource use and its optimization, our objectives were to identify resource use determinants, assess inter-hospital variation in resource use, and examine the impact of hospital resource use on patient outcomes for elderly injured patients. We conducted a multicenter cohort study of elders (≥65 years) with trauma (N=16,463) and with fragility fractures (N=16,721) admitted in the Québec trauma system (2013-2016). We estimated resource use with activity-based costing. We used intraclass correlation coefficients (ICC) to examine inter-hospital variation in resource use, multilevel linear models to identify determinants, and Pearson correlation coefficients (r) to assess the impact of resource use on patient outcomes. Resource use increased with age and the number of comorbidities for both groups. Patients discharged to long-term care had higher resource use than those discharged home (geometric mean ratio [GMR]=1.68; 95% CI [1.61, 1.75] for trauma and GMR=1.28; 95% CI [1.24, 1.32] for fragility fractures). Risk-adjusted resource use varied significantly across trauma centers for elderly patients. There was greater variation for elders with fragility fractures (ICC=0.093; 95% CI [0.079, 0.102]) than with trauma (ICC=0.047; 95% CI [0.035, 0.051]). Trauma centers with higher risk-adjusted resource use tended to have a higher incidence of mortality (r=0.41; 95% CI [0.16, 0.60]) for fragility fractures and complications for trauma (r=0.55; 95% CI [0.33, 0.71]) and for fragility (r=0.54; 95% CI [0.32, 0.70]). Our results suggest that there is room for resource use optimisation for elders admitted for injuries. The observed increase in mortality and morbidity in hospitals with higher resource use might be due to residual confounding but could also be due to adverse effects of potentially unnecessary interventions and hospitals stays. These hypotheses need to be confirmed in future studies.
v
Table of Contents
Résumé ...iii
Abstract ... iv
Table of Contents ... v
List of Tables ... viii
List of Figures ... ix
List of Acronyms ...x
Acknowledgements ... xi
Foreword ... xii
Introduction ... 1
Chapter I. Literature Review ... 3
1.1 Financial burden of Canadian healthcare... 3
1.2 Aging population of Canada ... 3
1.3 Injuries in elders ... 4
1.4 Efficiency of health care ... 4
1.5 Trauma systems ... 5
1.6 Estimating resource use ... 6
Chapter II. Objectives and Hypotheses ... 7
2.1 Objectives ... 7
2.2 Hypotheses ... 7
Chapter III. Methods ... 8
3.1 Conceptual model ... 8
3.2 Study design ... 8
3.3 Study population ... 8
3.4 Study data ... 9
3.5 Resource use estimation ... 9
vi
3.6.1 Objective 1: Identify patient and hospital determinants of resource use intensity
10
3.6.2 Objective 2: Estimate inter-hospital variation in resource use intensity ... 11
3.6.3 Objective 3: Evaluate the association between resource use intensity and quality of care 11 3.6.4 Missing data ... 12 3.6.5 Multilevel regression ... 12 3.6.6 Sensitivity analysis ... 13 3.7 Sample size ... 13 3.8 Ethical considerations ... 13
Chapter IV. Inter-Hospital Variation in Resource Use for Injured Elderly Patients in a Canadian Integrated Trauma System: a Retrospective Multicenter Cohort Study ... 15
Résumé ... 17
Mini-Abstract ... 18
Structured Abstract ... 19
INTRODUCTION ... 21
METHODS ... 23
Study design, Study population, and setting ... 23
Data Sources ... 23 Primary outcome ... 24 Potential determinants ... 25 Secondary outcomes ... 25 Statistical Analyses ... 26 Sensitivity Analyses ... 27 RESULTS... 29 Study population ... 29 Resource use ... 29 Determinants ... 29 Inter-hospital variation ... 30
Correlation between hospital resource use and clinical outcomes ... 30
Sensitivity Analyses ... 31
DISCUSSION ... 33
Strengths & Limitations ... 34
vii REFERENCES ... 38 Chapter V. Discussion ... 50 5.1 Internal validity ... 50 5.1.1 Selection bias ... 51 5.1.2 Information Bias ... 51 5.1.3 Residual confounding ... 53 5.2 External validity ... 55
5.3 Implications for Public Heath and future studies ... 55
Conclusion ... 57
References ... 58
APPENDIX ... 63
APPENDIX 1: Conceptual model (directed acyclic graph) ... 63
APPENDIX 2: Flow diagram ... 64
APPENDIX 3: Quebec trauma care continuum ... 65
viii
List of Tables
Table 1: Resource use determinants for patient with trauma and fragility fractures. ... 41 Table 2: Between-hospital variation in resource use by study population and activity center
... 44 Table 3: Association between resource use and in-hospital mortality & complications ... 45 Supplemental Content 1: Median resource use and for trauma and fragility fractures
according to patient and treatment characteristics ... 47 Supplemental Content 2: Sensitivity analysis for association between resource use and
ix
List of Figures
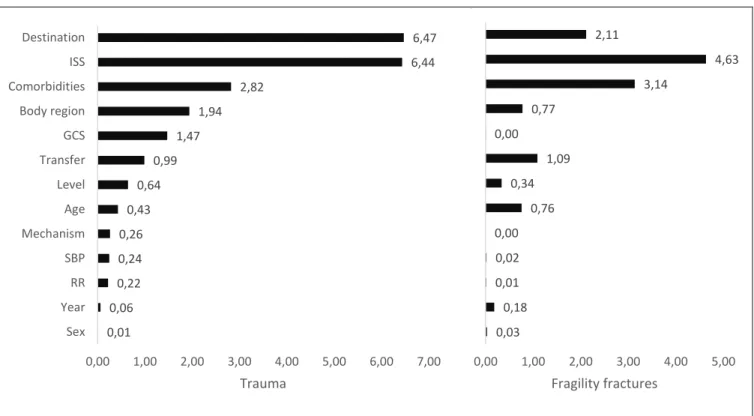
Figure 1: Relative effect size (Cohen’s f2, %) of resource use determinants for trauma (left)
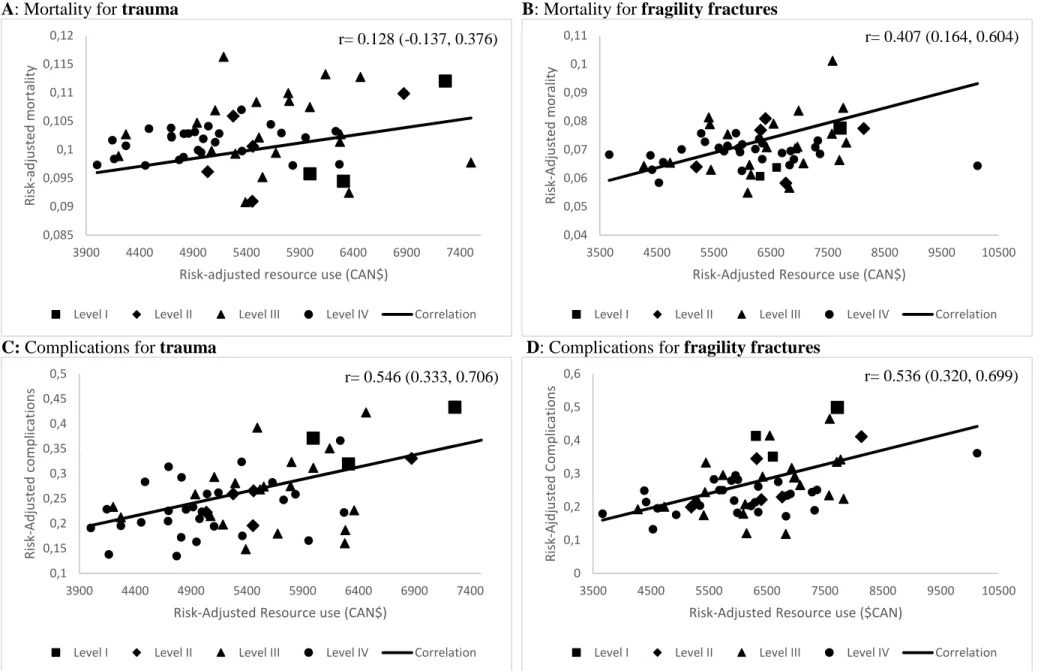
and fragility fractures (right) ... 43 Figure 2: Correlation of resource use and mortality and complications... 46
x
List of Acronyms
ABC Activity-based costing AIS Abbreviated Injury Scale Can$ Canadian Dollar
CCR Ratio of Cost to Charge CI Confidence interval DRG Diagnosis-related groups ED Emergency Department VIF Variance Inflation Factor
GRADE Recommendations Assessment, Development and Evaluations guidelines.
GCS Glasgow Coma Scale GDP Gross Domestic Product GMR geometric mean ratio
HIV/AIDS Human Immunodeficiency Virus infection and Acquired Immune Deficiency Syndrome
IC Intervalle de confiance
ICC Intraclass correlation coefficient
ICD-10 International Statistical Classification of Diseases and Related Health Problems 10th Revision.
ICU Intensive Care Unit
INESSS Institut National d’Excellence en Santé et en Services Sociaux ISS Injury Severity Score
MCMC Markov Chain Monte Carlo
MED-ÉCHO Maintenance et exploitation des données pour l’étude de la clientèle hospitalière
r Pearson’s correlation coefficient RMG ratio de moyennes géométriques RR Respiratory rate
RTQ Registre des traumatismes du Québec (Québec trauma registry) SAS Statistical Analysis System
SBP Systolic Blood Pressure
SP-POS Santé des populations et pratiques optimales en santé TAC Trauma Association of Canada
xi
Acknowledgements
I would like to thank my supervisor Dr. Lynne Moore for the support and guidance she has provided throughout my time as her student. I thank you for the opportunity to be part of your team, for your time, kindness and encouragement. You have set an example of excellence as a dedicated researcher and a passionate teacher.
I am grateful to my co-supervisor Dr. Julien Clément for his support, time and clinical expertise. Your insights are highly valued.
I would also like to thank the team at Hôpital de l’Enfant Jésus: Amina, Pier-Alexandre, Xavier for all the support, help and advice they provided. I thank Amina for being my motivator, Pier-Alexandre for making me a more critical thinker, and Xavier for furthering my analytical abilities.
I would also like to thank my colleagues Marie-Pier, Jasmine, Coralie, Valérie and Khadidja for their friendships and their constructive comments and feedbacks.
I am thankful for my husband Amine, for his love, support, and sacrifices that made this thesis possible.
I thank my parents Abdeljelil and Ouahida, and my siblings Asma, Oussama, Fatima and Aicha for their support, encouragement, and love. I could not have done it without you. Finally, I am grateful to the Axe santé des populations et pratiques optimales en santé optimal (SP-POS) for awarding me the SP-POS travel scholarship which allowed me to present results from this thesis in Toronto at the annual meeting of the Trauma Association of Canada.
xii
Foreword
This thesis has been written for my master’s degree in epidemiology under the supervision of Dr. Lynne Moore. Chapter IV consists of the article “Inter-hospital variation in resource use for elderly injury admissions in a Canadian integrated trauma system: A retrospective multicenter cohort study” that will be submitted for publication to the medical journal Annals of Surgery. This article provides information on drivers of resource use for elders admitted after an injury in an inclusive trauma system and on unwarranted inter-hospital resource use variation and its association with patients’ clinical outcomes. I reviewed the literature, performed data analyses, and wrote the article and this thesis. Coauthors of the article are Lynne Moore, Teegwendé Valérie Porgo, Marie-Pier Patton, Pier-Alexandre Tardif, Catherine Truchon,Henry T. Stelfox,Belinda J. Gabbe,François Lauzier,Alexis F. Turgeon andJulien Clément.
I presented results from this article at the following local, provincial and national scientific meetings:
Journées de la recherche, CHU de Québec-Université Laval in Québec City on May 24, 2017
4ème Journée de la recherche des étudiants de l’axe Santé des populations et pratiques
optimales en santé (SP-POS) in Québec City on June 1, 2017
Journée Phare 2017, Congrès québécois en sciences de la santé,9e Édition in Bromont on November 3, 2017
Colloque annuel de traumatologie, CHU de Québec-Université Laval in Québec City on February 15, 2018
Trauma Association of Canada Annual Scientific Meeting and Conference in Toronto on February 22, 2018
86e Congrès de l'ACFAS in Chicoutimi on May 11, 2018
Institut national d’excellence en santé et services sociaux in Québec City on May 18, 2018
Journées de la recherche en santé 2018-Université Laval in Québec City on May 24, 2018
5ème Journée de la recherche des étudiants de l’axe SP-POS in Québec City on June
8, 2018
My abstracts ranked among the 10 bests at 4ème journée and 5ème Journée de la recherche des étudiants de l’axe SP-POS. I also received the prize for best scientific communication at
xiii
Journées de la recherche en santé 2018 and at 5ème Journée de la recherche des étudiants de
1
Introduction
Motor vehicle collisions, burns, drowning, falls, poisonings and acts of violence against others or oneself are considered preventable injuries.1 Nine percent (5 million deaths/year) of the world deaths are due to preventable injuries, thus surpassing the number of fatalities caused by HIV/AIDS, tuberculosis and malaria combined.1 In Canada, they are the 5th cause of hospitalization (231,596 Canadians hospitalized and 3.5 million emergency room visits per year).2, 3 In 2010, injuries killed 15,866 Canadians and partially or permanently disabled 60,000 others.3 Preventable injuries cost yearly more than Can$ 26.8 billion (Can$ 15.9 billion in direct costs and Can$ 10.9 in indirect costs) in Canada and around Can$5.7 billion (Can$3.6 billion in direct costs and Can$2.1 billion in indirect costs) in Quebec.3 It is expected that by 2035, the cost of preventable injuries will exceed Can$ 75 billion.3 Population aging is a reality facing the Canadian healthcare system. The proportion of Canadians aged 60 and older is expected to grow from 17% of the total population in 2001 to 29% in 2031.4 This change in population demographics is expected to impact trauma
care and injury costs.3 Elderly (aged ≥ 65 years old) trauma patients have higher mortality,
more complications, and greater resource use than their younger counterparts with similar injuries.5
Despite the important financial and human burden of elderly injury admissions, there exists an important knowledge gap on resource use intensity in this population. Overuse of available medical resources decreases the efficiency of the health care system and increases cost and patients’ risk of complications and mortality.6-8 Moreover, there is evidence that
providers who spend more do not have better patient outcomes.9 With the population aging and faced with limited resources, there is an urgent need to identify ways to optimize resource use for these patients. Evaluating unwarranted inter-hospital variation in resource use and identifying patient and hospital determinants of resource use for elderly trauma admissions are essential to improving healthcare efficiency and decreasing the costs of injury. Given that unnecessary tests, interventions and hospital days increase patient
2
mortality and morbidity, improvements in resource use efficiency also have the potential to improve patient outcomes.10
3
Chapter I. Literature Review
1.1 Financial burden of Canadian healthcare
Canadian health expenditure increased from Can$12 billion in 1975 to reach Can$ 242 billion in 2017.11-13 Since the early 2000s, between 35% and 40% of provincial budgets have been spent on medical care.12 Hospitals account for the largest share of health spending with 28.3%, followed by drugs (16.4%) and physician services (15.4%).13 Under the Canadian Health Act, the public sector is responsible for most in-hospital services. Public-sector funding accounts for around 70% of total healthcare expenditure whereas out-of-pocket spending accounts for around 14.8%.13 In 2015, estimated out-of-pocket
expenditure reached Can$ 902 per person, an increase of Can$ 624 compared to 1988.13
Healthcare spending increased at an unsustainable pace between 2001 and 2016.14 It is estimated that from 2014 to 2019, aging will increase health spending by $2 billion per year.12
1.2 Aging population of Canada
Canadians aged 65 and older represent 16% of the total population but account for almost 46% of public-sector health care spending.12 The proportion of Canadians aged 60 and older is expected to grow from 17% of the today’s total population to 29% in 2031.4 Seniors
are a diverse group and their health care costs increase exponentially with age due to a higher risk of comorbidity and complications.6, 12 In 2014, healthcare expenditure was estimated to around Can$ 4,800 for people 65-69 years of age and around Can$ 28,000 for those over 89 years of age.13 Although baby-boomers are expected to be healthier than the
generations before them, aging represents an important driver of health care cost due to, first the exponential growth of this population, and second, their high activity levels and thus, higher injury risks.4, 12
4
1.3 Injuries in elders
In the UK, the proportion of major trauma patients aged 75 increased from 8 to 27% between 1990 and 2013, while the proportion of those under 25 decreased from 39% to 17% for the same period.15 This trend is seen in the majority of industrialized countries including Canada.3, 15 Although seniors represent only around 16% of the total population, they account for 44% of all injury hospitalizations.3 Average hospital resource use due to injuries increased by 29% for elders in 2010 compared to 2004.3 Falls represent the most common injury necessitating hospitalization among seniors.16 In 2004, Canadians aged over 65 years old accounted for 59% of hospitalizations and 84% of deaths from falls.17 Moreover, seniors who are hospitalized because of falls spent an average of 3 weeks in hospital, which is three times higher than the average hospital stay in Canada among all ages.16 The cost (per capita) of falls among seniors is 3.7 times higher than the cost among adults aged 25-64.17 As the population ages, the number of seniors suffering from injuries is expected to rise exponentially.3 Moreover, injured elders have higher mortality and morbidity associated with their injuries compared to their younger counterparts. 5
1.4 Efficiency of health care
In addition to being safe, effective, patient-centered, timely and equitable, a quality health care system should be efficient.18 Efficiency is defined as the prevention of waste (mainly in equipment, energy, and supplies).18 However, many developed countries lack efficiency in their health care system, leading to suboptimal patient outcomes.6, 7, 19, 20 A systematic review revealed that rates of inappropriate use of beds are higher for elders than for the general population.19 There is also evidence that the length of stay in acute inpatient care is prolonged up to 20% for elderly patients due to delays in medical and nonmedical services.20 Overuse of available medical resources decreases the efficiency of the health care system and increases cost and patients’ risk of complications and mortality.6, 7 To
improve efficiency and effectiveness, stakeholders urgently require data on resource use variations and their impact on quality of care.4
5
1.5 Trauma systems
A trauma system is a network of facilities that offer care for all injured patients.21 A comprehensive and inclusive trauma system is a preplanned, organized, and coordinated injury control effort in a defined geographic area.22 It is comprised of different elements (administrative, surveillance, prevention, clinical, training, and research) working in harmony.22 In exclusive trauma systems, only a few highly specialized hospitals are designated as trauma centers, whereas in inclusive trauma systems, a network of hospitals with different levels of specialization provide trauma care.23 Similar to the US and Australia, Canadian trauma centers in inclusive systems are designated into one of four levels:21, 22, 24
- Level IV: primary trauma care facilities that provide general surgery and anesthesia, usually located more than 30 minutes away from a secondary or tertiary trauma care and services center.
- Level III: secondary trauma care centers that offer general surgery, orthopedic care, critical care and early rehabilitation.
- Level II: secondary trauma care centers that offer specialized and highly specialized trauma care, neurosurgery, specialized intensive care and early interdisciplinary rehabilitation.
- Level I: expert care centers for specific types of trauma. They provide expert care for victims of spinal cord injuries, severe burns or individuals who require emergency re-implantation microsurgery.
(For more information see APPENDIX 3)
It is estimated that trauma centers reduce mortality by 30% during the first 48 hours following injury compared with non-trauma centers.25 Moreover, inclusive trauma systems reduce mortality compared to exclusive trauma systems.26 A meta-analysis found that the establishment of inclusive trauma systems in North-America reduced mortality by 15% among severely injured patients.27
6
1.6 Estimating resource use
The most widely used methods for estimating resource use in healthcare settings are the ratio of cost to charge (CCR), diagnosis-related groups (DRG) and activity-based costing (ABC). The ratio of cost to charge is largely used in for-profit healthcare systems and estimates cost using hospital charges.28 However, this method can often under or over-estimate cost and it is not reliable in evaluating costs for individual patients.28 Diagnosis-related groups is common in universal health care systems and uses a standardized grid of average cost per patient based on the patient’s principal diagnosis.29 DRG underestimates cost in trauma patients since it does not account for multiple injuries.30, 31 Moreover, this method does not allow for inter-hospital comparisons because of standardization.29, 31 Activity-based costing has been shown to be the most accurate and precise method of the three mentioned above for estimating costs in healthcare systems.32-35 Activity-based costing involves multiplying the unit costs of specific activity centers by the corresponding units of resources used (e.g. hours in the operating room, days in intensive care unit (ICU)). It is useful for policy-makers and hospital administrators because it relates costs to activities, thereby providing information that is actionable.32-36 Moreover, it provides an estimate of resource use intensity in accordance with the Grading of Recommendations Assessment, Development and Evaluations (GRADE) guidelines. 32-38
To illustrate the use of activity-based costing in health care system, we provide the following simplified example: According to the 2016 Health Ministry data (APPENDIX
4), an hour in the emergency department (ED) costs $65, a day in the intensive care unit
$1451, a day in a regular ward bed $365, an hour of physiotherapy $97, and a magnetic resonance imaging $99.39 A patient who waits 2 hours in the ED, spends 2 days in the ICU, 4 days in a regular ward bed, and receives 2 hours of physiotherapy and one magnetic resonance imaging would generate acute care costs of (65x2) + (1451x2) + (365x4) + (97x2) + 99 = $4,785.
7
Chapter II. Objectives and Hypotheses
2.1 Objectives
The main goal of our study was to evaluate the association between hospital resource use intensity and clinical outcomes for elderly (≥65 years old) trauma patients in an inclusive trauma system. We achieved this goal with three specific objectives:
1. Identify hospital and patient drivers of resource use; 2. Evaluate inter-hospital variations in resource use; and
3. Evaluate the association between hospital resource use intensity and clinical outcomes.
2.2 Hypotheses
Our a priori hypotheses were as follows:
High resource use is driven by patient determinants such as age, comorbidities, region and severity of injury and by hospital determinants such as trauma center designation level
Resource use intensity varies significantly among trauma centers for elderly injury admissions, even after adjustment for patient case mix
8
Chapter III. Methods
3.1 Conceptual model
The Donabedian quality of care model states that high quality on hospital structure leads to high quality on clinical processes, which in turn improves patient outcomes.40 These associations have been demonstrated in acute injury care in multiple studies.40-45 The conceptual model for this study is based on an extension of the Donabedian quality of care model. Our directed acyclic graph is presented in (APPENDIX 1).
3.2 Study design
To reach the objectives of this study, we conducted a retrospective multicenter cohort study based on the integrated provincial trauma system of Quebec, Canada (2013-2016). The Quebec trauma system was instated in 1993 and encompasses 59 trauma centers with 5 level I (including 2 pediatric), 5 level II, 21 level III, and 28 level IV centers.
3.3 Study population
We included all elderly patients (≥65 years old) admitted to any of the 57 adult trauma centers, between April 1, 2013 and March 31, 2016, in the province of Quebec according to the inclusion criteria of the Quebec trauma registry: death due to injury, intensive care unit admission, hospital stay ≥3 days or transfer from another hospital.
We excluded patients with isolated burns as well as patients who were dead on arrival, arrived without vital signs and were pronounced dead within 30 minutes or left against medical advice. When estimating resource use, we excluded in-hospital deaths as resource use is right-censored for this population. However, we performed sensitivity analyses using competitive risks models to evaluate the impact of this exclusion criteria.
We performed all analyses separately for patients with fragility fractures and patients with trauma.46, 47 The fragility fracture cohort was defined as patients who sustained isolated (no other injuries with an AIS > 2) fractures to their extremities due to a fall from a standing
9
height or less identified using the following ICD-10 e-codes: W00, W01, W05, W06, W07, W08, W18. All patients without fragility fractures were included in the trauma cohort.
APPENDIX 2 presents the flow diagram of the population.
3.4 Study data
Trauma admissions data was extracted from the Quebec trauma registry.48 The high quality of data in the registry is ensured by quality assurance protocols that include electronic forums of coding queries and yearly training for medical archivists.
The provincial hospital discharge database (MED-ÉCHO)49, which contains administrative and clinical data for all hospital admissions in Quebec, provided information on comorbidities.
We estimated resource use according to the activity-based costing method using the 2016 cost database (AS-471) provided by the Ministère de santé et services sociaux du Québec.39
3.5 Resource use estimation
We estimated resource use with activity-based costings using 2016 Health Ministry data (APPENDIX 4). Units of costs per activity center were standardized using the average cost for level I trauma centers. We computed time spent (units of resource used) in the operating room, the intensive care unit and the general ward using dates and times of entrance and exit in the registry. After consultation with the scientific committee, missing time of entrance and exit from different activity centers was imputed systematically to the nearest work shift starting and ending time. The number of units used of para-clinical services (psychological consultation, ergo-therapy, physiotherapy and respiratory therapy) and imagery was also obtained using the registry. Finally, resource use in the emergency department was accounted for with the mean cost per visit.
3.6 Data analyses
All analyses were performed with the Statistical Analysis Software SAS (SAS Institute, Cary, NC, version 9.4). Statistical significance was set at α=0.05 (bilateral).
10
Activity-based costs have a right-skewed distribution. Thus, we described them using the median and modelled a natural logarithmic transformation using log-linear models. Assumptions of this model are as follows: First, the independence assumption: Observations on the outcome variable must be independent. By design, this is not respected since patients admitted to the same trauma centers are more likely to have similar outcomes (activity-based costs) than patients in different trauma centers. This issue has been resolved with multilevel modeling allowing us to adjust for correlation within clusters (trauma centers). We discuss multilevel models further in section 3.5.5. Second, the normality
assumption: The dependent variable must be normally distributed which means that for
any fixed value of X, Y ~ N (α + βX, σ2). This is not the case in our study. However, the log transformation of resource use has a normal distribution and is used in our analyses. This assumption was verified using the quantile-quantile (Q-Q) plot of studentized residuals. Third, the linearity assumption states that independent continuous variables included in the model should have a linear association with the dependent variable (log transformation of resource use). We tested if our dependent variable [ln(resource use)|X)] had a linear relationship with independent variables by plotting each continuous variable against the studentized residuals of the model. When the linearity assumption was not respected, the independent variable was introduced using clinically plausible categories. Fourth, the homoscedasticity assumption: For any fixed value x of X, the variance Var(Y) is constant. Potential heteroscedasticity was evaluated visually by plotting studentized residuals against (i) independent variables and (ii) mean predicted values. We did not detect heteroscedasticity for any variable tested. Fifth and finally, the lack of collinearity between variables. Multicollinearity occurs when variables are redundant. We tested for this assumption with the variance inflation factors (VIF). All VIF were < 10 which meant that there was no multicollinearity between independent variables.
3.6.1 Objective 1: Identify patient and hospital determinants of
resource use intensity
We assessed the association between potential determinants and resource use using a multilevel log-linear model with a random intercept on trauma center to control for the potential correlation between patients treated in the same center. Geometric mean ratios
11
(GMR) and 95% confidence intervals (CI) were used to describe the association between each independent variable and resource use. We used two models to generate GMRs: The first model only included variables describing patient risk factors on arrival (age, sex, number of comorbidities, body region with the most severe injury, injury severity score, Glasgow coma scale, systolic blood pressure, respiratory rate and mechanism of injury). The second model included all potential variables. To evaluate the local effect size of each variable in determining resource use, we used Cohen’s f2.50 Cohen’s f2 can be seen as the
proportion of variation in the dependent variable accounted for by the independent variable.50, 51
3.6.2 Objective 2: Estimate inter-hospital variation in resource use
intensity
We assessed inter-hospital variation using a log-linear model including patient-level risk factors (age, sex, number of comorbidities, body region with the most severe injury, injury severity score, Glasgow coma scale, systolic blood pressure, respiratory rate and mechanism of injury) as fixed effects and trauma center as a random intercept. We used intraclass correlation coefficients (ICC) along with 95% CI to evaluate inter-hospital variations in resource use.52, 53 CIs were estimated using the bootstrap percentile method.
54-56 We also estimated and plotted risk-adjusted mean resource use by trauma center using
shrinkage estimates.57 Shrinkage estimates are obtained by shrinking coefficients toward
the global mean by a factor that is inversely proportional to sample size.58 This method
accounts for regression-to-the-mean bias and inflation of the type I error due to multiple comparisons and improves the precision of estimates for hospitals with low volume. 59
3.6.3 Objective 3: Evaluate the association between resource use
intensity and quality of care
We used shrinkage estimates generated by multilevel logistic models to estimate the adjusted incidence of in-hospital mortality and complications.57 We used validated risk-adjusted models for mortality and complications60 that included variables describing physiological reserve (age, sex, and number of comorbidities), physiological reaction to
12
injury (systolic blood pressure, respiratory rate and Glasgow coma scale), anatomical injury severity and transfer status. We assessed all assumptions of logistic models (independence, linearity and the absence of multicollinearity).61 The associations between risk-adjusted hospital resource use and the risk-adjusted incidence of mortality and complications were assessed using Pearson’s correlation coefficient (r) and 95% CI weighted by mean annual hospital volume. We used the arcsine transformation on all proportions to stabilize the variance since they do not follow a normal distribution.62
3.6.4 Missing data
Around 49 % of patients in the trauma group and 67% of patients in the fragility fracture group had missing data on at least one physiological variable (Glasgow coma scale, systolic blood pressure and respiratory rate).43, 63, 64 We stipulate that data are missing at random, which means that variables explaining the mechanism of missing data are available and can be included in the imputation model. Although it is impossible to verify this assumption, qualitative analysis revealed that Glasgow coma scale is mainly missing in patients with minor extra-cranial trauma or patients sedated and/or intubated upon arrival. The latter is rare in Québec as pre-hospital services only perform basic life support. Simulation studies evaluating multiple imputation in trauma registries have observed valid effect estimates when imputation is used to simulate missing data on adjustment variables (Glasgow coma scale, systolic blood pressure and respiratory rate). Thus, we simulated missing data with multiple imputation using the Markov Chain Monte Carlo method with a single chain.64, 65 Based on the fraction of missing data, we imputed every missing value
49 times for patients with trauma and 67 times for patients with fragility fractures in a model where all the independent and dependent variables were considered.63-66 We used separate imputation models for each analysis model.
3.6.5 Multilevel regression
Our study included patients treated in 57 trauma centers (groups). Patients treated in the same hospital are also more likely to have similar outcomes compared with patients treated in different hospitals. One way to control this correlation in analyses is to use multilevel linear regression which models the mean as a mix of random and fixed effects.67, 68 Random
13
effects account for the correlation between observations nested in clusters by allowing the intercept (α) to vary for each cluster. Therefore, we modeled trauma center as a random effect and patient-level risk factors as fixed effects.
3.6.6 Sensitivity analysis
We conducted sensitivity analyses to evaluate the influence of simulating missing data (compare results generated with and without multiple imputation), excluding deaths (including deaths in a competitive risk model) and incomplete acute stay (excluding patients transferred out to another acute care hospital). We also stratified analyses for potential modifying factors identified a priori: trauma center designation level (I to IV) and activity center (ward, operating room, intensive care unit, para-clinical services).
3.7 Sample size
To assess sample size adequacy, we used the rule of thumb originating from a simulation study done by Kreft and colleagues.69 We have around 13 independent variables and 57 groups (trauma centers) in our models. To estimate the sample size, it is recommended to have at least 20 observations per independent variable for multiple linear regression70 and
10 observations per independent variable for logistic regression.71 However, since we are using multilevel regression models, a common rule of thumb is to have at least 30 groups and 30 observations per group.72 We have 57 groups and a total of 33,184 observations. The number of observations was < 30 in only 2 groups. However, we used shrinkage estimates to account for the small size of these groups.
3.8 Ethical considerations
The study is part of a large research project funded by the Canadian Institute of Health Research (PASS competition; grant #358052) and the Fonds de recherche du Québec – santé (grant #112775). The project received ethical approval from the research ethics committee of the Centre hospitalier universitaire (CHU) de Québec and the Commission d’accès à l’information du Québec.
14
The project has been designed and conducted in close collaboration with key stakeholders including INESSS, the Trauma Association of Canada (TAC), and Accreditation Canada.
15
Chapter IV. Inter-Hospital Variation in Resource Use
for Injured Elderly Patients in a Canadian Integrated
Trauma System: a Retrospective Multicenter Cohort
Study
Authors:
Imen Farhat BSc,1,2 Lynne Moore PhD,1,2 Teegwendé Valérie Porgo MSc,1,2 Marie-Pier Patton BSc,1,2 Pier-Alexandre Tardif MA MSc,1,2 Catherine Truchon PhD,3 Henry T. Stelfox MD PhD FRCPC,4 Belinda J. Gabbe PhD,5 François Lauzier MD MSc FRCPC,2,7 Alexis F. Turgeon MD MSc FRCPC,1,2,8 Julien Clément MD FRCSC3,9
1Department of Social and Preventive Medicine, Université Laval, Québec (QC), Canada; 2Axe Santé des Populations et Pratiques Optimales en Santé (Population Health and
Optimal Health Practices Research Unit), Traumatologie – Urgence - Soins intensifs (Trauma – Emergency – Critical Care Medicine), Centre de Recherche du CHU de Québec (Hôpital de l’Enfant-Jésus), Université Laval, Québec (QC), Canada;
3Institut national d’excellence en santé et en services sociaux (INESSS), Québec (QC),
Canada;
4Departments of Critical Care Medicine, Medicine and Community Health Sciences,
O’Brien Institute for Public Health, University of Calgary, Calgary (AB), Canada;
5School of Public Health and Preventive Medicine, Monash University, Melbourne,
Australia
7Department of Medecine, Université Laval, Québec (QC), Canada;
8Department of Anesthesiology and Critical Care Medicine, Division of Critical Care
Medicine, Université Laval, Québec (QC), Canada;
9Department of Surgery, Université Laval, Québec (QC), Canada;
Corresponding author and address for reprints:
Imen Farhat
CHU de Québec – Université Laval Research Center (Hôpital de l’Enfant-Jésus)
Population Health and Optimal Health Practices Research Unit, Trauma – Emergency – Critical Care Medicine
1401, 18ème rue, local Z-201, Québec (Qc), G1J 1Z4, Canada Phone: 418-649-0252 ext. 66847
Fax:
Email: [email protected]
Funding:
This study was funded by Fonds de recherche du Québec – santé (grant #112775) and the CIHR (grant #358052).
16
17
Résumé
Nos objectifs étaient d’identifier les déterminants d’utilisation des ressources, d’étudier la variation inter-hospitalière et d’évaluer son association avec les résultats cliniques. Nous avons réalisé une étude de cohorte multicentrique en incluant les aînés (≥65 ans) admis dans le système de traumatologie du Québec. La destination à la sortie de l’hôpital était le plus important déterminant. Nous avons observé une variation inter-hospitalière significative dans l’utilisation des ressources qui était plus importante chez les patients avec fractures de fragilité qu’avec blessures traumatiques. Les hôpitaux avec une plus grande intensité d’utilisation des ressources avaient tendance à avoir une incidence de mortalité et de complications plus élevée. Nos résultats suggèrent qu’il y a place à l’optimisation des ressources pour les aînés admis pour blessures. L’augmentation de mortalité et morbidité dans les hôpitaux utilisant plus de ressources pourrait être dû à une confondance résiduelle mais aussi aux effets adverses reliés aux interventions et journées d’hospitalisation potentiellement non-nécessaires.
18
Mini-Abstract
In this multicenter cohort study, we observed significant inter-hospital variation in resource use for injured elderly patients admitted with trauma or fragility fractures. Trauma centers with higher risk-adjusted resource use did not have better clinical outcomes.
19
Structured Abstract
Objective: To identify determinants of resource use, assess inter-hospital variations in
resource use and evaluate the association between hospital use and clinical outcomes for injured elderly patients.
Background: Injuries represent one of the leading causes of preventable morbidity and
mortality. For countries with aging populations, hospital admissions of injured elderly patients are increasing exponentially. Yet, we know little about hospital resource use for injured elderly patients.
Methods: We conducted a multicenter retrospective cohort study of injured elderly
patients (≥65 years) admitted to any of the 57 trauma centers in Quebec (2013-2016, N=33,184). Resource use was estimated using activity-based costing and modeled with multilevel linear models. We conducted separate group analyses for patients with trauma and fragility fractures.
Results: Risk-adjusted resource use increased with age, and the number of comorbidities,
varied with discharge destination in both groups (p<0.001). Risk-adjusted resource use varied significantly across trauma centers, more for elderly patients with fragility fractures (intraclass correlation coefficients [ICC]= 0.093, 95%CI=0.079-0.102) than for those with trauma (ICC=0.047, 95%CI=0.035-0.051). Higher hospital resource use was associated with higher incidence of complications for both populations (trauma: Pearson correlation coefficient [r]=0.55, 95%CI [0.33, 0.71], fragility fractures: r=0.54, 95%CI [0.32, 0.70]) and with higher mortality for fragility fractures (r=0.41, 95%CI [0.16, 0.61]).
20
Conclusions: We observed significant inter-hospital variations in resource use for elderly
trauma admissions. Hospitals with higher resource use did not have better clinical outcomes. Hospital resource use may not always positively impact patient care and outcomes. Future studies should evaluate the mechanism by which hospital resource use impacts care.
21
INTRODUCTION
Unintentional injuries are the leading cause of death for people under the age of 45 and cost North Americans over US$ 219 billion in 2010.1-4 In 2015, over 27.6 million Americans visited emergency rooms of which 2.8 million were hospitalized due to an injury.5 In Canada, injuries are the third most costly diagnosis in terms of hospital
expenditure and by 2035, their cost is expected to increase by 1.8 fold compared to 2004.3,
6 Ageing of the population is an important driver of cost and resource use for injury
admissions.3
Admissions of elderly patients due to trauma are rising exponentially. In the UK between 1990 and 2013, while the proportion of major trauma patients under 25 years old decreased from 39% to 17% , the proportion aged 75 years and over increased from 8% to 27%.7 It is expected that by 2050, elders will constitute over 39% of trauma admissions in the US.7,
8 In addition, elders have higher mortality, more complications, and greater resource use
than their younger counterparts with similar injuries.9 Every year 8.9 million people are affected by fragility fractures.10 Fragility fractures can lead to loss of function and an
increased mortality and morbidity even one year after fracture.11 In Europe, disability due to fragility fractures exceeds that caused by cancer.10
Faced with rising burden of injured elderly patients, healthcare administrators must find ways to reduce the cost of acute trauma care without negatively impacting quality. Evidence from the US shows that trauma centers with higher spending do not have better risk-adjusted patient outcomes.12 However, this association has not been specifically
22
studied for elderly trauma admissions. Furthermore, studies using patient-level estimates of resource use and data from single-payer health systems are rare.13 Despite the important
financial and human burden of elderly injury admissions, there is an important knowledge gap on resource use intensity in this population. Identifying the drivers of resource use and understanding inter-provider variations in resource use intensity are essential to improving health care efficiency in this population.
The objectives of this study were to (i) identify resource use determinants for admissions of injured elderly patients, (ii) evaluate inter-hospital variation in resource use intensity in this population and (iii) assess the association between hospital resource use intensity and clinical outcomes.
23
METHODS
Study design, Study population, and setting
We conducted a retrospective, multicenter cohort study including elderly injured patients (≥ 65 years old) admitted between April 1, 2013, and March 31, 2016, to any of the adult trauma centers of the province of Quebec (Canada), who met the following inclusion criteria: patients with an injury as the main cause of admission who either died in-hospital, had an intensive care unit (ICU) admission, a hospital stay ≥ 3 days, or was transferred from another acute care facility.
We stratified our population into two subgroups: trauma and fragility fractures. Fragility fractures included patients with fractures to their extremities (including hip fractures) that resulted from a same-level fall (fall from own height) and no other injuries in other body regions with an AIS>2.14 We used ICD-10 e-codes to identify same level falls (W00, W01, W05, W06, W07, W08, W18).15 All other patients were entered into the trauma group. The trauma system for the province of Quebec (population 8.2 million) was set up in 1993. It includes 57 adult trauma centers designated into four levels based on American College of Surgeons criteria16: 3 level I, 5 level II, 21 level III, and 28 level IV. Timely access for trauma victims to specialized care throughout the province is targeted through standardized pre-hospital and inter-hospital transfer protocols.17 The Institut National d’Excellence en
Santé et en Services Sociaux is responsible for trauma center accreditation.18
Data Sources
Data were extracted from the Quebec trauma registry, which contains information on all patients with an injury as the main cause of admission admitted to any trauma center in the
24
province. Medical archivists extract information from patient files using standardized coding protocols. Anatomic injuries are coded with the Abbreviated Injury Scale (AIS).19
The registry is screened periodically for aberrant data values. Regular meetings with stakeholders, electronic coding forums and on-going training are other mechanisms for ensuring data quality.20 To obtain information on comorbidities, the Quebec trauma registry was linked to the provincial hospital discharge database (MED-ÉCHO) using a unique health insurance number.21 The 2016 AS-471 Cost database from Quebec Ministry
of Health and Social Services provided cost information for resource use estimation.
Primary outcome
Our primary outcome was total resource use during hospital admission. We estimated resource use using activity-based costing for all patients discharged alive.22 Deaths were excluded for the estimation of risk-adjusted hospital resource use because resource use is right-censored for these patients. However, they were included in a competitive risks framework in sensitivity analyses. Activity-based costing involves multiplying the unit costs of specific activity centers (Emergency department [ED], operating room, intensive care unit [ICU], ward and, para-clinical services [psychological consultation, occupational therapy, physiotherapy and respiratory therapy]) by the corresponding units of resources used. This method provides an estimate of resource use intensity consistent with Grading of Recommendations Assessment, Development and Evaluations (GRADE) guidelines. 22-25 We used mean cost for each activity center in level I trauma centers for 2016 to obtain
resource use estimates that were independent of fluctuations in pricing across hospitals or regions or over time. Total resource use was calculated as the sum of resource use in each activity center from arrival in the ED to discharge.
25
Potential determinants
We consulted the literature and clinical experts to identify the following potential determinants of resource use: age, sex, number of comorbidities, body region with the most severe injury, Injury Severity Score (ISS), Glasgow Coma Scale (GCS) score on arrival, systolic blood pressure (SBP) on arrival, respiratory rate (RR) on arrival, transfer status, year of admission, trauma center designation level and discharge destination. Studies suggest that discharge destination is major determinant of length of acute stay for elderly injured patients due to social factors such as the absence of caregivers and waiting for bed in post-discharge facilities.26 We calculated the number of comorbidities according to the list elaborated by Elixhauser.27
Secondary outcomes
Our secondary outcomes were in-hospital mortality and in-hospital complications. Mortality was defined as any death during the index hospital stay. Complications were defined as the occurrence of any of the following during the index hospital stay: acute respiratory distress syndrome, aspiration pneumonia, acute respiratory failure/distress, hospital-acquired pneumonia, pulmonary embolism, cardiac arrest, post-operative hemorrhagic shock, myocardial infarction, anastomotic leak, Clostridium difficile colitis, coagulopathy, central venous catheter-related infection, sepsis, wound infection, acute renal failure, decubitus ulcers, extremity compartment syndrome, non-union fracture, osteomyelitis Stroke, deep vein thrombosis, delirium, or death.
26
Statistical Analyses
We modeled resource use intensity using its natural-log transformation because of its right-skewed distribution.28 To identify resource use determinants, we used multilevel linear regression models with a random intercept on trauma centers to control for hospital clustering. We described the association between potential determinants and resource use with geometric mean ratios (GMR) and 95% confidence intervals (CI). To evaluate the importance of each variable in determining resource use, we estimated the proportion of variation explained by each variable using Cohen’s f2.29, 30 We used two models to generate
GMR: the first only included variables describing patient risk factors, and the second included all potential determinants.
To assess inter-hospital variations in resource use intensity, we used a linear regression model with trauma center modeled as a random intercept. The model included patient risk factors: age, sex, number of comorbidities, ISS, body region with the most severe injury, SBP, RR, and GCS and transfer status. To quantify between-hospital variation in resource use not explained by patient characteristics, we used the intraclass correlation coefficient (ICC)31, 32 and generated 95% confidence intervals (CI) with bootstrap resampling.33 We estimated risk-adjusted mean resource use for each trauma center using shrinkage estimates.34
We estimated risk-adjusted incidence of hospital mortality and complications using shrinkage estimates in multilevel logistic regression models. We adjusted for age, sex, comorbidities, injuries severity, body region of injuries, SBP, RR and GCS score according to validated risk-adjustment models described in detail elsewhere.35 We used Pearson correlation coefficients (Pearson's r) weighted for hospital volume to evaluate the
27
correlation between hospital resource use and both hospital mortality and complications.36 Incidence estimates were transformed using a square root arsine transformation to normalize their distribution.
For the population with trauma, 1%, 9%, and 46% of SBP, RR, and GCS observations were missing. Around 1%, 11%, and 65% of patients with fragility fractures had missing SBP, RR, and GCS, respectively. The GCS score is largely missing in patients without cranial injuries, with minor injuries and in patients intubated or sedated on arrival. To address the problem of missing physiological data, we used multiple imputation.37-39 We used the Markov Chain Monte Carlo (MCMC) method with a single chain to generate 49 and 67 complete datasets (based on the fraction of missing information) for the populations with trauma and with fragility fractures respectively.40, 41 We included all dependent and independent variables in the imputation model.
Sensitivity Analyses
To assess the robustness of our results, we performed three sensitivity analyses. First, to evaluate the influence of excluding deaths, we included patients who died in-hospital in a competitive risks model.42 Second, to determine the influence of simulating missing data,
we excluded patients with missing physiological data. Third, to assess the impact of incomplete acute care stay, we excluded patients who were transferred out to another acute care hospital.
To better understand the correlation between resource use and the incidence of mortality and complications, we calculated Pearson correlation coefficients separately for patients admitted to level I/II and level III/IV trauma centers. We then restricted the analysis to
28
patients transported directly from the scene to definitive care. Risk-adjusted resource use may vary depending on intensity and duration of care. Risk-adjusted resource use variation for the duration of care might be due to delays in care and discharge. To separate these two concepts, we performed analyses separately for the ward (longer than expected ward stays may be largely due to delays to discharge) and then ICU, operating room, medical imaging and para-clinical services (higher than expected resource-use in these activity centers may be largely due to high intensity of care).30
All analyses were performed using Statistical Analysis System software (SAS Institute, Cary, North Carolina, v. 9.4) and statistical tests performed were two-sided with α=0.05. The Research Ethics Committee of the CHU de Québec – Université Laval in Quebec, Canada approved this study.
29
RESULTS
Study population
The Quebec trauma registry included 33,552 elderly patients admitted between 2013 and 2016. Of these, we excluded 43 (0.13%) who left against medical advice, 152 (0.45%) who were dead on arrival, 63 (0.19%) with unknown injury severity and 110 (0.33%) with missing comorbidity data. The final study population included 33,184 elders. In our analysis on resource use variation and determinants, we included 30,332 elders discharged alive of which 14,784 (48.7%) had trauma and 15,548 (51.3%) had fragility fractures. One third were male, 40% were 85 years of age or over, half had 3 or more comorbidities, and 11% had major injuries (ISS>12; Supplemental Content 1).
Resource use
For trauma, median resource use was CAN$ 5,119 (Supplemental Content 1). Crude median resource use increased with age and the number of comorbidities. Median resource use was higher for level I trauma centers than for level IV, for women compared to men and for patients discharged to long-term care or rehabilitation compared to patients discharged home. For fragility fractures, crude median resource use was higher for (CAN$ 6,021) and resource use increased with age and, the number of comorbidities, and was higher for men.
Determinants
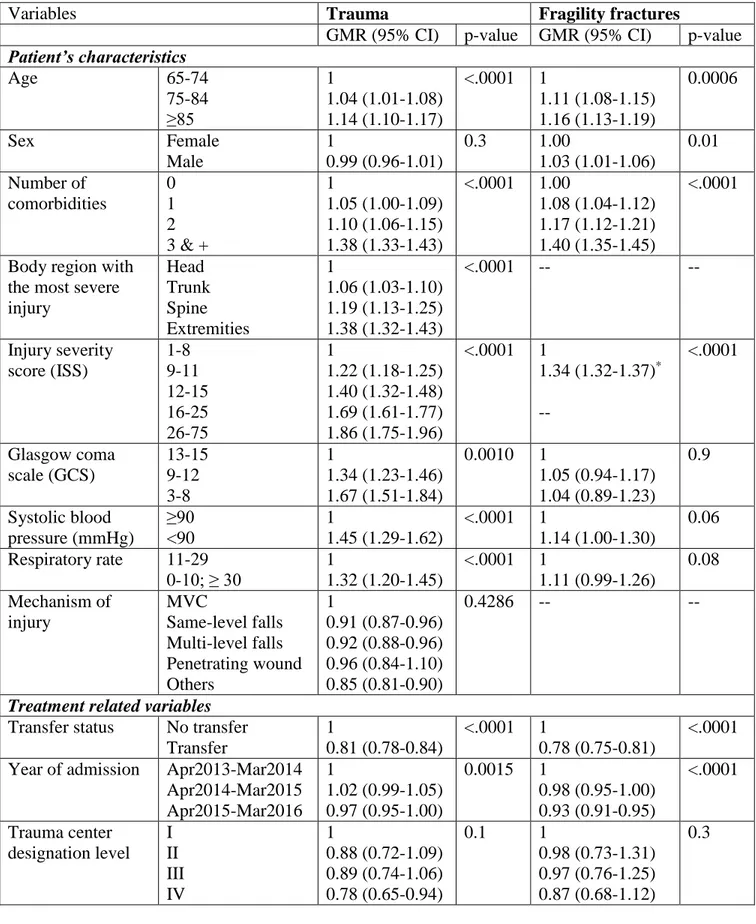
After adjustment for all other risk factors, resource use increased with age, the number of comorbidities and injury severity (ISS) for both patients with trauma and those with fragility fractures (Table 1). Patients discharged to long-term care and to rehabilitation had
30
higher resource use than patients discharged elsewhere. Resource use was higher for level I than level IV trauma centers but globally, the variation across designation levels was not statistically significant. Mean adjusted resource use in patients with their most severe injuries to lower or upper extremities was 38% higher than for patients with a predominant head injury.
The variables evaluated explained 21% of the variation in resource use for trauma and 19% for fragility fractures. The most important determinants of resource use for patients with trauma were discharge destination (f2=6.5%), ISS (f2=6.4%) and the number of comorbidities (f2=2.8%) (Figure 1). These determinants were also the strongest for fragility fractures: ISS (f2=4.6%), number of comorbidities (f2=3.1%) and discharge destination (f2=2.1%).
Inter-hospital variation
Greater variation in resource use was observed between trauma centers for patients with fragility fractures (ICC=0.093) than patients with trauma (ICC=0.047; Table 2). The same trend was observed across all activity centers. The activity centers with the highest and lowest between-hospital variations were the operating room and medical imaging, respectively.
Correlation between hospital resource use and clinical outcomes
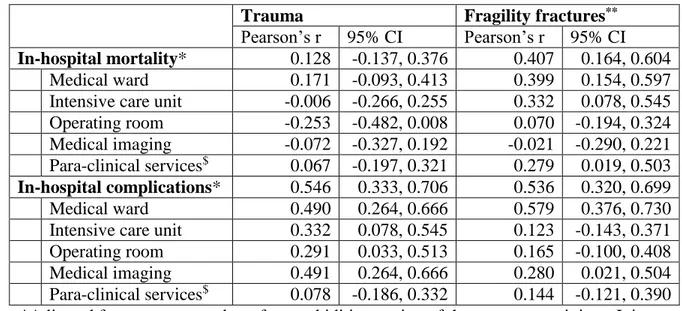
Mortality
Trauma centers with higher risk-adjusted resource use tended to have higher mortality incidence for fragility fractures (Pearson’s r=0.4; Table 3 and Figure 2). In this population, we observed a statistically significant positive correlation between resource use and
31
mortality for the medical ward, ICU, and para-clinical services but not for the operating room or medical imaging. We observed no statistically significant association between hospital resource use and mortality for elderly trauma patients. The level I trauma center with the highest risk-adjusted resource use also had the highest risk-adjusted mortality incidence in both populations (Figure 2).
Complications
For both trauma and fragility fractures, trauma centers with higher risk-adjusted resource use had a significantly higher risk-adjusted incidence of complications (Table 3 and
Figure 2). Higher ward and imaging-related resource use for both populations and
operating room and ICU-related resource use for patients with trauma were associated with a significantly higher incidence of complications (Table 3).
Sensitivity Analyses
Sensitivity analyses performed by including patients who died in-hospital in a competing risks model, excluding patients with missing physiological data and excluding patients transferred out to another acute care hospital did not significantly alter our conclusions (results not presented).
When restricting analyses to level I/II trauma centers, we observed a stronger positive correlation between resource use and mortality, and between resource use and complications for both populations (statistically non-significant due to the smaller sample size; Supplemental Content 2). We observed weaker correlations between resource use and 30-day mortality compared to hospital mortality. For both patients with fragility fractures and trauma, we observed weaker correlations between resource use and either
32
mortality or complications in activity centers related to the intensity of care (ICU, surgery, medical imaging, para-clinical services) compared to activity centers related to the duration of care (ward).
33
DISCUSSION
In this multicenter retrospective cohort study, the three most important determinants of resource use for injured elderly patients admitted for trauma or fragility fractures were discharge destination, ISS and the number of comorbidities. We observed statistically significant variation in resource use across trauma centers that was not explained by patient case mix. This variation was higher for patients admitted with fragility fractures than those with trauma. The strongest inter-hospital variation in risk-adjusted resource use was observed for the operating room. Trauma centers with higher risk-adjusted resource use did not have better clinical outcomes (mortality and complications) than trauma centers with lower resource use.
Age, comorbidities and discharge destination have been reported by numerous studies as important determinants of hospital length of stay43, 44 and costs45 in trauma settings. Furthermore, variations in cost between healthcare providers have previously been documented across the US and the UK.46-48 These variations were characterized as unwarranted since they were not explained by
patients’ level of illness on arrival. Multiple studies have suggested that mortality and morbidity are not lower for health providers with higher spending.46, 47, 49 One study in the US observed significant regional variation in cost for 18 to 64 year-old trauma patients but no significant regional variation in mortality.12 Another study found that adult patients admitted to level I and II trauma centers with lower risk-adjusted mortality had a significantly lower cost of care than those admitted to trauma centers with average mortality.49 In both of these studies, costs were estimated using charges and the charge-to-cost ratio and neither reported results specific to elderly trauma patients.
In our study, resource use is a combination of the intensity of care (ICU, operating room, medical imaging, and para-clinical services) and duration of care (ward). Inter-hospital variation in
risk-34
adjusted duration of care are may be due to longer delays in care and discharge. Delays to discharge caused by barriers to post-admission facilities might explain the importance of discharge destination as a determinant of resource use in elderly injury admissions.50 These barriers might also be behind the stronger correlations between hospital resource use and clinical outcomes observed for activity centers related to duration of care (ward) compared to those related to the intensity of care in our study. These results suggest that improvements in access to post-acute care may be key to improving acute care resource use for elderly injury admissions.
Resource use was higher, inter-hospital variation was greater and positive correlations between hospital resource use and both mortality and complications were stronger among elders with fragility fractures than those with trauma. These results underline the growing problem of trauma in potentially pre-frail elders discussed by other authors.11 Unlike admissions for elders with
trauma, we observed no variation in resource use according to trauma center designation level for fragility fractures. Previous research has shown no difference in patient outcomes for elders treated in trauma centers versus non-trauma hospitals or lower-level versus higher level trauma centers.9 This raises the question of whether treating elderly patients with fragility fractures in specialized trauma centers represents an optimal use of resources given the presence of important comorbidities and their needs in terms of geriatric services and appropriate post-acute care facilities.
Strengths & Limitations
Our study was conducted on a large, contemporary (2013-2016) sample using a trauma registry with extensive population coverage and high-quality data. We used activity-based costing, which is a reproducible method for estimating resource use. A systematic review focused on the variation of acute care costs in cohort studies identified the need for standardized, reproducible methods