Atmospheric Emissions:
Opportunities for the Construction Industry in
Electrical Power Stations
by
Nicolas Cauchy
Associate in Arts, Aviation & Engineering
Miami Dade
Community College
(1985)
Bachelor of Science, Aeronautics & Astronautics
MIT (1988)
Submitted to the Department of Civil and Environmental Engineering
in partial fulfillment of the requirements for the Degree of
Master of Science in Civil and Environmental Engineering
at the
Massachusetts Institute of Technology
May, 1993.
©
1993 Massachusetts Institute of Technology
All Rights Reserved
A!
Signature of Author
Certified by
epartEnvironmental EngineeringMay, 1993
Professor F. Moavenzadeh, Thesis Supervisor Director, Center for Construction Research and Education Accepted by
Professor E. Kausel Chairman, Departmental Committee on Graduate Studies
Atmospheric Emissions:
Opportunities for the Construction Industry in Electrical Power Stations
by Nicolas Cauchy, under supervision from Professor F. Moavenzadeh
Submitted to the Department of Civil and Environmental Engineering on 4 May, 1993, in partial fulfillment for the Degree of Master of Science in Civil and Environmental
Engineering
Abstract
The original motivation for this research comes from a group of construction firms interested in the effects of environmental regulations on their activities. This particular report examines the problem from the perspective of the market for electrical
powerplants. A qualitative survey is presented in four principal areas: current theories about atmospheric phenomena are discussed, a link between industrialization and increasing emissions is established, historical developments in the policy field are summarized, and current technologies are reveiwed from a technical point.
Recent scientific studies have revealed extensive damage to the atmosphere as a result of emissions from combustion processes. Three main phenomena are reviewed as well as their causes and potential consequences. Acid Rain results from sulfur oxides,
Stratospheric Ozone is being depleted by chlorofluorocarbons, and Global Warming is increased by greenhouse gases. Beyond the effects already visible in many parts of the world, long-term consequences could change the planet into an atmosphere unlivable for mankind.
After the transportation sector, energy production is the second largest source of greenhouse gas emissions. As developed nations underwent the industrial revolution, energy consumption increased rapidly. Within energy production, electricity gained an important role which is still increasing. Yet, developed nations only represent about one tenth of the world population and many developing nations appear mature to undergo their own industrial revolutions. This poses the imminent threat of dramatic increases in energy demand and therefore atmospheric pollution if the process followed is similar to
that of the developed world in the nineteenth century.
In response to scientific warnings about the depletion of natural resources and under growing regulatory pressure, technologies for reducing emissions from electrical plants are competing for a fast growing market. On one hand, numerous retrofitting devices are being sold to clean the exhaust fumes from conventional powerplants; in parallel,
alternative energy-production methods are nearing large scale commercial availability. Each of these families of technologies will have its most favorable market in specific geiographical locations, depending on the natural resources available locally and the need to modify existing plants or build new ones to satisfy a growing demand; the former is seen as associated with developed nations striving for improved efficiency, while new plants will be in great demand in developing nations.
ACKNOWLEDGEMENT
Much of the material presented in the first three chapters is derived from the research of
Mr. Kazushi Wakita, visiting scientist at the Center for Construction Research and
Education, at MIT. At CCRE, I particularly thank Danielle and Dawn for their ever-smiling effectiveness in helping me through administrative confusion.
From the very beginning of my late student "carreer," I was coached and supported by several professors at Miami Dade Community College. Eternal recognition goes to Rich Kraemer who helped me go from elementary algebra to astronautics, from a high school dropout to a double MIT graduate, all the while remembering the importance of the Sky.
My two undergraduate years in the Department of Aero/Astro at MIT gave me far more learning than just engineering thanks to Professor James Mc Cune, to whom I owe learning the value of self-esteem.
Finally, I wish to express my greatest thanks to Professor Eric Chassignet of the Rosenstiel School of Marine and Atmospheric Science in Miami, Doctor Georges
Tselioudis, at the Goddard Institute for Space Studies in New York, and Doctor Georges Grell, at the National Center for Atmospheric Research in Boulder, for their shared enthousiasm in seeking to understand the importance of atmospheric science.
Claudio Chamon has been my closest companion since we entered MIT together and life would not be the same without him; muito obrigado irmao! Sans oublier mon pote Gilles Kerhuel (astie d'St sacrement...). Thanks to he and Hank for guidance on using Mac Intosh computers.
This work is dedicated to Timothee and Quentin,
With hope that all men will learn to respect the Sky
Chapter 1: Atmospheric Pollutants and Their Effects
1.1 The Importance of the Atmosphere on Market Trends ... 10
1.2 Atmospheric Pollution: Three Main Phenomena and Large Uncertainties ... 10
1.2.1. Carbon Dioxide (C02) and Global Warming ... 12
1.2.2. Chlorofluorocarbons (CFC's) and Ozone (03) Depletion ... 17
1.2.3. Nitrous Oxides (NOx), Sulfur Dioxide (S02), and Acid Rain ... 20
1.2.4. Uncertainties Associated with Global Climate Models (GCMs) ... 22
1.3 Conclusion: ... 25
Chapter 2: Environmental Degradation and Human Development 2.1 Introduction ... 27
2.2 Viewing the World as Three Major Economic Blocs ... 27
2.3 D eveloped Countries: ... 32
2.3.1. Effect of Industrial Development on Energy Consumption... 32
2.3.2 Increasing Role of Electrical Energy ... ... 40
2.3.3 Conclusion About Industrialized Nations and Energy ... ... 41
2.4 Eastern Europe and China or Centrally Planned Economies (CPE's) ... .... 42
2.4.1 Energy Sources in CPE's ... 42
2.5 Developing Countries ... ... 43
2.6 Im plications for Policy ... ... 46
2.6.1 Common Features and Differences Between Atmospheric Phenom ena: ... 46
2.6.2 Two Classes of Effects: ... 47
2.6.3 Socio-economic Impacts of Global Phenomena: ... 48
2.6.4 The Dichotomy: Efficient Development versus Sustainability ... 49
2.7 R em arks ... 51
Chapter 3: International Negotiations and Policies 3.1 Historical Background of Concern for Air Quality ... 53
3.1.1 Early Signs of Concern for S02 & NOx ... ... 53
3.1.2 The Transboundary Nature of Acid Rain and Historic Negotiations... 57
3.1.3 History of International Negotiations on CFCS ... 63
3.1.4 History of Negotiations on C02 ... ... 65
3.2 History of Policies Focusing on Combustion Emissions: ... 66
3.2.1 Regulation of Automotive Emissions in the U.S. ... 66
3.2.2 Different Approaches ... 67
3.2.3 USA ... ... ... 68
3.2.4 European Community ... ... 70
3.2.5 Japan ... 72
3.2.6 Less Developed Countries ... 74
3.2.7 Eastern Block ... 74
3.3 Global Warming: Policy Making Under Uncertainty ... 75
3.3.1 A ct N ow ... 76
3.3.2 Wait for More Scientific Evidence ... 77
3.3.3 Ignoring Global Warming ... 78
3.4 Two Forms of Policies: Direct Regulation vs. Market Incentives ... 79
3.4.2 Market-Based Regulation ... ... 80
3.5 Inherent Problems inSocial Structures and How These Prevent Effective Action ... 82
3.5.1 The Need for Scientific and Government Collaboration ... 86
3.5.2 The Importance of Non-Governmental Organizations (NGO's):... 87
3.6 Establishing Responsibility: ... 87
3.6.1 Developed Countries are the Major Polluters: ... 87
3.6.2 Arguments by Developing Nations and Leverage Implications: ... 88
3.7 Difficulties in Assessing Environmental Costs... ... 89
3.8 Chapter Conclusion ... 90
Chapter 4: Reducing Emissions from Electrical Powerplants, Technologies Available 4.1 Introduction ... 95
4.2 Reducing Emissions From Conventional Combustion Plants ... 95
4.3 Source Approach ... 96
4.3.1 Coal C leaning ... 96
4.3.2 Mixed Combustibles: Co-Firing ... ... 97
4.3.3 High Efficiency Combustion Technologies ... 98
4.3.3 End-of-pipe Technologies ... 104
4.4 Alternative Energy Sources ... 107
4.4.1 Other non-renewable Technologies: ... 107
4.4.2 Renewable Sources: ... 112
4.4.3 The Earth as an Energy Source: ... 135
4.4.4 The Ocean ... 141
4.5 Closing Comments ... 148
Chapter 5: Summary and Conclusion 5.1 Sum m ary ... 151
5.1.1 Environmental Factors ... 151
5.1.2 The Role of Electricity ... 152
5.1.3 Policy Implications ... 153 5.1.4 Technologies ... 154 5.2 Market Characteristics ... 155 5.2.1 Industrialized Nations ... 155 5.2.2 Developing Nations... 159 5.3 In C losing ... 161 5.4 Further Research ... 162 Appendix
INTRODUCTION
This study responds to a request by construction firms to explore the impacts of environmental factors on the market for electrical powerplants. Concern about
environmental degradation is nothing new, but recent scientific revelations have caused an upsurge of regulations to limit human impact on the natural environment. There are three main components of our environment; they are water, earth, and the air. Among the three, atmospheric pollution presents a number of difficult characteristics. For one thing, most pollutants are invisible, except in very high concentrations; unlike oil spills or land devoid of life after a toxic spill, pollutants cannot be contained once they are released. Secondly, chemicals are transported to high altitudes where their reactions may be very different from those observed at Earth's surface. As a corollary, the elements may travel great distances before falling back to Earth or causing some high-altitude phenomenon. Anyone wishing to approach environmentally sensitive markets must be very familiar with basic environmental phenomena, including their associated uncertainties; a historical background of international negotiations is important to understand the imlications of new scientific findings; and, finally, one must realize that technologies are becoming more and more concise, increasing the share of technical engineering over those of construction activities in adapting them to the electrical industry.
The first chapter of this thesis reviews the three main atmospheric phenomena currently discussed in the scientific/policy areas. Acid Rain results from the emission of sulfur oxides into the lowerr atmosphere. The effects have been directly observed and cover limited geographical areas. Ozone Depletion is the subject of much frenzy because it is recent and still not scientifically explained. The physics of Global Warming are much
better understood but the implications on climate change are still widely debated. Both of the latter two phenomena are characterized by their global impact on the scale of the entire World; emissions contributing to either of the two on one side of the world will affect all nations alike. This poses a particular challenge for international regulations. Global Warming in particular has the potential to shift the complete balace of power between developing and industrialized nations.
Yet the electrical industry is the second source of air pollution after the transportation sector. Although industrialized nations have stabilized their demand for electricity, developing nations hold much more of the world's population and pose a challenge as they approach the time for their own industrial expansion.
Given the implications of such disbalance between nations and the many uncertainties of global atmospheric phenomena, it is impossible to predict future regulations. The best one can do is to review the historical evolution of negotiations and have an idea of what to expect so as not to be taken by surprise. Chapter 3 presents an overview of
developments in OECD nations, mostly based on experiences in the USA.
Chapter 4 is dedicated to in-depth technical investigations of the technologies available for retrofitting existing plants and for the future expolitation of renewable sources of energy.
The conclusion of this qualitative analysis is that the electricity production market will be differentiated geographically between developing and industrialized nations, each
respectively associated with new plants and retrofitting existing ones. Two ensuing recommendations are geographical expansion and technical diversification for firms wishing to grasp a share of this market.
CHAPTER 1;
ATMOSPHERIC POLLUTANTS AND THEIR EFFECTS
1.1
The
Importance
of the Atmosphere on Market Trends
Future scientific revelations about the condition of our natural environment will be the major factor influencing regulations which, in turn, will guide the choice of technologies. Therefore, a thorough understanding of environmental phenomena is essential in
forecasting future markets.
Currently, three main phenomena guide regulations which affect the electrical industry. These are Global Warming, Stratospheric Ozone Depletion, and Acid Rain. Although there is not yet any clear evidence of dramatic climate change, the gases emitted from combustion processes, which produce a large portion of our energy, have definite effects on the ambient air. In this chapter, we discuss these three main phenomena and establish the link with emissions from combustion processes, particularly those associated with the production of electricity.
1.2 Atmospheric Pollution: Three Main Phenomena and Large
Uncertainties
The atmosphere establishes a delicate energy balance between the Earth and incoming solar radiation.
Atmospheric pollution affects our environment in two main areas: at low altitudes, we are all too familiar with urban smog and suspended particles. Once transported to higher altitudes however, the same gases travel larger distances, causing regional and global
climatic phenomena. This thesis focuses on the second category of effects, which is the primary basis for policy debates over the regulation of power plant emissions.
Figure 1 will serve as a basic illustration for the climatic phenomena which we analyze below.
A0ý&^ kr
BSURFACE
1SURFACE
SU" "
earth
HEAT RADIATIONFigure 1.1: Distribution of Solar Energy in Earth's Environment (Global Climate Change, HBS, 1991)1
Three major environmental problems are associated with emissions of three specific
gases, although each gas may contribute to more than one phenomenon: carbon dioxide is the main contributor to global warming; chlorofluorocarbons are the primary cause for ozone depletion; and sulfur dioxide as well as nitrous oxides causes acid rain.
These phenomena already have impacted many areas of the planet in a variety of ways, and several atmospheric models suggest that the cumulative effects over time may lead to catastrophic events in the future.
Each phenomenon is described with its major component and the potential effects in the following subsections A, B, and C. Error factors in the models predicting these effects are discussed in subsection D.
1.2.1. Carbon Dioxide (C02) and Global Warming
The greenhouse effect is another name for global warming, and it is actually a necessary component of the natural ecological systems of our planet: various gases suspended in the atmosphere act like a blanket, keeping the sun's heat from escaping too rapidly from the surface of the earth. Without greenhouse gases, temperatures at the Earth's surface would be too low to support life.2 Water vapor is by far the most important natural
greenhouse gas. Next is C02, which was present in the atmosphere long before the emergence of mankind. Among several greenhouse gases (GHG's include C02, CFC, CH4, N20), C02 is the major contributor to global warming: its contribution is
approximately 55%, followed by 24% for CFC's (Chlorofluorocarbons) , 15% for CH4 (Methane), and then 6% for N20 (Nitrogen Dioxide).3 If the concentration of C02 had
been maintained in naturally stable amounts, there would not have been reason for concern. Recent studies, however, reveal that there has been a rapid increase in the proportion of C02 trapped in the atmosphere, coinciding with expanding human activities around the world. Figure 2 illustrates the contributions of various human activities to the Greenhouse Effect.
CFC's (17%) Deforestation and Changes in I nArl I ea /OO/. Industry (394 Agriculture (14%) *6 J7I Production (57%)
Figure 1.2: Contribution of Human Activities to the Greenhouse Effect (Adapted From Goldemberg, Energy and the Environment in the 21st Century)4
a) Increasine C02 Emissions
Analyses of trapped air from several ice cores suggest that during the past several thousand years of the present interglacial period, C02 levels remained reasonably close to the pre industrial value of 280 ppm. At the maximum of the last Ice Age, 18000 years
ago, C02 levels were even lower than this, roughly 25 percent less than pre industrial values (Schneider). Since about 1850, however, C02 has risen by 25 percent, a dramatic increase in such a short period of time. The record at Mauna Loa Observatory in Hawaii shows that the CO2 concentration in the atmosphere has increased from about 310 ppm to more than 350 ppm since 1958 only.
b) Evidence of Possible Climate Change
Several papers conclude that a trend toward global warming has already begun due to increasing greenhouse gases. According to a report by the NASA Goddard Institute for
Space Studies (GISS) and Climatic Research Unit (CRU), some 0.5 degrees Centigrade of warming has occurred over the past 100 years.
In the summer of 1988, James Hansen, director of GISS in New York City, delivered testimony to this effect before the US. Congress and made three important points regarding the impact of the greenhouse effect on the global environment. The first was that "I believe the earth is getting warmer and I say that with 99% confidence." The second was that "...with a high degree of confidence we could associate the warming and the greenhouse effect." The third was that "...in our climate model, by the late 1980s and early 1990's, there's already a noticeable increase in the frequency of drought " (Legget). This hypothesis establishes a direct causal relationship between the warming of the Earth and shifting weather patterns; as we shall see below, large changes in weather patterns could have very important effects on human activities, such as agriculture.
Although this hypothesis is widely disputed within the scientific community, the dramatic consequences which it could have warrant considering its potential.
c) Potential Effects
Several atmospheric models have been developed collaboratively between various
scientific institutions. These models are generically referred to as Global Climate Models (GCM's) and include the following: NASA's Goddard Institute for Space Studies (NY) has developed the GISS model; British scientists have a UKMO (United Kingdom Meteorological Organization) model; and OSU and GFDL (Geophysical Fluid Dynamics Laboratory, Princeton, NJ) are two other common references. All these GCM's produce potentially alarming results if atmospheric emissions continue along the present trend.
One recent analysis estimates that if C02 were to double from 300 to 600 ppm, the Earth's surface temperature would eventually warm up some 3.5-to-5.0 degree C. (Schneider). This would alter the hygrometric balance between water in the oceans and vapor in the atmosphere, causing a change in rainfall patterns which, in turn, could affect the yield of vital crops. Ultimately, this would trickle down into economic effects. The summer of 1988, for example, was marked by unusual heat and drought throughout North America and elsewhere, thus affecting grain prices around the globe.5
Furthermore, such major climate shifts could affect lifeforms. Evolutionary changes are known to occur over long periods of time. A temperature increase of 3.5"C (6°F) over 30 years, as some models predict, would be much too sudden for physiological systems to adjust naturally. Aside from direct effects on human life, certain animal species may be extinguished while others proliferate; if pests were to be winners, our crop yield could be further reduced. Bacteria may proliferate and new diseases or epidemics may develop.
One popular image is the melting of the polar ice caps. Certain scientists from the International Panel on Climate Control (IPCC) conclude that, at the current rate of warming, sea levels will rise by between 10 and 30 cm (with a "best guess" of 20 cm or 8 inches) by the year 2030, and by 30 to 100 cm (with a best guess of 65 cm) by the end of the next century.
This would have direct impacts on coastal areas all over the world: for example, an increase of one meter (approximately 3 feet) in sea levels could inundate up to 15 percent of Egypt's arable land and 14 percent of Bangladesh's net cropped area (Woodwell).
Such scenarios are discussed frequently in the public media; however, there are many scientific uncertainties in the models used: meteorology is extremely complex since it
reacts to changes in any element of the planet and even planetary factors. While the latter, such as heat generated by the Sun or tidal cycles in phase with lunar periods, are beyond human grasp, man not only shifts the balance through industrial emissions but also by changing the natural flora: deforestation has an important compounding effect on global warming.
d) Deforestation. a Compounding Factor
Deforestation is leading to a dramatic decline in a precious sink for carbon dioxide in the atmosphere. Nafis Sadik gives a striking illustration of the current situation: "Today, between 7.6 and 10 million hectares are eliminated outright every year -- an area the size of Austria -- and a further 10 million hectares are seriously degraded. The FAO (Food and Agriculture Organization) predicts that 150 million hectares, or 12 percent of the remaining closed tropical forests, could be lost by the end of the century.
"In tropical Asia, 1.8 million hectares of closed forest were cut every year between 1976 and 1980. Large areas of forests have already disappeared in Indonesia, Thailand, Malaysia, the Philippines, India, Burma, and Laos. But it is in Brazil, most notably the provinces of Rondonia/Acre and Mato Grosso, where the destruction is taking on new and terrible proportions. In six Amazonian states, the deforested area increased by more than 150 percent between 1975 and 1978, encompassing 7.3 million hectares. Of Rondonia's 243000 square kilometers, more than 20000 have been cleared completely and another 100000 grossly degraded."6
Although no specific data correlating areas of deforestation with reduced C02 absorption were found at the time of this writing, the effect is scientifically accepted as significant.
1.2.2. Chlorofluorocarbons (CFC's) and Ozone (03) Depletion
Whether or not we are subject to unreasonable global warming is still debated. Ozone depletion, on the other hand, is scientifically proven and measured.
As clearly depicted in Figure 1 above, stratospheric ozone (03) acts as a shield against the Sun's unltraviolet rays (UV); it forms a layer in the upper atmosphere which reflects much of the incoming UV. Without this shield, too much UV would reach Earth's surface to allow any of the current lifeforms to survive. This explains why spacecraft traveling beyond the atmosphere require special shielding and why ozone depletion is associated with skin cancer on earth.
In 1974 Mario Molina and Sherwood Rowland at the University of California, Irvine, issued the first ozone alert .7 Since then, a lot of research has been committed to the phenomena, revealing the existence of a huge hole in the stratospheric ozone layer above the Antarctic and a smaller one over the Arctic regions.
a) Evidence of Ozone Depletion
Over the Antarctic
The current hypothesis about the origin of the southern ozone hole attributes significant effects to particular polar clouds, prevalent during certain times of the year over the Antarctic. These clouds provide an essential vehicle for the breaking down of certain chemicals, such as chlorofluorocarbons (CFC's), into 03-depleting compounds which destroy the ozone layer. Chemicals emitted in industrial areas, such as Buenos Aires or
Sao Paulo, are transported through high-altitude airflows to the polar region where they react with local atmospheric phenomena. This scenario is not universally accepted at this
point but it receives wide scientific support because it concurs well with scientific monitoring of the "ozone hole." Fortunately, the Antarctic region is only very sparsely populated and any urban centers are well beyond the reach of the ozone hole.
* "More Worrisome," Over the Arctic
However, a similar hole has recently been observed over the Arctic polar region. This has alerted many more environmentalists and politicians because of the much shorter distance between the North Pole and urban centers of the Northern hemisphere, such as New York, Tokyo, or Moscow. In February, 1992, following several direct
measurements from aircraft and satellites, NASA announced that the ozone layer could be temporarily depleted by the late winter of 1992 by as much as 40 percent over certain regions; these included the northernmost parts of the US., Canada, Europe, and Russia
(Lemonick).
However, applying the same model as that hypothesized for the Antarctic hole yields significant discrepancies with actual measurements. Given the quantities of pollutants released, the extent of ozone depletion should be much larger than is experimentally observed. Hence, there is presumed to be a mitigating effect which scientists are now trying to determine. Perhaps it is some form of replenishment of ozone from an
undetermined source, or maybe the limited existence of these polar clouds which results in reduced occurrences of the depleting reaction.
b) Effects of Ozone Depletion
Depletion of ozone layer means the destruction of a protective shield against the sun's harmful ultraviolet rays. Estimates by the United Nations Environment Program predict a 26 percent rise in the incidence of non-melanoma skin cancers worldwide if overall ozone
levels drop 10 percent. Ultraviolet light can impair immunity to infectious diseases in animals, and high doses of UV radiation can reduce the yield of basic crops such as
soybeans. A more insidious but perhaps even more devastating impact could come from the effects of this radiation on the growth of phytoplankton, which are a major element of
the ocean food chain.
C) Origin of CFC's
Emissions of CFC's (Chlorofluorocarbons) have been driven by economic growth in developed countries: chlorofluorocarbons serve in quantities of industrial processes, from
aerosols to refrigeration and electronics. By 1989, industrialized countries, with less than
25 percent of the world's population, were consuming close to 85 percent of CFC's. In 1974, the year when-the CFC-ozone depletion connection was hypothesized, CFC production hit a historic peak. Until that time, the United States was by far the major producer, with nearly half of the global total, with all other EC (European Community) countries together accounting for less than 40 percent. Currently, however, that situation has reversed itself. The European Community has now become the dominant producer in this market, following the banning of CFC's in aerosols by the United States in 1978. Japan's share of the world market has also increased to 11-12 percent over the years 8.
However, international agreements have been signed banning CFC emissions.
d) Low-level Ozone Pollution
If inhaled as a gas however, ozone is highly toxic to humans. It is one of the major components of urban smog and is responsible for the declared periods of reduced activity in cities such as Mexico and Los Angeles.
mass of the gas positioned in the Southern Atlantic, on the order of 3000 kilometers in diameter, has been recently revealed by NASA studies. The gas seems to result from large scale burning of forests in Brazil and southern African nations.9
While the reported effects of the migration of this mass over a densely populated area could be dramatic, it has not yet received much publicity in the press of our
"industrialized world." Perhaps this is due to our "guaranteed distance" from this mass of pollution, since air masses seldom cross the equator.
1.2.3. Nitrous Oxides (NOx), Sulfur Dioxide (S02), and Acid Rain
The most well-known regional atmospheric phenomenon is that of acid rain. European concern over this type of precipitation originated in the early 1960's and was the principal factor motivating the 1972 Stockholm conference.
Although acid rain is also an international issue, its impact is more regionally limited than those of global warming or ozone depletion. Acid rain results from the absorption of S02 and NOx in rain-clouds which typically travel at lower altitudes and precipitate before covering large distances. Hence, the regions affected by acid rain are relatively close to the source of the pollution and are much more dependent on local weather patterns, especially prevailing winds. Remediation efforts might require some
cooperation with immediate bordering nations, but not the multiple parties involved in global warming or ozone depletion. One important corollary is the possibility of establishing responsibility.
a) Trans-boundary Effects:
For instance, it has been determined that roughly half of the acid rain in Canada is attributed to pollution from the United States 10: the predominant source has been
established as power plants burning high-sulfur coal in the Ohio River valley and lower Midwest region. In Chapter 3, in dealing with policy implications, we present a table illustrating S02 depositions in European nations due to foreign emissions.
b) Environmental Damage Due to Acid Rain:
In Western Europe, many forests, ponds, and lakes have been found to be in deteriorating condition. In Scandinavia, 20000 of Sweden's 90000 lakes are acidified and 4000 of these are thought to be totally devoid of fish life. In former West Germany, the word "Waldsterben" ( forest death ) symbolizes the public concern for the problem which currently affects seven million hectares, or 14 percent, of forest lands in 15 European countries. In Krakow, Poland, damage to stone monuments and buildings is so severe that stone is described as dissolving. In Czechoslovakia, over 70 percent of the trees
surveyed had been damaged.'1
In China, coal-burning industries emit about 17 million metric tons of S02 into the atmosphere each year, along with some 23 million metric tons of particulates from smoke and dust. More than half of all rainfall monitored in large areas south of the Yangtze River have a pH of less than 5.6. In both Chongqing and Guiyang provinces, metal structures and concrete works also have suffered serious corrosion damage due mainly to the effects of acid rain (Sadik).
In the United States, acid rain has increased the acidity of many lakes and streams, sometimes leading to the death of aquatic life. It has damaged forests in the eastern US. and has also accelerated the corrosion of buildings and monuments. The US. National Surface Water Survey discovered that at least 10 percent of the lakes in the Adirondack region of New York state have pH values below five. Across eastern North America , the forests of the Appalachian Mountains have suffered serious damage. In Canada, 300
lakes in Ontario Province have been seriously affected, and an additional 48000 lakes are designated as " acid sensitive". Eastern Canada's sugar maples are dying out over wide areas.
These effects are tremendous and have stimulated responses from most nations concerned: several agreements have been signed as will be discussed in Chapter 3. However, the case of global warming could have consequences just as alarming yet still little exists in the way of international policy to address it. One major contributing factor is the uncertainty which surrounds Global Climate Models.
1.2.4. Uncertainties Associated with Global Climate Models (GCMs)
As stated earlier, the complexity of the system and our limited understanding of weather phenomena make it impossible to predict climate change given the means currently available. Several Global Climate Models exist but all are agreed by most scientists to be grossly inaccurate and inadequate for any definite climate predictions. Following are three principal justifications for this inadequacy:
a) Complexity of Global Climate Models (GCM's)12
While the shielding effect of ozone is universally recognized, 03 contribution to global warming illustrates one of the complexities of atmospheric modeling. 03 acts both as a shield against ultraviolet rays incoming from outer space and as a greenhouse gas; lately, aside from the radiation effects on life forms, it appears that ozone depletion could offset some of the effects of global warming by providing more cooling than it does warming; this appears to reverse the previous opposite belief; neither hypothesis is yet proven. Clouds present another example of opposing effects. On the one hand, clouds absorb infrared radiation and radiate back to the Earth's surface, thereby contributing
significantly to greenhouse warming. At the same time, these clouds reflect incoming ultraviolet radiation from outer space and thus provide a cooling effect. Furthermore, all clouds migrate and change in the process, thereby having different effects on different regions.
In addition, many chemical processes, like that which causes ozone depletion, are still unexplained and atmospheric chemistry is not incorporated in the GCM's. But beyond modeling issues, there is no sound database with which to compare current atmospheric trends.
b) Time scale of Recorded Weather Patterns:
Accurate weather data has been recorded, in the developed world, for the last one hundred years approximately. Even if we limit climate models geographically to these small regions, the recorded fluctuations would appear as only a point on a graph
extending back to the most recent glacial period, some 18 000 years ago. This, in turn, would be insignificant on a hypothetical chart covering the climatic history of the planet. Through this century, there has been a trend toward rising average temperatures, in the range of 0.60C to 0.80C. However, this range drops to 0.20C if one accounts for point
sources, such as urban areas. Furthermore, the noise inherent in the model is on the same order of magnitude. Clearly, it is impossible to relate such an uncertain local trend to that of natural climate cycles.
We have stated the immensity of the timescale of atmospheric phenomena; but the physical dimensions of the systems involved are equally problematic to understand and model. Hence, two large components of the atmospheric system are still excluded from the model: these are the deep ocean currents and the winds.
c) Deep Ocean Currents and Winds: Chaos
Deep ocean currents and winds are currently excluded from Global Climate Models. However, there is substantial evidence that they have played major roles in past climate changes. In particular, both exhibit chaotic behavior in the pure mathematical sense. This means that a small disturbance in winds or currents could lead to catastrophic changes. As an example, it would not be unreasonable, in such an event, to record temperature changes on the order of 50C over a thirty to forty year time span! Human or
other effects could potentially induce such a disturbance.
Beyond human effects, material limitations are the last element of these uncertainties.
d) Computer Limitations:
From a modeling point of view, all equations must be solved numerically, not
analytically. In this realm of complexity, even the most advanced supercomputers lack the capacity to run advanced climate models.
e) The Next Fifty Years Will Tell:
As technology evolves, advanced systems will improve modeling capability. At the same time, additional experiments may reveal other factors. From the data verification point of view, it is expected that within fifty to one hundred years from now enough data will have been recorded to judge the accuracy of climate model predictions.
Consequently, the majority of scientists guard against overreacting to these phenomena and advocate prudent and gradual policies.
Given the extensive damage revealed, it is mandatory for man to act in order to ensure sustainable development. Until now, industrialized nations have drawn from natural resources without any consideration for their possible depletion; alarms have been
sounded in the past but economic and political tones overshadowed the physical aspect of limited resources. Simultaneously, our industries have been releasing foreign substances into the atmosphere, water, and soil.
The threats of potential climate changes presented above are the first signals that we may be causing irreversible damage in our natural environment. Unlike oil crisis of the 70's or 90's, we will not be able to resolve these problems with negotiations or brute force. Consequently, in spite of major uncertainties in the global phenomena, we must prepare to change our consumption patterns so that we may live in better harmony with Earth's natural environment. As recommended by politicians, economists, and scientists alike, the wisest course is one of prudent and gradual adaptation to minimize the likelihood of our triggering chaos.
Industrialized nations must use their full resources to determine the most efficient and cost-effective ways to reduce our consumption patterns. At the same time, the potential cost of an environmental catastrophe should incite us to provide much assistance and funding to ensure that developing nations grow on sound infrastructures.
We have stated that energy is the second largest contributor to atmospheric pollution. In the next section, we will establish its fundamental role in social development. In light of the growth forecast for developing countries, we must provide the technical expertise to construct plants with low emissions or, preferably where it may be cost-effective, plants
which use renewable energy sources.
No cost models have yet been revealed which enable one to evaluate the cost of specific environmental damage. However, when one considers the worst case scenarios, such as dramatic increases in the number of skin-cancer cases, the avoidance of even a very low probability of occurrence still amounts to large social benefits.
The following chapter examines the trends toward further development as a justification for stimulating conservation measures. We will subsequently examine the policy framework.
References
1
Reinhardt F., Global Climate Change, Harvard Business School case # 9-391-180
2
Legget J., The Nature of the Greenhouse Threat, Global Warming, The Greenpeace Report, Oxford Univ. Press, 1990, pp.14-43
3
Schneider, S. H., The Greenhouse Effect, Science and Policy, Science, Vol.243, 10 February 1989,
pp.771-781.
4
Goldemberg J., Energy and Environmental Policies in Developed and Developing Countries, Energy and the Environment in the 21st Century, MIT Press, Cambridge, MA, 1991, p 79.
5Woodwell G. M., The Effects of Global Warming, The Greenpeace Report, pp.1 16-132. 6
Sadik N., Safeguarding the Future, United Nations Population Fund, New York, 1989.
7
Lemonick, M.,The Ozone Vanishes. Time, February 17, 1992, pp.60-63.
8
Mathews, J. T., Preserving the Global Environment: The Challenge of Shared Leadership, The American Assemble and World Resources Institute, pp.112-153.
9
Freitas, O. Jr., Horizonte Carregado. Istoe (Brazilian magazine), 21 October, 1992, pp. 36, 37.
10
Helme, N. and Neme, C., Acid Rain: The Problem. EPA Journal, Volumel7, Number 1,
January/February 1991, pp 18-20.
1 1
World Resources Institute, World Resources 1990-1991, New York: Oxford University Press, p. 201. 12
CHAPTER 2;
ENVIRONMENTAL DEGRADATION AND HUMAN
DEVELOPMENT
2.1 Introduction
This chapter establishes relationships between the environmental problems discussed in the previous section and developing human activities. It emphasizes the importance of energy in the industrialization process and highlights the growing role of electricity. The following chapter then reviews regulatory trends.
2.2 Viewing the World as Three Major Economic Blocs
For policy analysis purposes, the World can be divided into three major blocs, each having different developmental problems and environmental issues. First are the industrialized nations, which are responsible for most of the existing environmental damage. Next, there are the centrally-planned economies of the former Soviet Union, its satelite countries, and China, where the current quality of the atmosphere is disastrous, as seen in the last chapter. Finally, there are the developing nations, of which South
American and southeast Asian countries are typical, which are on the verge of imminent development. Depending on the source of reference, India is somtimes associated with the latter group of nations, other times it is not mentionned or associated with less developed nations. For the purposes of this document and corresponding with many other sources, India, Africa and several other nations will not be presented, except in special cases; this is because their industrial development appears in a more distant future than that of the nations mentionned, and is therefore not seen as posing an imminent
threat to atmospheric emissions.
Most data available about environmental degradation and energy consumption is from developed nations. Furthermore, a majority of other nations are following trends identical to those of industrialized nations at the beginning of the industrial revolution. This section will therefore focus on the status in industrialized nations and suggest likely parallels to be followed by the other blocs.
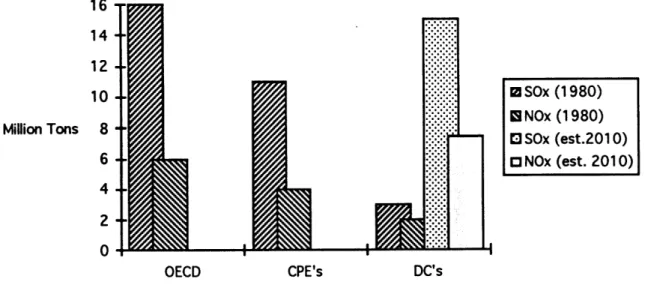
Industrialized countries are the largest source of airborne pollutants, followed by the centrally-planned economies, and developing countries (DC's) trail behind. Figure 1, below, shows the respective contributions of each block to SOx and NOx emissions incurred by the production of electricity; it also shows that, if developing countries follow our pattern of development, they will reach emission levels similar to our present values by the year 2010. This is the key element in present international negotiations and the chart will be referred to in the next chapter of this thesis, in analyzing some of the policy implications of atmospheric regulations.
lb 14 12 10 Million Tons 8 6 4 2 0 m SOx (1 980) 15NOx (1980) 0 SOx (est.2010) O3 NOx (est. 2010) OECD CPE's DC's
Figure 2.1: Distribution of SOx and NOx Emissions Based on Electricity Consumption in Three Major Economic Blocs (Winje, 1991 and OECD, 1989)
In 1987, 36% of the world's primary energy was used for the production of electricity, 31% of which was attributable to developing countries; the share of DC's is expected to grow to 46% of the worldwide energy market given their forecast growth rate of 5.8% which compares to a 3.2% world growth.1 Industrialized nations are currently
responsible for about half of worldwide C02, SOx, and NOx emissions,. These figures are all the more shocking given that industrialized nations only hold about 12% of the world population.
Environmental degradation and particularly atmospheric emissions, are a result of industrialization and population growth. In the last two hundred years, carbon dioxide emissions have grown exponentially as Europe and other OECD nations underwent their industrial revolutions, and energy consumption has grown proportionally. In the
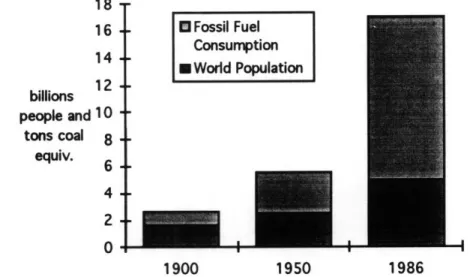
paragraph dealing with US. energy patterns below, Figure 7 shows a three-fold increase in energy consumption between 1949 and 1990. The column chart of Figure 2 establishes
a correlation between population growth and fossil-fuel consumption:
16 14 billions 12 people and 10 ' tons coal 8 -equiv. 6 6- 4-2.
0
SFossil Fuel Consumption N World Population -1900 1950 1986Figure 2.2: World Population and Fossil-fuel Consumption, 1900-1986 (From Brown, 19872)
-4 -I
Such correlation must not be viewed independently however. Energy consumption, which is directly correlated with consumption of fossil fuels, is not the result of population increases only. We argue below that energy use is the result of industrial development. On this basis, if industrialization had taken place uniformly throughout the World, the consumption of fossil fuels might have been greater by an order of magnitude since industrialized nations comprise only about 12% of the World population. This is one main argument used throughout this thesis to support that
environmentally-acceptable technologies must be made easily accessible to developing nations.
The consumption patterns which have resulted from our industrial revolution have allowed us to achieve considerable scientific achievements as well as very high levels of material wealth and these are now seen as life standards which all of humanity is striving to achieve. But the scientific forecasts indicate that similar growth for the remaining 88% of the world population could not be sustained by our natural ecosystem, particularly in the framework of atmospheric decay exposed in the last section. On the right hand side of Figure 1, forecasts for emissions in the year 2010 indicate an average increase by a factor of 4.5 in the amount generated by electricity generation in developing countries; this would result in emissions on the same order as the current emissions of industrialized nations which are causing all the current concern. Hence, developing nations will play an increasingly important part in worldwide emissions.
The data presented by Winje, which served as the basis for Figure 1, shows that, within OECD nations, electricity accounts for about 1/3 of SOx emissions and 1/6 of NOx emissions (16 million tons out of 55 m.t. total for SOx and 6 m.t. out of 37 m.t. for NOx).
Other Sources 71% Electricit y 29%
Figure 2.3: Share of Electricity in SOx Emissions in OECD Nations
(Winje, 1991 & OECD, 1989)
Other
Sources
84%
Electricity
16%
Figure 2.4: Share of Electricity in NOx Emissions in OECD Nations (Winje, 1991 & OECD, 1989)
In the United States, for example, coal-burning electric power plants are the primary source of sulfur dioxide and a leading source of nitrogen oxides. Another section, below, will address evidence that, as an industrial society matures, electricity becomes
the second major factor affecting atmospheric emissions.
2.3 Developed Countries:
2.3.1. Effect of Industrial Development on Energy Consumption
a) Indications of Increasing Energy Consumption
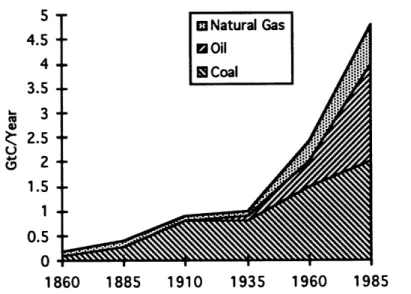
Figure 5 shows the gigantic increase in fossil-fuel consumption since the industrial revolution, with the inlay giving the current distribution among production sources. The exponential growth which followed World War II peaked in the late 70's and slowed down following the major oil shocks.
5 4.5 4 3.5 3 2.5 2 1.5 1 0.5 1860 1885 1910 1935 1960 1985
Fig. 2.5: Growth in Fossil Fuel Consumption and Current Distribution
(Adapted from The Greenpeace Report, 1990)
In spite of improved efficiency and conservation, our lifestyle is such that any dramatic decrease in our energy consumption is very unlikely. Our industries produce more and more goods for us to consume; gradually, we become accustomed to rapid rates of turnaround in our material possessions, with cars being the ultimate example. As production processes have become more efficient, employment has become critically
dependent on the demand for more products; some products are designed to have a limited lifetime in order to ensure a steady demand. More energy is necessary to produce more items and, thus, energy finds itself intrinsically linked to employment. This simple reasoning serves to show that increasing demand for energy is an irreversible process in our developed society.
b) Indications of Decreasing Energy Consumption:
However, historical records show that, as an industrialized society matures, it becomes more energy efficient: in the early phases of industrialization, the development of an industrial base requires large amounts of energy input; in later phases, society shifts to less energy-intensive activities. This trend is reflected in the following graph, where energy intensities are the ratio of total prime energy produced to GDP.
*· / - - LDC's -- - U.K. --- U.S.A. - - - - France -_ Japan Ole ip\ PI II 9 4r I - --IIum -.-- S... I - S.-*. -*5 Ii l O I . * --WB° _ _. •, o ° ° ! • 1850 1880 1910 1940 1960 1970 1980
Note: time scale not linear
Fig. 2.6: Evolution of Energy Intensities in Various Countries
(Adapted from Goldemberg, Energy and the Environment in the 21st Century)
1. 0.8 0.6 -0.4 '- 0.2 0* ,,
Environmental pressures may combine with this trend to further reduce the rate of increase of energy consumption in industrialized nations; this can be seen from the target set by the Toronto Conference and designated on the chart below.
1 -- World - - - - OECD - - - -LDC's+PRC+ --- LDC's+PRC 7000 6000
-5000
-S4000 3000 -4.I
S2000
w 1000-0 CPEs - .- - --- -B - -• - ·- C-I I I I 1970 1975 1980 1985 2010Notes: 1) Arrow indicates target for OECD nations as defined in Toronto Conference
2) OECD is Organzation for Econemic Cooperation and Development, LDC's are Lesser
Developed Countries, CPE's are Centrally Planned Economies, PRC is People's Republic of China Fig. 2.7: World Energy Consumption, 1968-1987
(Adapted from Goldemberg, Energy and the Environment in the2lst Century)
This chart highlights two important points. First, the median energy consumption in
OECD nations has increased slowly, despite the maximum cyclical amplitudes; the
Toronto Conference target attempts to stabilize energy consumption at 1973 levels. Although this seems like a realistic goal due to improved energy efficiency, any further decrease will incur increasing marginal costs and are therefore unlikely.
Secondly, centrally planned economies (CPE's) and lesser developed countries (LDC's) are on a steadily increasing trend of energy consumption. Using the analogy with the
case of industrialized nations, this trend is likely to increase during the initial phase of industrialization and infrastructure development. Assistance from industrialized nations to LDC's in every possible form will be necessary to ensure that their growth follows a more efficient path than the one of present industrialized nations, with reduced impact on the environment.
c) Energy Trends in the United States
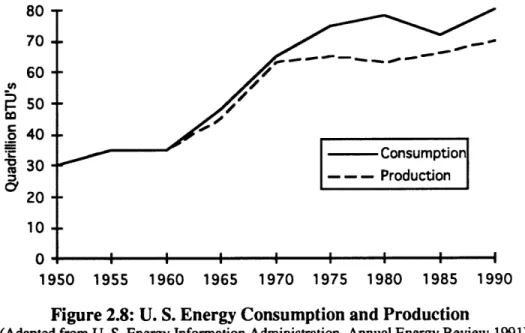
Figure 8, below, illustrates the trend in energy consumption in the United States. The first oil shock gave an impetus for reducing energy consumption. It took a repeated
scenario in the early 80's to seriously reduce the American trend of energy consumption. The position of the present administration is likely to reinforce that trend and to align with other more progressive OECD members.
8070 -60
so
--o. 40 30 Consumption -- ---- Production 20-- 10-1950 1955 1960 1965 1970 1975 1980 1985 1990 Figure 2.8: U. S. Energy Consumption and Production(Adapted from U. S. Energy Information Administration, Annual Energy Review 1991)
This figure also illustrates an increasing gap between domestic production of energy and consumption. This may be the result of foreign trade which makes certain fuels cheaper to import than to produce domestically, rather than suggesting that the United States is
running out of energy supplies, as argued by certain groups of environmental activists.
Figure 8 highlights the importance of the oil shocks in pressuring the United States to reduce its energy consumption: important fluctuations in the petroleum curve match with the timing of reductions in energy consumption on the previous graph. This trend
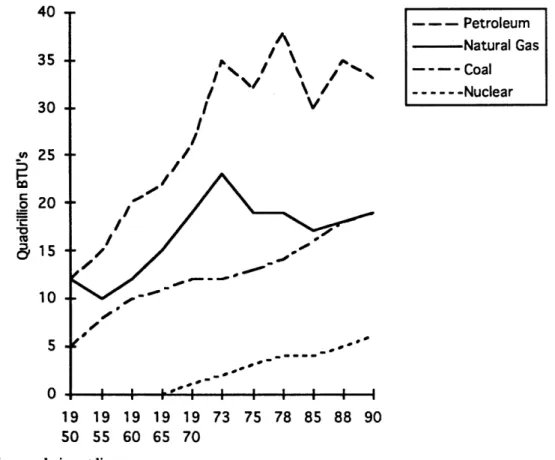
contrasts with a decreasing trend in natural gas consumption and a relatively steady growth in coal exploitation. The timescale of the graph has been expanded in certain time periods to dramatize the effect of the petroleum crises.
A f% -tv 35 30 25 o 20 10 5 0 -- - Petroleum _ Natural Gas - - - - Coal --- - - -Nuclear I 19 19 19 19 19 73 75 78 85 88 90 50 55 60 65 70
Note: time-scale is not linear
Figure 2.9: US. Energy Consumption by Source
(Adapted from Annual Energy Review, U.S. EIA, 1991)
These trends in consumption are in close correlation with those of energy production in the next Figure.
20 . 15 .1 5 0
7E
10
1960 65 70 75 80 85 90Figure 2.10: US Energy Production by Source (Adapted from Annual Energy Review, U.S. EIA, 1991)
This graph clearly shows the steady progression of coal as a growing source of energy. In the latter half of the 80's, natural gas has followed a path similar to that of coal, and the growth rate of nuclear power appears faster yet. Nuclear power development however, is likely to be substantially delayed given the position of the newly-elected administration of the US government.
d) Dominance of Coal as a Fuel for Energy
figure below; in the twenty years between 1965 and 1985, the share held by coal in the
production of electricity has more than doubled.
20-u- 15-
4-I
NU-learI - Oili laoCDEaf'·'·'·'·'·
'·'·'·'
·'·'·'·'·'ii
I '·*******' ******** 1950 1955 1960 1965 1970 1975 1980 1985Figure 2.11: U. S. Electricity Production by Fuel (Adapted from Princiotta, Energy and the Environment in the 21st Century)
Coal accounts for about 60 percent of the fossil-fuel electricity in the world; it remains
highly abundant throughout the world as shown in Figure 12, and it is predicted to remain
a primary source of energy at least through the middle of the next century.
J5UU 3000 2500
S
2000
0) 1500 1000 500 0 Proven Additional + SpeculativeFig. 2.12: World Non-Renewable Energy Sources (From Yeager, Energy and the Environment in the 21st Century)
II·I..,I,,-1
M c a
6 5 4 2 1 0 -Coal 1960 1980 2000 2020 2040 2060
Fig. 2.13: Evolution of World Energy Utilization
(Adapted from World Energy Conference Conservation Commission, 1986) e) Future Trend of Energy Production in Developed Nations:As argued above, energy is a fundamental and irreversible necessity of our every day life.
Consequently, there is a finite base level which can be approached through conservation means and improved efficiency, and which has been tentatively established at the Toronto Conference. We shall see below that one way of improved energy efficiency is through greater electrification of industrial processes. The flattening out of the consumption curve will occur through technological improvements in conservation and production systems.
Despite these goals, our production and distribution processes are so complex that it is difficult to assess the precise environmental benefits of certain technologies. While retrofitting devices, such as catalytic converters on automobile exhaust systems and flue gas desulfurization devices on powerplants, can reduce emissions at the "end of the pipe,"
a true life-cycle analysis may reveal only a transfer of pollution from one area to another: manufacturing the retrofit device consumes energy and produces by-products which offset the environmental savings obtained by its installation.
The trend for exponential growth exhibited in Figure 4, above, is not likely to drop because, as industrialized nations approach their maximum energy use level and turn to more energy-efficient processes, emerging economies will require increasing amounts of energy which will add to the current level of energy used by industrialized nations.
2.3.2 Increasing Role of Electrical Energy
Figure 13 below shows the increasing share of electrical utilities in energy consumption. While the shares of the three other main energy-consuming sectors remain approximately constant, the share of electrical utilities increases from about 15% in 1950 to 40% in
1988.
M Residential 0 Industrial N Transport. 0 Electric Util.
I OU 160 140 $ 120 100 80 60 40 20 0 1950 1960 1970 1980 1990
Fig. 2.14: U. S. Energy Consumption Trend by End-Use Sector (Adapted from US EIA, Annual Energy Review, 1988)
One major reason for this growth can be seen from the trend plotted in Figure 15: as the fraction of energy provided by electricity has risen in the United States, the amount of energy required for each unit of GNP has steadily declined.
I - E/GNP ratio - Electricity 140 120 100 80 60 40 20 0 1880 1900 1920 1940 1960 1980
Fig. 2.15: U. S. Energy / GNP Ratio and Electricity Fraction 1880-1985 (Adapted from Yeager, Energy nad the Environment in the 21st Century)
Given the evidence that electrification helps attain considerable energy efficiency in production processes, it is likely that future economic growth will tend toward even further electrification. Some predict that the role of electricity in the world will continue to grow just as dramatically during the next 50 years as it has during the past 50 years .3
This trend toward improved energy intensity also appears in Japan .4
2.3.3 Conclusion About Industrialized Nations and Energy
This trend toward greater electrification in industrialized nations, along with the current dependence on fossil fuels as a primary energy source, suggests the continuing potential for the burning of fossil fuels.
A shift is predicted however, away from oil towards natural gas and coal. This is shown in Figure 11 above and is confirmed in several independent studies. The 1986
International Energy Outlook (IEO), published by the Energy Information Administration (EIA, part of DOE), states that "oil's contribution to primary energy consumption [will go] from just over 50% of the total in 1980 to...between 38 and 41% [by the year 2000]."
Further,"...about a third of 1985 energy growth occurred in the developing countries [and] consumption between 1985 and the year 2000 is projected to grow the most in the
developing countries (Figure 6).
In support of the previous point about improved energy efficiency with advanced industrialization, the same report points out that the largest forecast growth in
industrialized nations will occur in the service and high-tech sectors, both of which are much less energy intensive than basic industrial infrastructure.
2.4 Eastern Europe and China or Centrally Planned Economies
(CPE's)
2.4.1 Energy Sources in CPE's
The abundance and low price of coal have long supported economies in Eastern Europe, the former Soviet Union, and China. One major problem is that a large part of it is "brown coal" which contains high levels of sulfur.
a) Former Soviet Union and Eastern Block
Roughly 21 percent of the world's proven recoverable coal reserves can be found in Eastern Europe and the former Soviet Union, and speculative estimates suggest up to 74 percent of the world's total coal reserves 5. In Poland, until recently, electricity, coal, and
natural gas were priced at one fourth , one half, and four fifths of world market levels 6
In China, coal supplies three fourths of total energy: at current rates of consumption, reserves could last another 1000 years. Consequently, electricity prices are about 20 percent of global average[Chandler, Makarov, and Dadi]. Major industries in these areas have long relied upon the relative abundance and low costs of these energy resources. Fumes from burning coal is the major source of airborne wastes in these countries. In 1982 alone, for example, China burned nearly 460 million metric tons of coal7.
2.5
Developina Countries
Based on the above logic, it is clear that the development of LDC's will hinge on the production and distribution of electricity to the general population and industry; this opens a large market for the construction of new electrical powerplants.
In comparison with living standards of industrialized nations, developing countries are grossly "under-electrified:" only 15 percent of total world production of electricity
supports 56 percent of global population8. Economies rely on the production of materials and services: selling these goods generates revenue to the manufacturers and sellers, and the state picks up a tax on the transaction. These taxes then serve to finance the
development of an infrastructure to promote social welfare and facilitate the generation of more outputs, the sale of which will increase the standard of living of the society. One fundamental element of production systems is the availability of energy: without energy, there is no way to transform any raw material into a finished product with an associated increased value. In our "civilized" lifestyle, energy has also become a basic element of human life: household electricity is a prerequisite for all appliances and electricity is
necessary to support most parts of the social infrastructure, from hospitals to communications. Many developing nations have neither electricity as a household commodity, nor even as a commercially-available resource for their industries.
The communications revolution has contributed to setting the living standard of
industrialized nations as a target for all other nations. This will accelerate the demand for industrialization and electrification in two ways:
* First, it raises the lowest acceptable living conditions: "the world" sees electricity as a
primary necessity for any human society.
* Secondly, awareness of higher lifestyles creates demand for "modern" products. Since
importing them from industrialized nations is impossible due to the disproportion in currency values, there is additional incentive for local manufacturing.
Figure 16 shows the United Nations Population Fund (UNFPA) estimates for the growth of world population and emphasizes that 90 percent of total predicted future population growth is expected to be concentrated in developing countries.
I
II ace nv rnintrie llnPvv•inn•rl Nntinn_I
9 8 7 6
2
5
4 3 2 1 0 1950 1965 1980 1995 2010 2025Fig. 2.16: Growth of World Population (Adapted from N. Sadik, UNFPA, 1989)
The enormous contribution this may make to future C02 emissions is shown in Figure 17. o0 -70 -S60 -€ 50 40 -S30 O 20 -10 -0 . -I-- +f -I
Fig. 2.17: Contribution to Global Human-made C02 Emissions (Yeager, Energy and the Environment in the 21st Century, from C. Starr, 1989)
Figures 2.1, 2, and 3 of this section highlighted the forecast growth of emissions from electricity generation in developing nations: between 1987 and the year 2010, the average emissions from LDC's is expected to increase by a factor of 4; the forecast for SOx is of 15 Million tons. Furthermore, based on the OECD example, emissions from electricity generation would only represent about 1/3 of total SOx emissions.
Many nations still lack modern generation facilities for supplying electricity, and
transmission systems from those few power plants that do exist cover only small regions.
a) Problems Compounded by Deforestation. Decreasing C02 Sink
The following phenomena may be cited as additional important sources of airborne wastes in rural areas of developing countries: