O
pen
A
rchive
T
OULOUSE
A
rchive
O
uverte (
OATAO
)
OATAO is an open access repository that collects the work of Toulouse researchers and
makes it freely available over the web where possible.
This is an author-deposited version published in :
http://oatao.univ-toulouse.fr/
Eprints ID : 16765
To link to this article : DOI:10.1149/2.0101608jes
URL :
http://dx.doi.org/10.1016/j.carbon.2016.05.010
To cite this version :
Tułodziecki, Michal and Tarascon, Jean-Marie
and Taberna, Pierre-Louis and Guéry, Claude Non-Equilibrium
Ionic Liquid-Electrode Interface at Elevated Temperature and Its
Influence on Co2+Reduction Process. (2016) Journal of The
Electrochemical Society, vol. 163 (n° 8). pp. D355-D365. ISSN
0013-4651
Any correspondence concerning this service should be sent to the repository
administrator:
[email protected]
Non-Equilibrium Ionic Liquid-Electrode Interface at Elevated
Temperature and Its Influence on Co
2+Reduction Process
M. Tułodziecki,aJ.-M. Tarascon,b,cP.-L. Taberna,dand C. Gu´erya,z
aLaboratoire de R´eactivit´e et Chimie des Solides and ALISTORE European Research Institute, UMR CNRS 7314, UFR des Sciences, 80039 Amiens cedex, France
bChimie du Solide et Energie, UMR 8260, Coll`ege de France, Berthelot, 75005 Paris, France cReseau sur le Stockage Electrochimique de l’Energie (RS2E), FR CNRS 3459, France
dCIRIMAT/LCMIE and ALISTORE European Research Institute, UMR CNRS 5085, 31062 Toulouse cedex 9, France
Electrodeposition in Ionic Liquid (IL) media is still at its infancy stage. Recently much attention is devoted to exploration of the IL-electrode interface for better understanding of the electrochemical processes at the electrified surfaces. Herein, we provide a new perspective of the temperature-driven IL-substrate interface structuring. We observed an increase in Co2+reduction kinetics induced by applying a high temperature gradient. In contrast, keeping the cell at a high constant temperature (100◦C) leads to slower Co2+reduction kinetics, it results in a shift of the reduction onset and evolution of the cyclic voltammogram shape with time. We could ascribe these phenomena to the disturbance of the electrochemical double layer (induced by heating) and its further slow reorganization at constant temperature. We showed that such non-equilibrium behavior can be beneficial for the synthesis of metallic thin films from ILs. Electrochemical quartz crystal microgravimetry, impedance spectroscopy, cyclic voltammetry and chronoamperometry were employed within this work.
Ionic Liquids (ILs) are superior media for electrodeposition pro-cess as they overcome the main drawbacks of common aqueous, organic and molten salts electrolytes. They offer high thermal and electrochemical stability, are not flammable, have negligible vapor pressure and high ionic conductivity.1,2 Thanks to these attractive
properties, ILs are considered as alternative media to molecular sol-vents for electrolytes in electrochemical devices (batteries, superca-pacitors, transistors)3–8or reacting media for synthesis of organic and
inorganic compounds (metals, alloys, sulfides, oxides).9–12Moreover,
ILs can be tailor designed to meet specific properties, hence broaden-ing their area of application.13
A primary issue, regarding electrochemical devices, is the struc-ture of the electrochemical double layer (EDL), which depends on the solvent and the electrode’s substrate. It has been proven both theoretically14–17and experimentally18–23that the IL’s ions are highly
structured and form layered EDL on either metal19or metal oxide23
based electrodes. Depending on surface polarization, the arrangement and conformation of the anions and cations may change to screen the excess surface charge more efficiently.14–16,18,21,24When polarized, the
biggest changes within EDL are observed in the first adjacent layer; the strength of ion-electrode interactions,18the compacity,23,25the
confor-mational changes of ions24vary greatly within this particular layer.
In case of further layers minor effects were observed as thickening of the ordered layer.18,23Moreover, different kinds of superstructures
and surface reconstructions have been observed, especially at single crystal electrodes.18,21,26–28
The kinetics of the interfacial processes can vary from microsec-onds to even few days.29–33In this context, Anderson et al.32found that
2h conditioning of a bismuth single crystal electrode in pyrrolidinium based IL leads to a thicker EDL and the creation of superstructures. Endres and Atkin et al.18,34reported that nearly one day is required
for an IL-gold interface to reach equilibrium after its disturbance by polarization. Lastly, Dr¨uschler et al.29reported a slow EDL charging
process with a time scale of few seconds as probed by electrochemical impedance spectroscopy.
Such complex structures have already shown to have a tremen-dous impact on the electrochemical processes. Katayama et al.35,36
found that the strong ordering of the EDL causes the slow reduction kinetics of metal cations (i.e. need for high overpotentials). Endres and coworkers37,38reported that the electrochemical response of the
system as well as physical properties of metal deposits were very dif-ferent, depending on the IL cation, and they ascribed it to the EDL
zE-mail:[email protected]
structure. Additionally, the strong electric field induced at the Ionic Liquids-oxides interface was found to activate the oxygen vacancy formation which is of great importance in transistors field.6–8
However, despite intensive investigation of the anomalous EDL structure in ILs (reconstructions, slow relaxations, conformational changes), our understanding of the influence of different parameters (temperature, bath composition) on the EDL and consequently on the real electrochemical process is still slim. Any change in experimental conditions that can affect the EDL can also affect the rates of the heterogeneous electron transfer processes. In our recent studies, we have shown that the changes in EDL structure upon polarization had a tremendous impact on the reduction kinetics of metal cations depend-ing on the applied negative potential.39Herein, we report the influence
of the heating rate (rapid or slow) on the Co2+ reduction process as
well as evolution of the system at constant high temperature. We show that both the way of heating and keeping the cell at elevated tempera-tures affects the Co2+reduction kinetics in great extent. We also show
the beneficial effect of disturbing the interfacial structure for growing metallic thin films of controlled morphology by electro-deposition in ILs.
Experimental
Various electrochemical baths were made by dissolving M(TFSI)2
(M = Co, Zn, Ni, Mn) salts in three selected ILs EMImTFSI, BMPTFSI, and BMImTfO, all purchased from Solvionic, Table I. These 99.9% pure (H2O < 0.005%) ILs were purified under vacuum
at 75◦C for 2 days prior to being used, so that the final water content
was ∼6–20 ppm as deduced by Karl Fischer measurement. All chem-icals were handled and stored in an argon-filled glove box (O2 and
H2O < 0.1 ppm).
A three-electrode set-up was used for electrochemical measure-ments (chronoamperometry, cyclic voltammetry, impedance spec-troscopy). Three different substrates, planar platinum electrode (Ptp)
Table I. Abbreviations of the ILs.
EMImTFSI 1-ethyl-3-methylimidazolium bis(trifluoromethylsulfonyl)imide BMPTFSI N-butyl-N-methylpyrrolidinium bis(trifluoromethylsulfonyl)imide BMImTfO 1-butyl-3-methylimidazolium trifluoromethylsulfonate
Table II. Calibration of the Ag|Ag2O reference electrode at
different conditions.
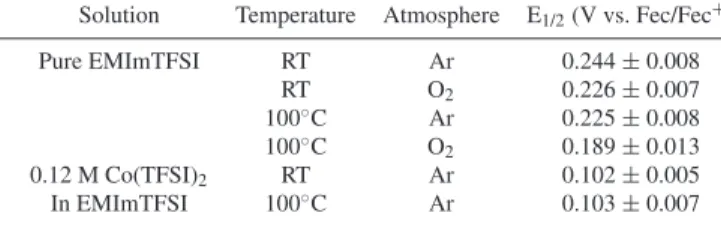
Solution Temperature Atmosphere E1/2(V vs. Fec/Fec+)
Pure EMImTFSI RT Ar 0.244 ± 0.008 RT O2 0.226 ± 0.007 100◦C Ar 0.225 ± 0.008 100◦C O 2 0.189 ± 0.013 0.12 M Co(TFSI)2 RT Ar 0.102 ± 0.005 In EMImTFSI 100◦C Ar 0.103 ± 0.007 S = 0.020 cm2, platinum wires (Pt
w) and stainless steel wires (SSw),
were used as working electrodes (WE). The surface area of the wire-type electrodes was estimated according to the length of the submersed fraction of the electrode (surface ranging from 0.017 to 0.033 cm2). A
platinum grid with high surface area (S ≈ 2 cm2) and an Ag wire
cov-ered with Ag2O were used as counter electrode (CE) and pseudo
refer-ence electrode (RE), respectively. The stability of RE was checked by reproducibility of the cyclic voltammetry (CV) curves of Co2+/Co and
ferrocenium/ferrocene redox processes between multiple experiments and with time in single experiment. The CVs were highly reproducible even after few days of immersion in the cell. The RE was calibrated versus the ferrocenium/ferrocene redox couple. The mid-point poten-tials (E1/2 = EOx+E2 Red) at different conditions are given in TableII.
The obtained values were reproducible with maximum deviation of ±13 mV. All potentials are given versus the pseudo Ag|Ag2O
refer-ence electrode. Prior to being used, the platinum WEs were polished with 0.1 µm abrasive paper and electrochemically activated in 0.5 M H2SO4 by CV with a scanning rate of 500 mV/s, (the CV profile
was comparable with standards representative of an impurity free Pt surface).40,41 Next, the electrodes were rinsed with distilled
wa-ter, ethanol, acetone and deionized water. The counter electrode was cleaned in 0.5 M nitric acid in an ultrasonic bath for 1h, and then intensively rinsed with distilled water, ethanol, acetone and deionized water. All the components of the cell were dried in an oven at T = 50◦C for at least 12 hours prior to the experiment. Preparation of the
solution, assembly and sealing of the cell were done in a glove box. The sealed cell (with controllable atmosphere) was then transferred out of the glove box for further manipulation. The seal of the cell was checked by monitoring the water content evolution over time. After 6 hours outside the glove box, water uptake of only 1–2 ppm was detected meaning that the cell was well sealed. Two heating methods were studied i) fast heating that induces high temperature gradients and ii) slow heating resulting in low temperature gradients. In case of fast heating, the electrochemical cell was immersed directly in the hot bath (either 60◦C or 100◦C). The temperature equilibration time
was 15 min – as measured by EQCM. For slow heating method, the cell was heated progressively in few steps with heating rate of 1◦C
per minute. After each step of 1T = 20◦C, the cell was isothermally
conditioned for 1 h. All heating processes of the cell were done with the WE electrode being at open circuit potential (OCP) if not other-wise specified. The temperature of the oil bath was controlled within ±2◦C accuracy at 100◦C.
The electrochemical measurements were carried out with an Auto-lab PGSTAT 30 potentiostat (Eco Chemie BV). The electrochemical impedance spectroscopy (EIS) measurements were done on the Ptp
electrode at a fixed potential that is the OCP value determined prior to starting each EIS measurement. It means that during the measurement the potential is fixed while in between the measurements the cell is left at OCP. The fixed potential is superimposed with 10 mV amplitude AC signal. The impedance data were measured within the frequency range from 1 MHz to 100 mHz.
Electrochemical quartz crystal microbalance (EQCM) measure-ments were conducted using a commercial SEIKO microbalance (SEIKO QCA 922) with AT-cut 9 MHz quartz covered with plat-inum on both sides. The electro-active geometric surface area was S = 0.196 cm2. Simultaneous measurements of the quartz frequency
and motional resistance were performed in order to follow both the change in weight of electrode and the variation in Co2+concentration
in the vicinity of the electrode (by following the change of viscosity and density product of the solution).39,42,43The EQCM was calibrated
with a CV measurement in 0.05 M solution of AgTFSI in EMImTFSI, at 100◦C, with 2 mV · s−1scanning rate. The proportionality constant
(C = 1m/1f) was determined between the change of quartz fre-quency (1f) and change of deposited mass (1m).44A constant value
C = 1.065 · 10−9g · Hz−1close to the theoretical one C
t=1.068 · 10−9
g · Hz−1was found, suggesting that issues regarding viscosity of the
bath or roughness of the deposit can be neglected. Three different ex-periments were performed: 1) identifying the frequency and motional resistance changes with time as the bath is being fast heated up and then kept at 100◦C for 8 h 2) checking the effect of long time
condi-tioning at 100◦C on chronoamperometric deposition of Co at −0.9 V
and 3) CV in anodic direction after 8 h of heating.
The obtained deposits on quartz crystal were soaked in chloro-form to remove adsorbed IL from the surface. Their morphology and elemental analysis was further checked using a Philips XL 30 field emission gun FEG microscope.
All experiments were performed at least twice to check the re-peatability.
Results
Cyclic voltammetry in pure EMImTFSI.—Before studying the reduction process of Co2+, the blank CVs were conducted in pure
EMImTFSI on a Ptp electrode at RT and 100◦C. Two half cycles
(cathodic and anodic, each on a freshly prepared electrode) were recorded starting from OCP (Fig.1). During the cathodic half cycle (red curves), a small reduction wave – (R1) was observed at both
tem-peratures. Most likely, the R1signal originates from the reconstruction
of an interfacial layer, as reported in literature29,45(specific adsorption
of ions, rearrangement of ions). On the anodic half cycle, an oxidation signal – (O1) and corresponding reduction signal – (R2, clearly visible
in CV at RT) were observed. The nature of O1signal is not clear both
the EDL reconstruction and/or beginning of ILs decomposition could be responsible for it.
-0.15 -0.10 -0.05 0.00 0.05 0.10 -2.0 -1.5 -1.0 -0.5 0.0 0.5 1.0 1.5 2.0 -0.15 -0.10 -0.05 0.00 0.05 0.10 b) EMImTFSI, 100 °C j / m A · cm -2 a) EMImTFSI, RT E vs (Ag|Ag2O) / V j / m A · cm -2
O
1R
1R
2R
1O
1Figure 1. Half cycles in pure EMImTFSI under Ar atmosphere a) at RT and b) at 100◦C. The red curves represent the cathodic half cycle and black anodic ones. WE – Ptp, CE – Pt, RE – Ag|Ag2O, scan rate 5 mV · s−1. A freshly prepared electrode was used for each measurement.
Both, the cathodic and the anodic sweeps end with a progressive increase in current density due to the decomposition of the IL. The cathodic (Ec) and anodic (Ea) limits were determined from Tafel plots
(Supporting Information Fig. 1∗). Values of −1.85 and −1.70 V for Ec
at RT and 100◦C were obtained, respectively. In the case of the anodic
limit, the potential of 1.7 V was estimated for both RT and 100◦C.
Within these potential ranges, electrochemical processes should not be affected by the decomposition of EMImTFSI, hence it was selected for our experiments.
CV of 0.12 M Co(TFSI)2 solution in EMImTFSI.— Heating method dependence.—Next, the electrochemical response of 0.12 M Co(TFSI)2solution at Ptwelectrode was studied at different
temper-atures. Firstly, we compared the influence of the heating step on the reduction process of the Co2+ cations. Two experiments were
per-formed i) fast heating by dipping the cell in pre-heated bath and ii) slow heating by a step-wise increase of temperature (see experimen-tal). For fast heating, the CVs were recorded with 30 min delay after immersion of the cell in the hot bath, while for slow heating, the CVs were recorded 15 min after the bath reached the desired temperature. The difference in delay accounts for the time needed for the bath to reach desired temperature (see experimental).
For both heating methods, the reduction sweeps at RT, 60◦C and
100◦C, are shown in Figure2. In all the cases, two reduction peaks (I,
II) separated by a drop in current density were observed. As studied in our previous work,39the two reduction waves are due to Co
plat-ing, while the intermittent drop in current is caused by double layer reconstruction that hinders the electrochemical process. Nevertheless, the shape and reduction onset of the first peak changes greatly with both the temperature and heating method. In case of fast heating (solid lines), the intensity of the first reduction peak increased greatly with temperature. Moreover, the onset of the reduction process shifted to higher potentials (RT −0.94 V; 60◦C −0.85 V; 100◦C −0.70 V). For
slow heating (dashed lines), the intensity of the first reduction signal increased as well, however only small changes of the reduction onset were observed (RT −0.94 V; 60◦C −0.94 V; 100◦C −0.92 V). Lastly,
comparing the CVs for the two heating methods, we can clearly see that the onsets of the reduction processes are shifted to more positive values for the fast heating method. Considering that the reduction overpotential is related to EDL structure,35 the difference in onset
potential is most probably due to the disturbance of the EDL caused by a high temperature gradient.46,47This effect is discussed more in
detail in the discussion part.
The CV dependence on temperature in case of the fast heating is in agreement with studies by Katayama et al.35,48where they also
-2.0 -1.5 -1.0 -0.5 0.0 -4 -3 -2 -1 0 Slow heating up Fast heating up RT 60 °C 100 °C 60 °C 100 °C
j
/
m
A
·c
m
-2 E vs (Ag|Ag2O) / VReduction sweeps at different temperatures
I
II
Figure 2. Reduction sweeps of 0.12 M Co(TFSI)2 solution in EMImTFSI at different temperatures, comparison of slow and fast heating process. black solid curve – RT, red (60◦C) and green (100◦C) solid curves correspond to fast heating and blue (60◦C) and brown (100◦C) dashed lines correspond to slow heating. WE – Ptw, CE – Pt, RE – Ag|Ag2O, scan rate 5 mV · s−1. A freshly prepared electrode was used for each measurement.
observed a shift of the reduction signal to positive values with increas-ing temperature (Co2+35and Ni2+48reduction processes). However,
lack of information on the method of heating and huge differences in the shape of the reduction curve limits direct comparison with our results.
Evolution of the system with time at high constant temperature.—
Further, we checked the evolution of the reduction process with time when the cell is being kept at a constant temperature (RT, 60◦C and
100◦C), which was reached with either a slow or fast heating method.
At room temperature (Fig.3a), the reduction sweeps did not reveal any significant changes with time; the CVs were reproducible even after 64 h.
In the case of the fast heated system to 60◦C (Fig.3b), a small
shift of the Co2+ reduction onset was observed from −0.85 V to
−0.96 V after 11 h. For 100◦C, more drastic changes were witnessed
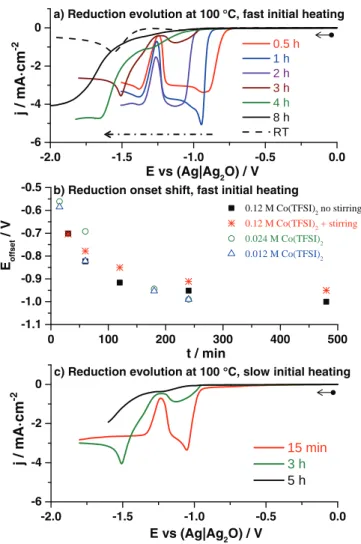
(Fig.4a). After 2 hours, the onset of the first reduction peak rapidly shifted to lower potentials (from E = −0.7 V to E = −0.92 V) and its shape changed. For longer times, the reduction onset stabilized at around −1 V (Fig.4b), while the intensity of the first reduction peak strongly diminished. Finally, after 8 h, we obtained a curve that was similar in shape to the one found at RT, with the exception of the lower voltage part where the decomposition of the ionic liquid takes place (<−1.7 V). Such changes are accompanied by a slight variation of the OCP value (1EOCP=70 mV) that stabilizes for times longer than
8 hours (SI, Fig. 2∗).
In the case of a slow heated system to 100◦C (Fig.4c), an evolution
in the intensity of the first peak was also observed. After 5 h (black line), we obtained a curve like the one observed for fast heated system after 8 h (Fig.4a- black solid line). However, only minor changes in the reduction onset were observed (from Eonset= −0.92 V to Eonset=
−0.95 V after 5 h).
From the above constant temperature experiments, the presence of two coupled effects can be distinguished. First, the reduction onset
-2.0 -1.5 -1.0 -0.5 0.0 -3 -2 -1 0 1 b) CV evolution at 60 °C j / m A · c m -2 E vs (Ag|Ag2O) / V 1 h 2 h 4 h 12 h 64 h E vs (Ag|Ag2O) / V j / mA · c m -2 a) CV evolution at RT -2.0 -1.5 -1.0 -0.5 0.0 -3 -2 -1 0 1 0.5 h 11 h
Figure 3. Evolution of reduction sweeps with time at constant temperature (fast heated). a) RT, black curve – 1 h, red curve – 2 h, green curve – 4 h, blue curve – 12 h, brown curve – 64 h. b) 60◦C, black curve – 30 min and red curve – 11 h. 0.12 M Co(TFSI)2solution in EMImTFSI. WE – Ptw, CE – Pt, RE – Ag|Ag2O, scan rate 5 mV · s−1. A freshly prepared electrode was used for each measurement.
0 100 200 300 400 500 -1.1 -1.0 -0.9 -0.8 -0.7 -0.6
-0.5 b) Reduction onset shift, fast initial heating
0.12 M Co(TFSI)2 no stirring 0.12 M Co(TFSI)2 + stirring 0.024 M Co(TFSI)2 0.012 M Co(TFSI)2 Eoffset / V t / min -2.0 -1.5 -1.0 -0.5 0.0 -6 -4 -2 0
a) Reduction evolution at 100 °C, fast initial heating 0.5 h 1 h 2 h 3 h 4 h 8 h RT j / mA · cm -2 E vs (Ag|Ag2O) / V -2.0 -1.5 -1.0 -0.5 0.0 -6 -4 -2 0 15 min 3 h 5 h
c) Reduction evolution at 100 °C, slow initial heating
j / m A · c m -2 E vs (Ag|Ag2O) / V
Figure 4. a) Evolution of reduction sweeps with time at constant temperature T = 100◦C (fast heated), red curve – 30 min, blue curve −1 h, violet curve – 2 h, brown curve – 3 h, green curve – 4 h, black curve −8 h, black dashed curve – RT reference. b) The shift in reduction onset versus time at 100◦C, for 0.12 M Co(TFSI)2 solution non-stirred – solid black squares, 0.12 M Co(TFSI)2 solution stirred one – red stars, 0.024 M Co(TFSI)2 solution – green open circles, 0.012 M Co(TFSI)2solution – blue open triangles. c) Evolution of reduction sweeps with time at constant temperature T = 100◦C (slow heated), red curve – 15 min, green curve – 3 h, black curve – 5 h. WE – Ptw, CE – Pt, RE – Ag|Ag2O, scan rate 5 mV · s−1. A freshly prepared electrode was used for each measurement.
potential shift to lower values (only for the fast heated system for both 60◦C and 100◦C). Second, the diminishment of the first reduction
wave with time that occurs in both systems (fast and slow heated). To gain further insight into the CV shape change at 100◦C, we
studied its variation as function of the stirring conditions and cobalt concentration. These two parameters did not affect the trend in re-duction curve change; Strong decrease at the beginning of the heating process and its further stabilization at E ∼ −1 V was again observed (Fig.4b). In addition, the intensity of the first reduction wave de-creased with time (SI, Fig. 3∗) in similar manner to previous
experi-ments at 100◦C. This indicates that the change in the curve shape at
100◦C is due to interfacial phenomena rather than diffusion of cobalt
species. There are at least two possibilities to account for this sce-nario, which include formation of i) a strongly blocking double layer and/or ii) a passivation layer due to chemical decomposition – solid electrolyte interface (SEI). In order to distinguish between those two paths, the evolution of the interface at 100◦C was investigated by an
EQCM and impedance spectroscopy experiments.
EQCM measurements.—The applied EQCM experiment protocol consisted of i) setting the potential at a predetermined OCP value at RT, ii) fast heating to 100◦C (dipping the cell in the pre-heated bath)
and maintaining it at this temperature for 8 hours while monitoring the frequency and motional resistance of the quartz. Similar experiments were also conducted in pure IL for reference.
Figures5a,5b,5cshows the EQCM results, in 0.12 M Co(TFSI)2
solution in EMImTFSI, of the heating (domain I) and constant tem-perature (domain II) steps together. During the initial heating (I), a sharp increase in frequency and decrease in motional resistance was observed. We ascribed it mainly to changes in viscosity/density pa-rameters of the electrolyte, which are temperature dependent.49
During the process of keeping the cell at 100◦C (II), we observed
a stabilization of both frequency and resistance. The curves are not smooth but rather noisy due to the presence of small intensity os-cillations (30–80 Hz, 4–13 Ä). We found that small variations in temperature (±2◦C) are at the origin of these oscillations, as both
the frequency and the temperature oscillation periods were very simi-lar (8–9 min). The maximum/minimum of the frequency corresponds very well with the minimum/maximum of the motional resistance, even for the highest variation, SI Fig. 4∗. Thus, we ascribed them to
changes in both viscosity/density of the IL and properties of the quartz crystal.50,51The linear trend plot of the frequency and motional
resis-tance (domain II), resulted in almost parallel lines to the x axis (Fig.
5green lines), indicating no mass changes at the electrode surface. For the sake of completeness, a similar EQCM measurement was carried-out on pure IL, with the only difference being that the cell
0.0 0.1 0.2 0.3
c) Motional resistance change
b) Frequency change a) Current profile 0 200 400 600 800 1000
t / min
0 100 200 300 400 500 1000 1050 1100 1150∆
f
/
H
z
R
/
Ω
j
/
µ
A
·c
m
-2I
II
Figure 5. EQCM measurement – long time conditioning at 100◦C at fixed potential (predetermined OCP) a) current versus time b) change in frequency versus time c) quartz motional resistance change versus time for all experi-ments. The black dashed line divide the figure to 2 parts: I – heating up, II – constant T = 100◦C. 0.12 M Co(TFSI)
2, T = 100◦C, WE – Pt mirror pol-ished on quartz, CE –Pt, RE- Ag|Ag2O. 100◦C was reached with fast heating method.
0 10 20 30 40 0 10 20 30 40 b) d) c) Pure EMImTFSI 0.5 h 1 h 2 h 4 h 6 h 8 h Reference RT Zreal / kΩ·cm2 -Z im . / k Ω ·c m 2 a) 0.12M Co(TFSI)2 0 10 20 30 40 50 0 10 20 30 40 50 0.5 h 1 h 2 h 4 h 6 h 8 h Zreal / kΩ·cm2 -Z im. / k Ω ·cm 2 0 10 20 30 40 50 60 0 10 20 30 40 50 60 Real Capacitance / µF·cm-2 Imaginary Capacitance / µ F ·c m -2 0 20 40 60 80 0 20 40 60 80 Imaginary Capacitance / µ F·cm -2 Real Capacitance / µF·cm-2
3350 Hz
0.2 Hz
2120 Hz
0.3 Hz
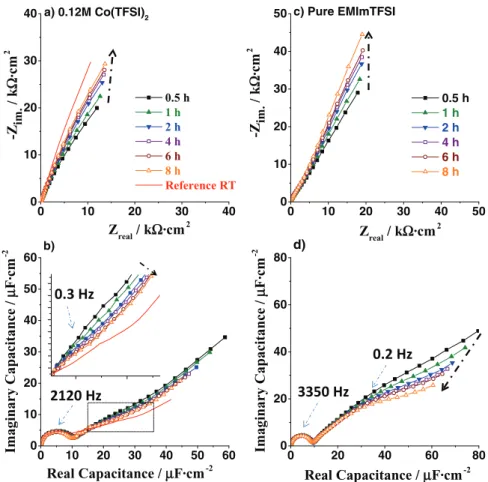
Figure 6. Impedance spectroscopy a) Nyquist plots and b) complex capacitance curves (cole-cole plots) of 0.12M Co(TFSI)2 solution at 100◦C at E = OCP at differ-ent times; c) Nyquist plots and d) complex capacitance curves (cole-cole plots) of pure EMImTFSI at 100◦C at E = OCP at different times. 30 min - black solid squares, 1 h - green solid triangles, 2 h - blue turned triangles, 4 h - purple open squares, 6 h - brown circles, 8 h – orange open triangles. The inset in part b) represents zoom of the curves at very low frequencies inside the black dashed square. WE – Ptp, CE –Pt, RE- Ag|Ag2O. 100◦C was reached with fast heating method.
was kept at OCP during all the experiment, SI, Fig. 5∗. The curve
trends were similar to the one obtained in 0.12 M Co(TFSI)2solution.
Namely, we observed a large increase in frequency during initial heating and constancy of the frequency and motional resistance when the temperature is kept constant at 100◦C for 8 h.
The constancy of the frequency and motional resistance, in both experiments, suggests that no formation of an extra organic/inorganic layer took place at 100◦C.
Electrochemical impedance spectroscopy (EIS).—Next, the evo-lution of IL-electrode interface at 100◦C was probed by EIS
surements at fixed potential (determined OCP prior to each EIS mea-surement); the results are reported in Figures6aand6b. The initial heating, for all the EIS experiments, was done by dipping the cell in a pre-heated bath (fast heating). The Nyquist curves (Fig.6a) ob-tained at different times look almost identical except in the very low frequency region where a continuous shift to higher values of the imaginary part of the impedance is observed (the dashed arrow in Fig. 6a). Interestingly, Nyquist curves deviated at low frequencies from the linear behavior characteristic of the blocking electrode; this is commonly observed in systems where either strong adsorption of ions at the electrode takes place31,52,53or/and due to the roughness of
the electrode surface.54,55Parasitic side reactions could also lead to a
curvature of the linear law; however bearing in mind the high purity of ILs, the faradaic processes are unlikely (The IL’s stability window is more than 3 V). This conclusion can be further confirmed by the cole-cole capacitance plots (Fig.6b) showing clear evidence for two capacitive phenomena. First, the high frequency semi-circle, which does not change with time, is ascribed to double layer charging.31,52,53
In contrast, the second arc at low frequencies (rectangular zone) is evolving with time to lower values of the imaginary part of the capac-itance (Fig.6binset). This low frequency arc can be ascribed to either the specific adsorption of ions at the electrode surface31,52,53 and/or
increased ordering of the EDL as suggested by Merlet et al.56
Different equivalent circuits, presented in Figure7, were tested to fit the impedance spectra, however only the last two (Figs.7d,7e) gave a good fit to experimental values (SI Fig. 6∗). Circuit d), consists
of an adsorption branch, a resistor (charge transfer) and a capacitor (double layer charging) in parallel. Circuit d) has already been used to describe the double layer phenomena in ILs by Siinor et al.53On
the other hand, circuit e) is a combination of two parallel adsorption branches57in parallel with a capacitor (double layer charging). This
circuit was proposed by Gnahm et al.31 and Muller et al.58for the
interface between imidazolium-based ILs and a single crystal Au electrode. Nevertheless, both circuits are empirical and the physical meaning of the circuit elements is not well understood. Thus, we intend to use the fitting process mostly for the visualization of the system trends. In the case of circuit e), the elements R2and C3were
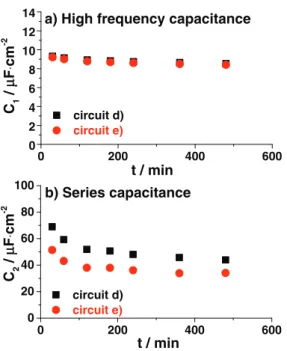
omitted, as they resulted in very high fittings errors (see also Ref.58). Figure8represents the evolution of the high frequency capacitance C1and the series capacitance C2(low frequency). Both circuits give
a) b) c) d) e) R1 C1 R1 R1 R1 R1 C1 C1 C1 C1 C2 C2 C2 C2 R2 R2 R2 R2 Wd2 W d3 Wd2 C3 R3 Wd2
Figure 7. The equivalent circuits used to fit the EIS data. a) perfect capacitor, b) Frumkin-Melik-Gaikazyan circuit, c) standard circuit describing adsorption phenomena Ref.57d) circuit used in Ref.53e) circuit used in Ref.31,58.
0 200 400 600 0 2 4 6 8 10 12 14 0 200 400 600 0 20 40 60 80 100 circuit d) circuit e) circuit d) circuit e) b) Series capacitance C1 / µ F ⋅c m -2 t / min
a) High frequency capacitance
C2 / µ F ⋅c m -2 t / min
Figure 8. The evolution of C1(high frequency) – and C2(series capacitance) elements fitted with circuit d) black solid squares and circuit e) red solid circles.
very comparable results in terms of magnitude and trends. For the high frequency capacitance C1,only a small decrease was observed
with time, which accounts for 8% of the total capacitance. The value of C1(9 µC · cm−2) is comparable to the one found in literature,31,53,58
which is ascribed to the standard double layer charging phenomena. In contrast to C1, the C2 value drastically drops with time (35%
change after 8 h). Additionally, the shape of the curve (fast drop at the beginning and stabilization after 6 h) is very similar to the change of the reduction onset shift discussed before (Fig.4b). Both, the trend and magnitude of drop indicate that the low frequency phenomenon is related to the reduction onset shift at constant temperature. The value of C2≈60-30 µC · cm−2corresponds well to the one found by Gnahm
et al.31 and Siinor et al.,53 where they assigned the low capacitive
phenomena to the specific adsorption of ions at the electrode surface. Lastly, it is worth mentioning that we experienced a similar features of the EIS spectra in pure IL solution (Figs.6c,6d), meaning that the changes of the system at 100◦C with time is an internal property of IL
itself and not of the [Co(TFSI)3]−complex.
Effect of the interface evolution on the chronoamperometric Co deposition process.—After establishing the scientific platform of elec-trochemical behaviors in IL at high temperature, we report here a practical example of system evolution at 100◦C influence on the
de-position process and deposit quality. The dede-position was done at fixed potential of −0.9 V using EQCM. The limiting parameter was the quartz crystal frequency change of 40 kHz. Two experiments were performed, the first after 30 min (Figs.9a,9b,9c) and the second after 8 h (Figs.9d,9e,9f) of heating at 100◦C. In both cases, the initial
heating was done by dipping the cell in pre-heated bath (fast heating). In case of the experiment recorded after 30 min, a classical chronoamperogram of a plating process was observed (Fig.9a, black curve). The corresponding changes in resistance (drop) and frequency (drop) indicate consumption of Co2+species and formation of deposit
over the electrode surface (Figs.9a,9b). The calculated equivalent mass - M/z value, from the slope of frequency versus charge, was 27.5 g · mol−1(SI Fig. 7a∗) that is close to the theoretical value of a
two electron Co2+reduction process (29.5 g · mol−1). This indicates
the high efficiency of the cobalt plating process. The obtained Co thin films were visually uniform, shiny, and well attached. They were made of ∼50 nm grains; additionally, random outgrowths of ∼1 µm spherical agglomerates were spotted on the top of the deposit (see
0 100 200 300 400 -8 -6 -4 -2 0 -50 -40 -30 -20 -10 0 0 200 400 600 800 1000 -2.0 -1.5 -1.0 -0.5 0.0 -50 -40 -30 -20 -10 0 0 100 200 300 400 860 880 900 920 940 0 200 400 600 800 1000 900 1000 1100 1200 8 h heating R / Ω j / m A · cm -2 e) d) b) R / Ω ∆ f / kHz ∆ f / kHz t / s t / s t / s t / s j / m A · cm -2 a) 30 min heating c) f) I II III
Figure 9. Chronoamperometric EQCM deposition at −0.9 V at 100◦C. Pro-cess after 30 min - a) current density and frequency change versus time b) motional resistance change c) SEM image of the obtained deposit. Process after 8 h - d) current density and frequency change versus time e) motional resistance change f) SEM image of the obtained deposit. 0.12 M Co(TFSI)2, WE – Pt mirror polished on quartz, CE –Pt, RE- Ag|Ag2O. 100◦C was reached with fast heating method.
insert in Figure9c). The deposit was composed of Co with traces of F, S and O coming from residual IL, as studied by energy dispersive spectroscopy (EDS).
The electrochemical deposition process after 8 hours (Figs.9d,
9e,9f) is more complex, as conveyed by the presence of the growth domains (I, II, III) separated by blue dashed lines on the curves. In the first region (up to 400 s), very low current densities together with tiny changes in frequency and motional resistance were observed, in-dicating high hindrance of the Co2+reduction process. According to
the CV (Fig.4a), the reduction of Co2+should not take place (E onset<
−0.9 V after 8 h of heating); however the chronoamperometric exper-iment was done by direct switching of potential from OCP to −0.9 V. This method is very different from the one used for CV experiments (slow decrease in potential). This change in the conditions might lead to a different state of the interface as it was briefly addressed in the recent paper by Carstens et al.59Nevertheless, the reduction of Co2+
was greatly hindered indicating the presence of a very strong barrier. Moving toward the end of region I (300–400 s), a significant increase in current density was observed. The increased reduction kinetics with time could be due to perforation of the blocking layer by slow depo-sition of Co particles. Despite the higher current rates, the frequency changes remained small, meaning that most of the produced Co was poorly adhesive. This is in agreement with our visual observation as we observed black particles floating in the bath. Reaching the second region (400–500 s), a continuous increase in current density accompa-nied by a progressive decrease in quartz frequency was observed. This indicates an enhancement of the adhesive plating process. For times greater than 500 s (region III), the drop in frequency was significantly increased, with the stabilized current density being nearly the same as for the short heating deposition process. The continuous increase in motional resistance in region III (Fig.9e) is most likely due to the rough morphology of the deposit as deduced from scanning electron
microscopy (SEM) images (Fig.9f). The obtained deposit was well attached to the electrode but not uniform and not shiny compared to the previous one. It was composed of a very thin compact layer with large ball-like agglomerates on the surface (Fig.9f). The EDS elemental analysis showed that deposit was made of Co with traces of F, S and O coming from residual IL. Lastly, the calculated M/z value in region III was equal to 30.8 g · mol−1, (SI, Fig. 7b∗). Despite
high increase of resistance (that may potentially affect the frequency change), the obtained M/z value is close to the theoretical one for the Co plating reaction (M/z = 29.5 g · mol−1). For regions I and II, the
M/z values lower than 10 g · mol−1were solely found due to deposit
detachments.
Expanding observations to other systems.—At this stage, we have unambiguously established the existence of a temperature-driven evo-lution of Co2+ reduction process that has a tremendous impact on
the properties of the deposited cobalt thin films. Thus, the ques-tion remains whether these phenomena are specific to the nature of the cation, IL formulation, and substrate used in the above experi-ments. For all the experiments in this part fast heating process was done.
Firstly, the IL formulation has been investigated by changing either the cation to BMP+ or the anion to TfO− (Figs. 10a and
10b, respectively). The CV curves revealed similar features in both cases, with 2 reduction waves separated by a shallow drop in current density, which is less pronounced for the BMP+ based IL.
More-over, the shift in reduction onsets and evolution of the shape of the curve at 100◦C (fast heated cell) is similar to the one observed for
EMImTFSI.
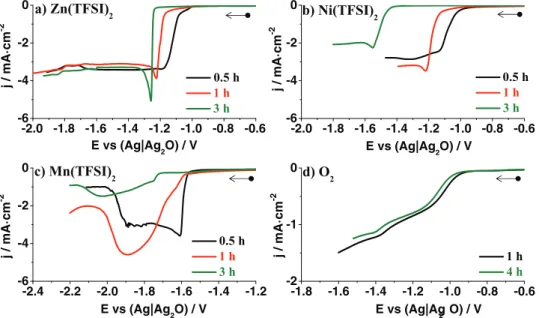
Turning to the importance of the electroactive species, we in-vestigated three different cations (Zn2+, Ni2+, Mn2+) together with
molecular oxygen (Figs. 11a, 11b, 11c and11d, respectively). All baths containing metal cations show shifts of the reduction potential onsets and change of the curves shape. However, the magnitude of the shift varied depending on the cation and is the largest for Ni2+
as compared to both Mn2+and Zn2+(SI, Fig. 8∗). In contrast,
mea-surements of the oxygen reduction revealed no change of the current profile shape and only small shift (<30 mV) of the reduction potential onset. The drastically different behavior of molecular oxygen reduc-tion, as compared to metal cations might be related to the nature of the O2 molecule. We previously found60that the oxygen reduction
-1.6 -1.4 -1.2 -1.0 -0.8 -0.6 -0.4 -4 -3 -2 -1 0 -1.6 -1.2 -0.8 -0.4 0.0 -0.8 -0.6 -0.4 -0.2 0.0 E vs (Ag|Ag2O) / V b) BMIMTfO 0.5h 1h 2h 4h 8h 0.5h 1h 2h 4h 8h j / m A · cm -2 E vs (Ag|Ag2O) / V j / mA · cm -2 a) BMPTFSI
Figure 10. Reduction sweep curves of 0.12 M Co(TFSI)2 solution in a) BMPTFSI and b) BMImTfO at 100◦C at different times. WE – Pt
w, CE – Pt, RE – Ag|Ag2O, scan rate 5 mV · s−1. A freshly prepared electrode was used for each measurement. 100◦C was reached with fast heating method.
process is overruling metal plating when both O2and metal cations
are present in the electrochemical bath even if the later one starts to reduce at higher potentials. Such behavior was attributed to the small size and neutrality of oxygen molecules, which can easily penetrate through the blocking layers at the interface, in contrast to large metal cation complexes.
Finally, the nature of the substrate was investigated using a stainless steel wire as the working electrode (Fig.12a). The shift in reduction onset and the curve shape change were observed, with however a
milder evolution as compare to a Pt substrate, especially at the begin-ning of heating process (Fig.12b).
The above experiments clearly show that the temperature driven changes in electrochemical reaction are not specific to Co2+reduction
in EMImTFSI. The observed phenomena can be extended to other
-2.0 -1.8 -1.6 -1.4 -1.2 -1.0 -0.8 -0.6 -6 -4 -2 0 j / m A · c m -2 b) Ni(TFSI) 2 c) Mn(TFSI) 2 0.5 h 1 h 3 h j / m A · c m -2 j / m A · c m -2 -2.0 -1.8 -1.6 -1.4 -1.2 -1.0 -0.8 -0.6 -6 -4 -2 0 d) O2 0.5 h 1 h 3 h a) Zn(TFSI)2 -2.4 -2.2 -2.0 -1.8 -1.6 -1.4 -1.2 -6 -4 -2 0 E vs (Ag|Ag2O) / V j / m A · c m -2 E vs (Ag|Ag2 O) / V E vs (Ag|Ag2O) / V 0.5 h 1 h 3 h E vs (Ag|Ag2O) / V -1.8 -1.6 -1.4 -1.2 -1.0 -0.8 -0.6 -2 -1 0 1 h 4 h
Figure 11. Reduction sweep curves of EMImTFSI solution at 100◦C at different times containing: a) 0.12 M Zn(TFSI)
2, b) 0.12 M Ni(TFSI)2, c) 0.12 M Mn(TFSI)2and d) O2saturated (WE - Ptp). WE – Ptw, CE – Pt, RE – Ag|Ag2O, scan rate 5 mV · s−1. A freshly prepared electrode was used for each measurement. 100◦C was reached with fast heating method.
-1.6 -1.4 -1.2 -1.0 -0.8 -0.6 -0.4 -6 -4 -2 0 b) 0.5 h 1 h 2 h 4 h 6 h 8 h E vs (Ag|Ag2O) / V j / m A · c m -2 0 100 200 300 400 500 -1.1 -1.0 -0.9 -0.8 -0.7 -0.6 Ptw SSw t / min Eo n s e t / V a)
Figure 12. a) Reduction sweep curves of 0.12 M Co(TFSI)2 solution in EMImTFSI on stainless steel electrodes at 100◦C at different times and b) the corresponding reduction onset potential shift. WE – SSw, CE – Pt, RE – Ag|Ag2O, scan rate 5 mV · s−1. A freshly prepared electrode was used for each measurement. 100◦C was reached with fast heating method.
systems considering change in IL, electroactive species and electrode nature.
Reversing the evolution of the system.—The hindrance of the reduction signal at 100◦C is rather undesirable since the reason of
increasing the temperature is to improve the reduction process rate. Nevertheless, we found that an enhancement in the deposition rate, after long time conditioning at 100◦C, can be partially restored by
applying an oxidative pretreatment. Fig.13shows the CV curve after 8 h of heating initiated in anodic direction (the black curve). After the anodic sweep, the reduction profile has changed greatly; the first reduction wave followed by a drop in current density appear again on the CV curve in contrast to untreated electrode (green dashed curve). Thus, the system state was partially reset with the CV response corre-sponding to 2–3 h of heating according to Figures4aand4b. Interest-ingly, the shape of the curve and reduction onset potential (–0.95 V)
-2.0 -1.5 -1.0 -0.5 0.0 0.5 1.0 1.5 2.0 -6 -4 -2 0 2
4 Oxidative pretreatment + reduction Reduction without oxidative pretreatment
E vs (Ag|Ag2O) / V j / m A · c m -2 0.0 0.5 1.0 1.5 2.0 0.00 0.05 0.10 Oxidative pretreatment
Figure 13. CV curves of 0.12 M Co(TFSI)2 solution in EMImTFSI kept at 100◦C for 8 h, black curve - CV initated in anodic direction, green dashed curve – reduction sweep without oxidative pretreatment obtained on a different electrode. The inset represents a magnification of oxidation scan. WE – Ptw, CE – Pt, RE – Ag|Ag2O, scan rate 5 mV · s−1. 100◦C was reached with fast heating method.
are very similar to the one found for slow heating method, Figure2
brown dashed line. This indicates, that the oxidative pretreatment sup-press the system changes caused only by high temperature T = 100◦C
(disappearance of the first reduction peak) rather than the one coming from the high temperature ramp (shift of the reduction onset).
From chronoamperometric and CV experiments carried out at var-ious oxidative potentials (SI Fig. 9∗and 10∗), we could deduce that
the process responsible for the partial system reset is already triggered at 1.3 V. This potential corresponds to the onset of the small oxidation wave (green arrow, inset Fig.13). The same oxidation signal was ob-served in pure IL at both RT and 100◦C (Fig.1– O
1) independently
on the heating process.
To characterize the nature of the oxidation process the EQCM measurement was done in 0.12 M Co(TFSI)2 solution by means of
CV initiating in anodic direction. The collected data including first CV curve and the corresponding changes in frequency and resistance, are shown in Figure14. For the sake of clarity and conciseness, the characteristic color domains, which are repeated in the three plots, were used. During the oxidation process ranging from 1 to +1.5 V (blue/violet domain Fig.14a), we observed a decrease in frequency of ∼50 Hz (Fig.14b) which corresponds to a constant motional resistance (Fig.14c). This implies that the frequency change can be attributed to a mass increase at the electrode surface of about 270 ng/cm2. Such small
mass change could be due to ion exchange phenomena as studied by Tsai et al.46We further analyzed the oxidation signal by performing
a second subsequent CV scan. Interestingly, the oxidation signal did not appear (SI Fig. 11∗) despite the very slow scan rate (2 mV/s)
that allows for diffusion of the species toward the electrode. This suggests that the nature of the signal is not due to some electroactive species in the bulk, as those would give at least a small signal on the subsequent scan. Consequently, the second scan can be treated as a background that can be subtracted from the first CV scan; as a
0.0 0.5 1.0 1.5 2.0 0 40 80 0.0 0.5 1.0 1.5 2.0 0 5 10 15 20 b) frequency change ∆ f / Hz a) CV curve 0.0 0.5 1.0 1.5 2.0 600 640 680 720 0.0 0.5 1.0 1.5 2.0 1015 1020 1025 1030 j / µ A ⋅c m -2
c) motional resistance change
R /
Ω
E vs (Ag|Ag2O) / V
Figure 14. First anodic cycle of an EQCM experiment performed after 8 h of heating a) current density profile, b) frequency versus potential, c) motional resistance versus potential. The colors are the indexing pattern. The black circles indicate pure mass change area. WE – Pt mirror polished on quartz, CE – Pt, RE – Ag|Ag2O, scan rate 2 mV · s−1. The inset on part a) represents the oxidation sweep after background correction. 100◦C was reached with fast heating method.
result (Fig.14a- inset) a well-shaped symmetrical oxidative peak is obtained confirming the lack of diffusion controlled phenomena.
Additional CV experiments with extended reduction reverse po-tential were conducted on a Ptw electrode (Figs. 15a, 15b). Once
the reduction sweep is reversed at −0.5 V, the oxidation signal ap-pears again on the subsequent oxidation sweep, with however slightly shifted potential to more negative values. The existence of a corre-sponding reduction process indicates the reversible nature of the phe-nomenon. The above characteristics suggest a surface phenomenon without a diffusion-limiting step to be at the origin of the oxidative process at 1.5 V.
For the sake of completeness, similar EQCM measurement was carried-out on pure IL. The CV result, after 8 h of heating (SI, Figure 12∗), has shown a small increase in weight during the oxidation at
+1.5 V, which was equal to the weight decrease during the corre-sponding reduction sweep. This indicates again high reversibility of this phenomenon independently of the presence of Co2+ ions.
Sur-prisingly in pure IL the corresponding reduction process takes place at much higher potentials that could be due to differences in the EDL structure when Co2+is not present in the solution.
Similarly to the reset of the CV curve shape by oxidative pre-treatment we should expect same changes on EIS spectra. Indeed, the evolution of EIS spectra is also reset by performing an oxidative pretreatment (SI, Fig. 13∗). The imaginary part of impedance shifts to
lower values at low frequency after oxidative pretreatment, while only slight change was observed for the high frequency process. This con-firms the correlation of slow frequency phenomena with the evolution of the system at constant temperature.
Discussion
Through our study, we have reported that the reduction process of metal cations in IL media at 100◦C is highly dependent on the heating
method and is changing with time at constant high temperature. We
0.0 0.5 1.0 1.5 2.0 -0.04 -0.02 0.00 0.02 0.04 0.06 1 scan 2 scan j / mA ⋅c m -2 E vs Ag|Ag2O / V
a) lack of the oxidation on the second scan
-0.5 0.0 0.5 1.0 1.5 2.0 -0.04 -0.02 0.00 0.02 0.04
0.06 b) appearance of oxidation peak after
the reducion sweep to -0.6V
3 scan 4 scan j / m A ⋅cm -2 E vs Ag|Ag2O / V
Figure 15. Successive CV curves of 0.12 M Co(TFSI)2 solution in EMImTFSI at 100◦C a) 1stand 2ndscans b) 3rdand 4thscans, showing the corresponding reduction process. WE – Ptw, CE – Pt, RE – Ag|Ag2O, scan rate 5 mV · s−1. Successive scans were performed on the same electrode.
have shown that improved kinetics of Co2+reduction can be assessed
when the cell is exposed to high temperature gradients. However, during the long conditioning at constant temperature a shift in the reduction onset toward lower potentials and significant changes in the CV curve shape were observed, leading to a hindrance of the reduction process. This indicates formation of a blocking layer at the electrode surface. Our EQCM results have shown no change in the electrode mass with time at T = 100◦C. This indicates that the phenomena
responsible for the system evolution are rooted in the existence of physical interactions taking place at the electrode-IL interface rather than the formation of an extra organic/inorganic layer. This was further confirmed by the EIS results that have shown the presence of a slow capacitive phenomenon due to specific ion adsorption to be at the origin of the system evolution. It suggest that the temperature-driven shift of the reduction process is of a physical nature, but the remaining burning question regards the mechanism of this phenomenon.
It has been previously reported46,47,61 that temperature gradients
can disturb the ordered structure of the EDL in aqueous solutions followed by reorganization when the temperature gradient is absent. There is no reason why such a situation would not hold for ILs. Figure16represents a schematic of possible mechanism of the EDL changes at elevated temperature at negatively charged surface. At RT, when increasing the electrode’s negative charge, the EDL tends to strongly order forming ion layers with the IL’s cations facing di-rectly the electrode surface.18–22It is worth noting that even at OCP
a layered ordering is present.62 During fast heating to 100◦C, the
system is exposed to high temperature gradients with a concomitant disturbance of the EDL structure present at RT. This is in agreement with the time/temperature driven variation of OCP value (SI, Fig. 2∗). We believe that applying negative polarization just after
heat-ing leads to lower orderheat-ing (Fig.16II) as compare to RT (Fig.16I). Such a disturbance leads to easier accessibility of the electrode sur-face, thus a much smaller overpotential is needed for reduction of the large [Co(TFSI)3]− complexes. This is in accordance with our CV
experiments performed with different heating rates. For small gradi-ents of temperature, the EDL disturbance is not expected and conse-quently it will result in smaller changes of reduction onset, as shown in Figure2.
At constant temperature T = 100◦C, the EDL tends to reorganize
with time (formation of ordered structures, Fig.16III), as observed in the case of aqueous solutions by Garcia-Araez et al.46,47,61However,
the time of this process in our case might be significantly longer owing to larger thermal movements of the ions at elevated temperature, as well as a complex structure of the ions.18,33,34The increased ordering
IL cation [Co(TFSI)3]-complex IL anion
+ - +
-Fast hea4ng up to 100 °C
Ordered EDL at RT (I) Lose in Order (II)
Long 4me T = 100 °C
+ - +
-New ordering of EDL (III) + specific ions adsopr4on
Reordering of EDL (IV)
+ - - + Reordering of EDL (V) + - + - + --
-Figure 16. Schematic representation of EDL structure at negatively charged electrode at different steps: RT state, after fast heating, long term conditioning at 100◦C. We stress that this schematic is just a visualization of our hypothesis.
leads to greater overpotentials for the Co2+ reduction process and
the evolution of the CV curve shape to a state somewhat similar to the one found at RT, where the EDL is highly ordered. Nevertheless, some differences in EDL are present as suggested from the observed CV at RT (SI Fig. 14∗) of heat-treated and pristine electrodes, with
the former one being more blocking. The exact nature of the interfa-cial rearrangement is not well understood; an increase in temperature could enable additional stable conformations of ions or induce strong physi/chemisorption.63Certainly further in-situ studies are needed to
gain deeper molecular inside into the interfacial processes. In partic-ular, AFM and STM techniques on single crystal electrodes would be crucial to access this information.
Going deeper into the +1.5 V oxidation process, we believe that applying positive polarization triggers a major reconstruction of the EDL with the cations being repelled from the electrode surface, while the anions are attracted (Fig.16IV). This exchange of ions could ex-plain both i) the gain in mass observed by the EQCM experiment during oxidation at +1.5 V and ii) the loss in mass during the cor-responding reduction process, as the TFSI−ions have almost three
times higher molar mass than EMIm+ions. On the successive
reduc-tion sweep, at −0.5 V, the reverse reconstrucreduc-tion takes place, namely the anions are repelled from the surface while the cations are at-tracted, thus forming an ordered EDL with adjacent layer reach in cations (Fig.16V). Nevertheless, the properties of this EDL (V) are different as compare to the one obtained during long term isothermal heating (III). The new ordered EDL is less blocking leading to en-hanced kinetics of Co2+reduction (as was shown on Figure13). This
suggestion is further supported by the shift of the oxidation signal at 1.5 V to more negative potentials during successive CV cycling (Fig.15). During the first oxidation scan (after 8 h of heating), the EDL reconstruction might be harder to take place due to the spe-cific adsorption of ions; thus a higher oxidative potentials have to be applied to trigger the reconstruction. Moreover, the electrochemi-cally induced reconstruction does not lead to a disordered EDL as the one found after applying high temperature gradient (II). Therefore, no significant shift of the reduction onset will take place. Summing up this part, the oxidative pretreatment resets the specific adsorption phenomena responsible for the hindrance of the first reduction peak, but it does not make disordered EDL structure as the one from high temperature gradient. This reasoning is in agreement with our CV curves; the CV obtained after oxidative pretreatment was similar (Fig-ure13) to the one recorder after 15 min of heating for the slow initial heating method (small temperature gradient, Figure2brown dashed curve).
With respect to the electrochemical growth of materials as thin films, a strong evolution of the EDL layers during the heating process can lead to non-reproducible data if monitoring of the time domain is omitted. However, mastering of temperature effects can lead to the formation of high quality (uniform, compact, adherent) metal coatings together with an enhancement of the deposition rates. This is a serious asset when using ILs that usually show sluggish kinetics. We believe that our results could be of great help in solving today’s challenges encountered when depositing metals from ILs. Disturbing interfacial structures with the methods shown in this report can improve these processes.
Conclusions
We have reported the influence of fast and slow heating process and long term conditioning at high temperatures on the reduction of Co2+ cations in ionic liquid media, based on the electrochemical
quartz crystal microgravimetry, cyclic voltammetry, chronoamperom-etry, impedance spectroscopy and scanning electron microscopy ex-periments. We observed improved kinetics of Co2+reduction when the
system is exposed to a high temperature gradient. However, at 100◦C,
the Co2+ reduction kinetics slowed down with time. The reduction
onset potential shifted to more negative values while the intensity of the first reduction wave greatly diminished. The EQCM and EIS measurements suggest physical interactions of ions and the electrode
surface cause these phenomena. We deduced that the system evolu-tion is related to the ordering process of the EDL that was disturbed by applying a temperature gradient during heating from RT to 100◦C
(dynamic state of the EDL). This process is not specific to the reduc-tion of Co2+in EMImTFSI since we have showed herein that it also
occurred in BMPTFSI and BMImTfO and for different cations (Zn2+,
Ni2+, Mn2+).
Finally, the paper shows the importance of controlling the heating process and its influence on the deposit quality. We found that the de-position of cobalt in non-equilibrated systems leads to better quality deposits (uniformity, morphology, adherence). It also gave an addi-tional parameter for controlling the deposit morphology (thin compact layer and 3D agglomerates made of ball-like grains were synthesized). We hope that our findings will help in mastering the deposition of both metal and oxide thin films from ILs at elevated temperature.
Acknowledgment
The authors thank to ALISTORE European Research Institute for the financial support to conduct the research.
References
1. H. Ohno, Electrochemical Aspects of Ionic Liquids, John Wiley & Sons, Inc., New Jersey, 2005.
2. F. Endres, A. P. Abbott, and D. R. MacFarlane, Electrodeposition from Ionic Liquids, WILEY-VCH Verlag GmbH & Co. KGaA, Weinheim, 2008.
3. H. Liu, Y. Liu, and J. Li, “Ionic liquids in surface electrochemistry,”Phys. Chem. Chem. Phys., 12, 1685 (2010).
4. N. Madria, T. A. Arunkumar, N. G. Nair, A. Vadapalli, Y.-W. Huang, S. C. Jones, and V. P. Reddy, “Ionic liquid electrolytes for lithium batteries: Synthesis, electro-chemical, and cytotoxicity studies,”J. Power Sources, 234, 277 (2013).
5. D. R. MacFarlane, N. Tachikawa, M. Forsyth, J. M. Pringle, P. C. Howlett, G. D. Elliott, J. H. Davis, M. Watanabe, P. Simon, and C. A. Angell, “Energy ap-plications of ionic liquids,”Energ. Enviro. Sci., 7, 232 (2014).
6. J. Jeong, N. Aetukuri, T. Graf, T. D. Schladt, M. G. Samant, and S. S. P. Parkin, “Suppression of Metal-Insulator Transition in VO2 by Electric Field–Induced Oxygen Vacancy Formation,”Science, 339, 1402 (2013).
7. P. R. Pudasaini, J. H. Noh, A. Wong, A. V. Haglund, S. Dai, T. Z. Ward, D. Mandrus, and P. D. Rack, “Ionic Liquid versus SiO2Gated a-IGZO Thin Film Transistors: A Direct Comparison,”ECS J. Solid State Sci. Technol., 4, Q105 (2015).
8. P. R. Pudasaini, J. H. Noh, A. T. Wong, O. S. Ovchinnikova, A. V. Haglund, S. Dai, T. Z. Ward, D. Mandrus, and P. D. Rack, “Ionic Liquid Activation of Amorphous Metal-Oxide Semiconductors for Flexible Transparent Electronic Devices,”Adv. Funct. Mater., 26, 2820 (2016).
9. Z. Ma, J. Yu, and S. Dai, “Preparation of Inorganic Materials Using Ionic Liquids,”
Adv. Mater., 22, 261 (2010).
10. D. R. MacFarlane, J. M. Pringle, P. C. Howlett, and M. Forsyth, “Ionic liquids and reactions at the electrochemical interface,”Phys. Chem. Chem. Phys., 12, 1659 (2010).
11. X. Duan, J. Ma, J. Lian, and W. Zheng, “The art of using ionic liquids in the synthesis of inorganic nanomaterials,”CrystEngComm, 16, 2550 (2014).
12. G. G. Eshetu, M. Armand, B. Scrosati, and S. Passerini, “Energy Storage Materials Synthesized from Ionic Liquids,”Angew. Chem. Int. Edit., 53, 13342 (2014). 13. N. V. Plechkova and K. R. Seddon, “Applications of ionic liquids in the chemical
industry,”Chem. Soc. Rev., 37, 123 (2008).
14. J. Vatamanu, L. Xing, W. Li, and D. Bedrov, “Influence of temperature on the capacitance of ionic liquid electrolytes on charged surfaces,”Phys. Chem. Chem. Phys., 16, 5174 (2014).
15. J. Vatamanu, O. Borodin, and G. D. Smith, “Molecular insight into the potential and temperature dependence of the differential capacitance of a Room-Temperature Ionic Liquid at graphite electrodes,”J. Am. Chem. Soc., 132, 14825 (2010).
16. E. Paek, A. J. Pak, and G. S. Hwang, “A Computational Study of the Interfacial Struc-ture and Capacitance of Graphene in [BMIM][PF6] Ionic Liquid,”J. Electrochem. Soc., 160, A1 (2013).
17. M. V. Fedorov and A. A. Kornyshev, Ionic Liquids at Electrified Interfaces,”Chem. Rev., 114, 2978 (2014).
18. R. Atkin, N. Borisenko, M. Dr¨uschler, S. Zein El Abedin, F. Endres, R. Hayes, B. Huber, and B. Roling, “An in situ STM/AFM and impedance spectroscopy study of the extremely pure 1-butyl-1-methylpyrrolidinium tris(pentafluoroethyl)trifluorophosphate/Au(111) interface: potential dependent sol-vation layers and the herringbone reconstruction,”Phys. Chem. Chem. Phys., 13, 6849 (2011).
19. T. Carstens, R. Hayes, S. Zein El Abedin, B. Corr, G. B. Webber, N. Borisenko, R. Atkin, and F. Endres, “In situ STM, AFM and DTS study of the interface 1-hexyl-3-methylimidazolium tris(pentafluoroethyl)trifluorophosphate/Au(111),”Electrochim. Acta, 82, 48 (2012).
20. H. Zhou, M. Rouha, G. Feng, S. S. Lee, H. Docherty, P. Fenter, P. T. Cummings, P. F. Fulvio, S. Dai, J. McDonough, V. Presser, and Y. Gogotsi, “Nanoscale