Université de Montréal
Modélisation toxicocinétique d’un mélange de composés
organiques volatils dans l’eau potable
Par
Nazanin Kaveh
Département de santé environnementale et santé au travail Faculté de médecine
Mémoire présenté à la Faculté des études supérieures en vue de l’obtention du grade de Maîtrise ès Sciences (M.Sc.) en santé environnementale et santé au travail
Avril 2012
ii
Université de Montréal Faculté des études supérieures
Ce mémoire intitulé :
Modélisation toxicocinétique d’un mélange de composés
organiques volatils dans l’eau potable
Présenté par: Nazanin Kaveh
A été évalué par un jury composé des personnes suivantes:
Professeur Michel Gérin, président rapporteur Professeur Kannan Krishnan, directeur de recherche
Professeure Michèle Bouchard, membre du jury
RÉSUMÉ
L'évaluation des risques de l'exposition aux mélanges de produits chimiques par voies multiples peut être améliorée par une compréhension de la variation de la dose interne due à l’interaction entre les produits. Les modèles pharmacocinétiques à base physiologique (PBPK) sont des outils éprouvés pour prédire l'ampleur de ces variations dans différents scénarios.
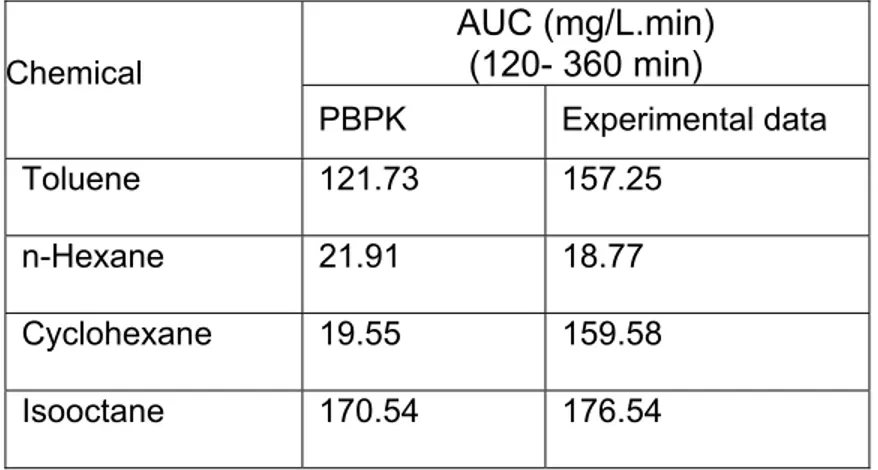
Dans cette étude, quatre composés organiques volatils (COV) (toluène, n-hexane, cyclohexane et isooctane) ont été choisis pour représenter des produits pétroliers (essence) pouvant contaminer l'eau potable. Premièrement, les modèles PBPK ont simulé l'exposition à un seul COV par une voie (inhalation ou gavage). Ensuite, ces modèles ont été interconnectés pour simuler l'exposition à un mélange par voies multiples. Les modèles ont été validés avec des données in vivo chez des rats Sprague-Dawley (n=5) exposés par inhalation (50 ppm ; toluène, hexane, et 300 ppm ; cyclohexane, isooctane; 2-h) ou par gavage (8,3; 5,5; 27,9 et 41,27 mg/kg pour le toluène, l’hexane, le cyclohexane et l’isooctane, respectivement). Des doses similaires ont été utilisées pour l'exposition au mélange par voies multiples. Les AUC (mg/L x min) pour le toluène, l'hexane, le cyclohexane et l'isooctane étaient respectivement de 157,25; 18,77; 159,58 et 176,54 pour les données expérimentales, et 121,73; 21,91; 19,55 et 170,54 pour les modèles PBPK. Les résultats des modèles PBPK et les données in vivo (simple COV par voies multiples vs. mélange par voies multiples) ont montré des interactions entre les COVs dans le cas de l'exposition au mélange par voies multiples. Cette étude démontre l'efficacité des modèles PBPK pour simuler l'exposition aux mélanges de COV par voies multiples.
Mots clé :
iv
ABSTRACT
Risk assessment focusing on exposure to mixtures by multiple routes can be improved with an understanding of the changes in internal doses due to interaction among chemicals. Physiologically based pharmacokinetic (PBPK) models are proven tools to predict the magnitude of interaction in various scenarios. In this study, four volatile organic compounds (VOCs) (toluene, n-hexane, cyclohexane and isooctane) were chosen to represent petroleum products that could contaminate the drinking water (e.g. gasoline). PBPK models were used first to simulate exposure to a single chemical by a single route (inhalation, gavage) and simulate exposure to a mixture by multiple routes. PBPK models were validated by comparing simulations with in vivo data. These data were collected from groups of male Sprague-Dawley rats (n=5) exposed by inhalation (50 ppm of toluene, hexane; 300 ppm of cyclohexane and isooctane; 2-hr) or gavage (8.3, 5.5, 27.9, and 41.27 mg/kg, respectively, for toluene, hexane, cyclohexane and isooctane). For exposure to the mixture by multiple routes, same doses were used. The AUCs (mg/L x min) based on experimental data were 157.25, 18.77, 159.58 and 176.54 and the AUCs of the PBPKs model were 121.73, 21.91, 19.55 and 170.54, respectively, for toluene, hexane, cyclohexane and isooctane. Results from both PBPK models and in vivo data (single VOC, multiple routes vs. mixture, multiple routes) showed interactions between VOCs in the case of exposure to the mixture by multiple routes. This study demonstrated that the PBPK model is an effective tool to simulate exposure to mixtures of VOCs by multiple routes.
Keywords:
TABLE OF CONTENTS
RÉSUMÉ ... iii
ABSTRACT ... iv
TABLE OF CONTENTS ... v
LIST OF TABLES ... viii
LIST OF FIGURES ... x
ABBREVIATIONS ... xiv
ACKNOWLEDGEMENTS ... xvii
CHAPTER 1: GENERAL INTRODUCTION 1.1. Development of guideline values for drinking water ... 3
1.2. Toxicokinetic and toxicity characterizations of toluene, n-hexane, cyclohexane and isooctane ... 9
1.2.1. Toluene ... 10 1.2.1.1. Toxicokinetics... 10 1.2.1.2. Toxicity ... 11 1.2.2. n-Hexane ... 12 1.2.2.1. Toxicokinetics... 12 1.2.2.2. Toxicity ... 12 1.2.3. 2,2,4-Trimethilpentane (isooctane) ... 13 1.2.3.1. Toxicokinetics... 13 1.2.3.2. Toxicity ... 13 1.2.4. Cyclohexane ... 14
vi
1.2.4.1. Toxicokinetics... 14
1.2.4.2. Toxicity ... 14
1.3. Previous studies on multi-routes exposures and interaction among toluene, n-hexane, cyclohexane and isooctane ... 14
1.4. Objective and originality of this study ... 14
CHAPTER 2: ARTICLE I PBPK modeling of the aggregate exposure of rats to n-hexane or isooctane by inhalation and oral gavage ... 18
Short Abstract ... 19
Abstract ... 20
Introduction ... 21
Materials and methods ... 22
Results ... 28 Discussion ... 32 Conclusion ... 36 References ... 37 List of figures ...49 CHAPTER 3: ARTICLE 2 PBPK modeling of the aggregate and cumulative exposures of rats to toluene, n-hexane, cyclohexane and isooctane ... 53
Introduction... 55
Materials and methods ... 57
Results ... 63
Discussion ... 66
Conclusion... 70
References ... 71
List of figures………...85
CHAPTER 4: GENERAL DISCUSSION Discussion ... 106
CHAPTER 5: REFERENCES References ... 112
viii
LIST OF TABLES
Chapter 1: General introduction
Table 1: Major classes of chemicals present in petroleum hydrocarbon
products ... 8
Table 2: Summary of key toxicokinetic and toxicity features of toluene,
n-hexane, cyclohexane and isooctane ... 9
Chapter 2: Article 1
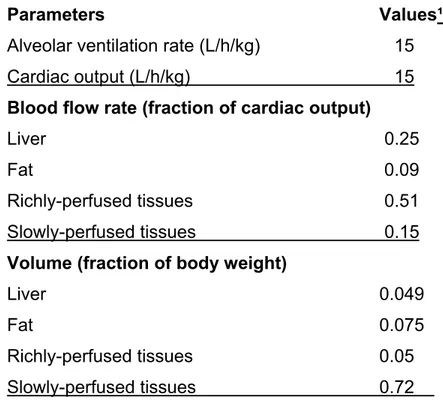
Table 1: Physiological parameters in rats used in PBPK models for n-hexane and isooctane ... 41
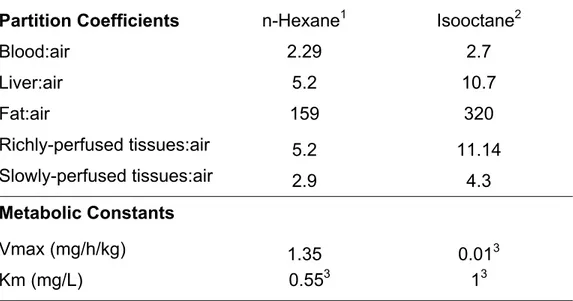
Table 2: Partition coefficients and metabolic constants of n-hexane and
isooctane in rats ... 42
Chapter 3: Article 2:
Table 1: Characterizations of toluene, n-hexane, cyclohexane and
isooctane ... 81
Table 2. Comparison of the area under the blood concentration (AUCs) vs time course mg/l. min obtained from PBPK model and experimental data after exposure to mixture by multiple routes (inhalation and oral) in rats ... 82
Table 3: Normalized sensitivity coefficients for input parameters of the PBPK model for cyclohexane. (Pbc, Plc, Pfc, Prc, Psc, Vmaxc and Kmc refer to blood : air partition coefficient, liver : air partition coefficient, richly-perfused : air partition coefficient and slowly-perfused : air partition coefficient, maximal velocity of metabolism and Michaelis-Menten constant) ... 83
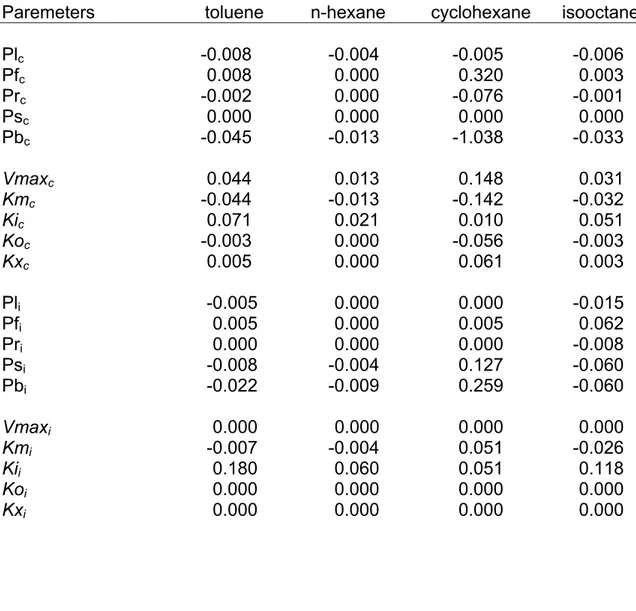
Table 4: Normalized sensitivity coefficients for input parameters of cyclohexane (c) and isooctane (i) in the mixture PBPK model. (Pb, Pl, Pf, Pr, Ps, Vmax, Km,
Ki, Ko, and Kx refer to blood : air partition coefficient, liver : air partition
coefficient, richly-perfused : air partition coefficient, slowly-perfused : air partition coefficient, maximal velocity of metabolism, Michaelis-Menten constant, inhibition constant, absorption rate constant for stomach and stomach to intestine transfer rate) ... 84
Chapter 4: General discussion
Table 3: Comparison of the L-eq of each substance
resulting from multi-routes exposure to mixture between different
concentrations: 100 µg/L and 1 µg/L ... 108
Table 4: Comparison of the L-eq of each substance
resulting from multi-routes exposure of separate substances between different concentrations: 100 µg/L and 1 µg/L ... 109
x
LIST OF FIGURES Chapter 2: Article 1
Figure 1: PBPK model of an aggregate exposure to a single chemical [adipose tissue (FAT); richly-perfused tissues (RPT); poorly-perfused tissues (PPT); arterial blood (ART); venous blood (VEN)] ... 45
Figure 2A: Inhalation exposure: comparison of experimental data (symbols) and PBPK model simulation (black lines) of venous blood concentration (mg/ l) versus time (min) following 2 hr exposure to n-hexane (50 ppm and 200 ppm) in rats ... 46
Figure 2B: Oral gavage exposure: comparison of experimental data (symbols) and PBPK model simulations (black lines) of venous blood concentration (mg/ l) versus time (min) following single oral gavage exposure to n-hexane (22.33 mg/kg) in rats. Groups 1 and 2 differs in the blood sampling times. The blood samples of group one were 0.5,1.0, 1.5, 2.0, 2.5, 3.5 hrs and group 2 were obtained at 0.08, 0.17, 0.25, 0.5 and 1 hr post exposure ... 47
Figure 2C: Multiple routes exposure: comparison of experimental data (filled square) and PBPK model simulations (black lines) of venous blood concentration (mg/ l) versus time (min) of single exposure by oral gavage (22.33 mg/kg) followed by 2 hr inhalation exposure (200 ppm) to n-hexane. The x symbol indicates the sum of the simple inhalation and oral gavage ... 48
Figure 3A: Inhalation exposure: comparison of experimental data (symbols) and PBPK model simulations (black lines) of venous blood concentration (mg/ l) versus time (min) following 2 hr exposure to isooctane (300 ppm, 1200 ppm) in rats ... 49
Figure 3B: Oral gavage exposure: comparison of experimental data (symbols) and PBPK model simulations (black lines) of venous blood concentration (mg/ l) versus time (min) following single oral gavage exposure to isooctane (40 mg/kg, 162 mg/kg) in rats ... 50
Figure 3C Multiple routes of exposure: comparison of experimental data (symbols) and PBPK model simulations (black lines) of venous blood concentration (mg/l) versus time (min) of single exposure by oral gavage (40 mg/kg, 162 mg/kg) followed by 2-hr inhalation exposure (300 ppm, 1200 ppm) to isooctane. The ‘x’ and ‘+’ symbols indicate the sum of the simple inhalation and oral gavage for the low dose and high dose, respectively. ... 51
Chapter 3: Article 2
Figure 1: PBPK model of multi-route exposure to the mixture of four chemicals (tolune (t), n-hexane (h), cyclohexane(c) and isooctane (i)) by inhalation and oral gavage. The toxicokinetic interactions among the four substances occur in the liver. RAM; rate of the metabolism of each substance, arterial blood (Arterial), venous blood (Venous), richly-perfused tissues; RPT, poorly-perfused tissues (PPT), GI tract; gastrointestinal tract………..88
Figure 2A: Comparison of PBPK model simulations (solid lines) with the experimental data (symbols) of inhalation exposure to 300 ppm or 1200 ppm (2 hr) of cyclohexane in rats………...89
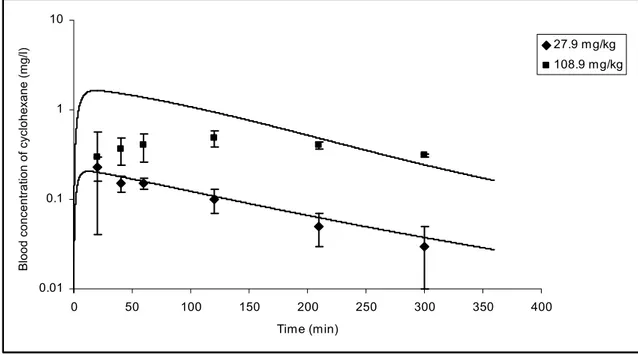
Figure 2B: Comparison of the PBPK model simulations (solid lines) with the experimental data (symbols) of single oral gavage exposure to 27.9 mg/kg or 108.9 mg/kg of cyclohexane in rats ... 90
Figure 2C: Comparison of the PBPK model simulations (solid lines) with the experimental data (symbols) of aggregate exposure to 27.9 mg/kg + 300 ppm or
xii
108.9 mg/kg + 1200 ppm of cyclohexane (single oral dose followed by 2 hr inhalation) ... 91
Figure 3A: PBPK model simulations (solid lines) and experimental data on venous blood concentration in rats exposed to toluene alone (♦) or as a mixture (■) by multiple routes ... 92
Figure 3B: PBPK model simulations (solid lines) and experimental data on venous blood concentration in rats exposed to n-hexane alone (♦) or as a mixture (■) by multiple routes ... 93
Figure 3C: PBPK model simulations (solid lines) and experimental data on venous blood concentration in rats exposed to isooctane alone (♦) or as a mixture (■) by multiple routes... 94
Figure 3D: PBPK model simulations (solid lines) and experimental data on venous blood concentration in rats exposed to cyclohexane alone (♦) or as a mixture (■) by multiple routes... 95
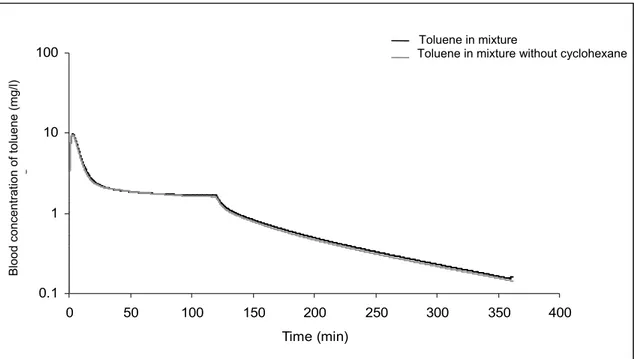
Figure 4A: Comparison of the simulations of PBPK models of toluene in a mixture in presence or absence of cyclohexane. Gray line indicates simulation without cyclohexane ... 96
Figure 4B: Comparison of the simulations of PBPK models of n-hexane in a mixture in presence or absence of cyclohexane. Gray line indicates simulation without cyclohexane ... 97
Figure 5A: Comparison of the simulations of PBPK model of toluene in a mixture in presence or absent of isooctane. Gray line indicates simulation without isooctane ... 98
Figure 5B: Comparison of the simulations of PBPK model of n-hexane in a mixture in presence or absence of isooctane. Gray line indicates simulation without isooctane ... 99
Figure 6: PBPK model simulations of the kinetics of cyclohexane and comparison with the experimental data (■) from Hissink et al. (2009) (400 ppm and 2000 ppm) ... 100
Figure 7A: PBPK model simulations of the inhalation kinetics of cyclohexane in rats exposed to 300 ppm or 1200 ppm. To obtain these simulations, blood: air partition coefficient (Pb) was set to 7 instead of 1.3 based on the sensitivity of analysis. ... 101
Figure 7B: PBPK model simulations of the oral kinetics of cyclohexane. In rats administrated 27.9 mg/kg (gray), 108.9 mg/kg (black). To obtain these simulations, blood: air partition coefficient (Pb) was set to 7 instead of 1.3 based on the sensitivity of analysis. ... 102
Figure 7C: PBPK model simulations of multi-route exposure to cyclohexane. Blood: air partition coefficient (Pb) was set to 7 instead of 1.3 based on the result of sensitivity analysis (High dose (1200 ppm + 108.9 mg/kg); low dose (300 ppm + 27.9 mg/kg)) ... 103
Figure 7D: impact of blood : air partition coefficient (Pb) on the PBPK model simulations of cyclohexane kinetics during multi-route exposure (300 ppm + 27.9 mg/kg) ... 104
xiv
ABBREVATIONS
Aab Amount of solvent being absorbed during the oral exposure ADI Acceptable daily dose
AUC Area-under the concentration vs time curve Ca Arterial blood concentration
Calv Alveolar air concentration CHL Chloroform
Cinh Inhaled air concentration CNS Central nervous system Cv Venous blood concentration
dA/dt Rate of change in the amount of chemical DCP 1,1-dichloropropanone
Fabs Absorbed fraction
Faw Transfer coefficient air: water IR Daily water intake rate
Kab The constant of competitive metabolism inhibition of chemical b by chemical a
Kaw Partition coefficient air: water Km Michaelis-Menten constant Ko Absorption rate in stomach
Kow n-octanol: water partition coefficient Kp Dermal Permeability constant
Leq Litre-equivalent MC Methyl chloroform MW Molecular weight
n number of samples/ subjects NOAEL No observed adverse effect level
PBPK Physiological based pharmacokinetic model Pf Fat: blood partition coefficient
Pk Skin: blood partition coefficient Pl Liver: blood partition coefficient PNS Peripheral nervous system ppm Part per million
Psw Skin: water partition coefficient Qalv Alveolar ventilation rate
Qc Cardiac output
Qf Blood flow to fatty tissues Qi Blood flow to tissue
Qinh Absorbed dose by inhalation Ql Blood flow to liver
Qp Alveolar ventilation rate
Qr Blood flow to richly-perfused tissues Qs Blood flow to slowly-perfused tissues RAM Rate of the amount metabolized RON research octane number
xvi
RfD Reference dose
Rr Richly-perfused tissue: blood partition coefficient Rs Slowly-perfused tissue: blood partition coefficient SAF Source allocation facteur
T Temperature t Time interval TCE Trichloroethylene
TCP 1,1,1-Trichloropropanone TDI Tolerable Daily Intake TLV® Threshold limit value® TMP 2,2,4-Trimethypentane
U.S. EPA United States environmental protection agency Vmax Maximum velocity of metabolism
VOC Volatile organic compound Vf Volume of fatty tissues Vl Volume of liver
Vr Volume of richly-perfused tissues Vs Volume of slowly-perfused tissues
Acknowledgments
I am heartily thankful to my supervisor Dr Kannan Krishnan for giving me this great opportunity. With his encouragements, supervision and support from the preliminary to the concluding levels, I was able to develop a deep understanding of the subject.
I would like to thank Mrs Ginette Charet-Tardif and Michelle Gagné for conducting the experiments.
I would also like to thank my colleagues, Thomas Peyret and Dr Mathieu Valcke for their scientific advice, also Mrs Danielle Vinet for her administrative support. I have certainly spent two wonderful years at the DSEST thanks to all the wonderful people who work there. I would like to offer my regards to all of those who supported me during my study, especially, Naima, Elmira, Katia and
Micheline; thanks a lot.
It is also a pleasure to thank those who helped me outside the academic area. My mother, who was always present when I needed her the most. My brother in law, Ali, whose patience and teaching skills made it easy for me to go back to school, years after my graduation. Last but not least, my husband, Arnaud and my son, Romain. I definitely could not have done this without sacrificing the time I could have spent with you two. Thank you both for supporting me during this time and never complaining.
‘All people, whatever their stage of development and their social and economic conditions, have the right to have access to an adequate supply of safe drinking water’
3
Canada is the home of one of the biggest natural resources on earth, namely water. About seven per cent of the world’s fresh water is in Canada. The St Lawrence River and the Great Lakes in the east, the Mackenzie River in the north-west are important to the Canadian economy and supply drinking water for millions of people. However, these resources are susceptible to contamination by different sources such as human activities, animal waste, industrial activities (i.e., pesticides and fuel leakage). Therefore, the cleaning up of contaminated rivers (e.g., the St. Lawrence) and lakes (e.g., the Great Lakes) and protecting people by developing guidelines for drinking water quality (i.e., pollution prevention, managing toxic chemicals) should continue to be priorities in Canada (Environment Canada).
1.1. Development of guideline values for drinking water
To date, guideline values for drinking water are developed considering only oral route exposure by Health Canada and the United States Environmental Protection Agency (U.S. EPA) (Krishnan and Carrier, 2008). In this regard, the guideline value for a substance in water is calculated as the ratio between the maximal allowable amount consumed (i.e., Tolerable Daily Intake by Health Canada (TDI; mg/kg/day) or Reference Dose by U.S. EPA (RfD; mg/kg/day) x Body Weight (BW; kg) x Source Allocation Factor (SAF; 0.2 for each source of contamination: water, air, soil, food and consumer product)) and the daily water intake rate (1.5 L/day used by Health Canada; 2 L/day used by U.S. EPA):
(TDI or RfD) x BW x SAF Guideline value =
water intake rate [1]
However, studies as early as 1984 have shown the importance of dermal and inhalation routes, especially in the case of water contamination by volatile organic compounds (VOCs) (Brown et al., 1984; Andelman, 1985; McKone, 1987; Weisel et al., 1996; Kim et al., 2001). Among different chemical
contaminants, VOCs have interested regulators because of their potential for multiple routes of exposure due to their ubiquitous distributions in the various environmental compartments (Pohl and Scinicariello, 2011). Large numbers of VOCs are used as additives in fuel in order to increase its burning capacity (Lee et al., 2002; Lin et al., 2005). Their particular physiochemical characters are low water solubility, high vapor pressure and low molecular weight (Liu and Zhou, 2011). These specific characteristics of VOCs give them a marked capacity to transfer from fuel to air and to contaminate surface and underground water sources (U.S. EPA, 1990). As a result, the general population can be exposed to these chemicals in water supplies not only via the oral route but also through the dermal route by bathing, showering and by inhalation of indoor air (Mckone, 1999). Because of its large absorptive surface area (50- 100 m2) (Deshpande, 2005), the lungs are important routes for absorption of VOCs in ambient air. Brown et al. (1984) indicated that VOC absorption via skin can occur as a result of direct contact with water, such as showering, bathing or swimming. In addition, several studies demonstrated the contribution of inhalation and dermal routes to total internal dose of VOCs in water. For example, in 1996, Weisel and Jo designed a well-controlled exposure scenario (i.e., via oral, inhalation and dermal routes) to chloroform (CHL) and trichloroethene (TCE), in humans to evaluate the contribution of each exposure route to the internal dose of VOCs. Eleven subjects participated in a total of 25 experiments which included a 10-minute shower (dermal contact: CHL, 10-41 µg/l; TCE, 16-150 µg/), a 60-minute bath (dermal contact; T= 40ºC) and a 10-minute inhalation exposure (CHL, 10-50 µg/l; TCE, 28-41 µg/l) during shower. The subjects were also exposed by the oral route by drinking 0.5 liter of tap water (CHL, 20 µg/l; TCE, 20-40 µg/l). The CHE and TCE were present in the exhaled breath following inhalation exposure (0.25-0.05 µg/l CHL and 1.0-0.1 µg/ TCE, 30-180 minute following exposure) and dermal exposure (0.33-0.00 µg/l CHL and 0.9-0.01 µg/l TCE, 30-180 minutes following exposure). However, results of breath samples taken minutes after ingestion of tap water, showed no trace of CHL. This indicates that CHL is totally metabolized through the first pass in the liver. On the other hand, TCE was found
5
seconds to minutes after ingestion of water, in the exhaled breath. The authors indicate that this is an outcome of the low water/air partition coefficient, which results into rapid transfer of TCE from water to air in the oral cavity. Based on their observations, after oral ingestion, the absence of continued elevation of the VOC in the exhaled air shows that blood:air exchange in the alveolar sac has no importance. They concluded that the rate of metabolism of VOCs and therefore their potential toxicity is dependent on the exposure route.
Another study by Xu and Weisel (2005) on human subjects, also demonstrated that the dermal route has an important effect on the absorption of VOCs such as CHL, 1,1-dichloropropanone (DCP) and 1,1,1-trichloropropanone (TCP) used to disinfect tap water. In a well-controlled dermal exposure environment, subjects (n=6) took baths in water (T: 38±1 ºC) with 40 µg/l of CHL (well below the concentration found in tap water) and 25 µg/l of DCP and TCP (higher than concentrations that can be found in a poorly controlled water system) for 30 minutes. Results show that maximum breath concentration of CHL during dermal exposure varied between 20 to 90 percent (16-34 µg/l) of the initial concentration among subjects. At the same time, maximum breath concentration of detected DCP was as little as two percent (0.1-0.9 µg/l) whereas for TCP, it was less than one percent of the initial dose (0.07-0.25 µg/l).
These studies suggested that traditional approaches to evaluate guidelines for drinking water are inadequate to account for multiple routes of exposure. Consequently, guideline value derivation for drinking water contaminants (DWC) has been improved as follows (Krishnan and Carrier, 2008):
Guideline value = (TDI or RfD) x BW x SAF
intake rate + L-eq [2]
In the above equation, L-eq (liter equivalent) corresponds to the number of liters of the dermal and inhalation exposure equivalent to oral exposure. In other
words, L-eq is the fraction of the daily dose received by inhalation or dermal route relative to the dose absorbed by the oral route. The L-eq values are obtained on the basis of dose received via either inhalation or dermal route as follows:
dose absorbed via inhalation route (mg) x IR (L) L-eq inhalation (L) =
dose absorbed via oral route (mg) [3]
dose absorbed via dermal route (mg) x IR (L) L-eq dermal (L) =
dose absorbed via oral route (mg) [4]
IR: daily intake rate
Therefore the total L-eq is:
L-eq total (L) = L-eq inhalation (L) + L-eq dermal (L) + IR (L) [5]
The L-eq can be calculated if the absorbed dose for the various routes can be estimated using human biomarkers or pharmacokinetic data (i.e., blood concentration, expired alveolar breath) after dermal or inhalation exposure in a controlled environment. However, conducting the necessary human experiments in order to compute the L-eq for all VOCs is not feasible (Krishnan and Carrier, 2008). In this regard, the use of mathematical models would be practical. The capacity of physiologically based pharmacokinetic (PBPK) models to predict absorption, distribution, metabolism and excretion of VOCs has already been proven (Ali and Tardif, 1999). Also, these models are increasingly used in regulatory risk assessment processes for VOCs in drinking water. For example, as early as 1988, Bogen and Hall developed the PBPK model to predict the safe concentration of methyl chloroform (MC) in drinking water based on a no observed adverse effect level (NOAEL) from experimental data in rodents. In the same study, they also applied a PBPK model for multiple routes of exposure (i.e., inhalation, ingestion and dermal) to MC in humans. They concluded that the safe
7
concentration of MC in the water based on their modeling and data evaluations would be lower than that calculated based on the traditional method. Haddad et al. (2007) established a PBPK model to analyze the contribution of each route of exposure to the total absorbed dose and total metabolized amounts of five VOCs (CHL, TCE, bromodichloromethane, dibromochloromethane, bromoform). They developed the model to predict human exposure via single route, for individual chemicals in tap water. They assumed that exposure occurs in the bathroom and elsewhere in the house during daily activities such as drinking, bathing and showering. In this study, total amounts absorbed and metabolized were calculated by adding separate amounts for inhalation, dermal and ingestion routes. They concluded that dermal and inhalation (showering) exposures contribute as much as, or even more than, the ingestion of water in terms of total absorbed dose of VOCs. They also indicated that these PBPK models can be useful to establish guidelines for different VOCs in the water, to account for multi-route exposures.
Although previous studies on single chemicals have demonstrated the usefulness of PBPK models, the evaluation of possible interactions during mixed exposure to chemicals via multiple routes has not yet been undertaken. Human exposure to chemical mixtures found in the environment has been well documented (Newill, 1989; Saéz et Rittman, 1993; Eskenazi et al. 1999; FSA, 2002; Wolff et al. 2008). The U.S. EPA, National Institute of Occupational Safety and Health and National Center for Toxicological Research have developed risk assessment methods for mixtures, in the early 1980s (RAMAS, 2003). Since 1996, U.S. EPA has been required by the Food Quality Protection Act, to include the evaluation of mixture risk assessment of chemicals (RAMAS, 2003; Rider et al., 2010). However, as discussed before, all regulatory threshold limits, such as tolerable daily intakes (TDI), are based only on individual chemical risk assessment. Furthermore, there is the question of whether it is safe to be exposed to chemicals in mixture at low levels; although Carpenter et al. (2002) pointed out that there might not necessarily be interactions among all chemicals
in a mixture. Those chemicals that share the same site of action could result in non-additive effects. Despite the importance of exposure to mixtures, until now, risk assessments have largely focused on single and multiple routes of exposure to individual chemicals (Sexton and Hattis, 2007).
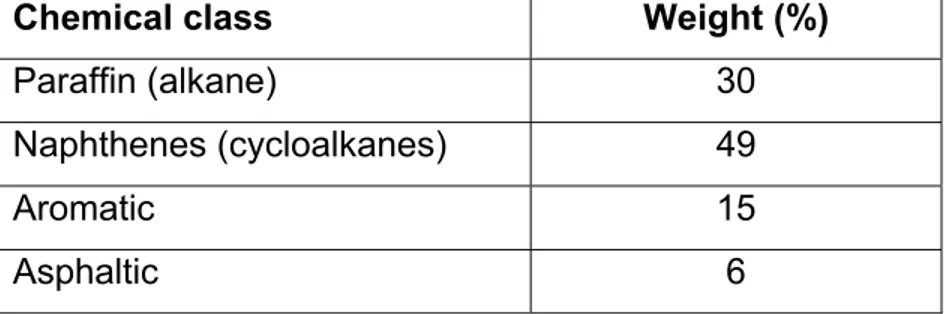
It is particularly important in the case of drinking water contamination to consider both mixture effects and multi-route exposure while establishing guideline values; however, this has not yet been done. The interactions could occur to different degrees according to the route of exposure. The present study focused on the use of in vivo data and PBPK models to evaluate the impact of multiple routes of exposure on the kinetics of a chemical mixture. For this purpose, VOCs representative of the substances found in large volume petroleum products (e.g., gasoline, kerosene, gas oil) that could potentially contaminate water supplies were selected (toluene, n-hexane, cyclohexane and isooctane). In general, petroleum products contain mostly carbons (84-87%) and hydrogens (11-14%), other elements being present in much lower proportions. Table 1 represents the major classes of chemicals present in petroleum hydrocarbon products (Hyne, 2001).
Table 1: Major classes of chemicals present in petroleum hydrocarbon products.
Chemical class Weight (%)
Paraffin (alkane) 30
Naphthenes (cycloalkanes) 49
Aromatic 15 Asphaltic 6
Substances chosen in this study belong to different families of hydrocarbons found in crude oil, as well as gasoline. For instance, while toluene represents the aromatic hydrocarbon family, n-hexane, cyclohexane and isooctane belong to
9
straight-chain paraffins, naphthenes and branched-chain paraffin, respectively (Chen et al., 1998). The following section presents a brief summary of the toxicokinetics and toxicity characteristics of these VOCs.
1.2. Toxicokinetics and toxicity of toluene, n-hexane, cyclohexane and isooctane
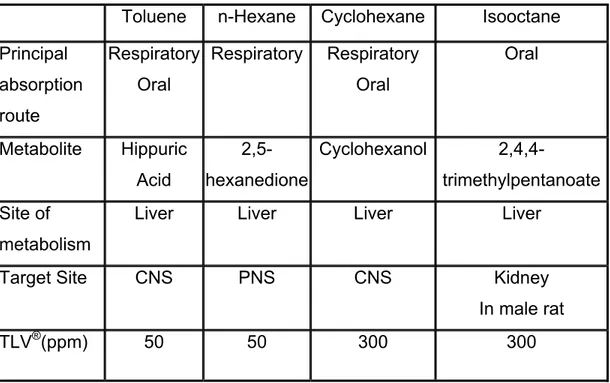
Table 2: Summary of key toxicokinetics and toxicity features of toluene, n-hexane, cyclohexane and isooctane.
Toluene n-Hexane Cyclohexane Isooctane
Principal absorption route Respiratory Oral Respiratory Respiratory Oral Oral Metabolite Hippuric Acid 2,5-hexanedione Cyclohexanol 2,4,4-trimethylpentanoate Site of metabolism
Liver Liver Liver Liver
Target Site CNS PNS CNS Kidney
In male rat
TLV®(ppm) 50 50 300 300
TLV®: threshold limit value®; CNS: central nervous system; PNS: peripheral nervous system
1.2.1. Toluene (C6H5CH3)
1.2.1.1. Toxicokinetics
Toluene is a colorless liquid, volatile, miscible and almost insoluble in water (U.S. EPA, 2005). Its ability to prevent engine knocking and its high research octane number (RON=111) makes it a good fuel additive in order to achieve a better performance of the engine (Sarmaneav et al. 1980).
The extent of absorption following oral dosing (provided through feeding tubes) of volunteers at a rate of 2 mg/min of toluene for a period of 3 hours was almost 100% (Baelom et al., 1993). However, absorption rate has been reported lower for inhalation exposure. In fact, it has been shown that the retention is higher after a single lower dose exposure (83% - 189 mg/m3) compared to a single higher dose exposure (50% - 300 mg/m3) (Benoit et al., 1985; Carlsson et al., 1982). In rats, researchers suggest that absorption of toluene happens, in average, faster after inhalation exposure (1-2 hours) than oral exposure (1.3- 6.3 hours) (Gospe and Al-Bayati, 1994). Overall, absorption from the gastrointestinal route is as important as the respiratory system when exposure lasts for about an hour. On the other hand, during short exposures, 85-90% of toluene is absorbed via the respiratory tract (Faust, 1994).
To find out the skin capacity to absorb toluene, volunteers were exposed to liquid toluene and toluene from aqueous solution (Dutkiewicz and Tyras, 1967). The authors showed that, for a mean concentration of 180-600 mg/l, the absorption rate of liquid toluene was 14-23 mg/cm2/h compared to 0.16-0.6 mg/cm2/h for the aqueous solution. They concluded that in both cases absorption rate increases with increases in toluene concentration. Although Gospe and Bayati (1994) mentioned that skin should be considered as an important exposure route, the U.S. EPA (1990) reported that skin absorption accounts for only 1% of the
11
inhalation route. Therefore, it was concluded that because of the strong volatile character of toluene, skin is not an important absorption route (U.S. EPA, 1990). Liver is the main organ of toluene metabolism (U.S. EPA, 1990). Toluene is metabolized by the family of cytochromes P450, principally by CYP2E1 and CYP2B1/B2 in liver, mostly into hippuric acid (HA) (Nakajima et al., 1991). It is eliminated principally through the urinary system (80%) as HA and as unchanged substance through exhalation (20%) (Nakajima et al.,1997).
1.2.1.2. Toxicity
In a two-year inhalation study, female and male F344/N rats were exposed to 600 to 1200 ppm of toluene. No evidence of carcinogenic activity in either male or female was observed (NTP, 1990). The U.S. EPA and International Agency for Research on Cancer (IARC) have classified it, according to their ranking system, in group D and 3, respectively. The threshold limit value (TLV)® for toluene was established at 50 ppm.
The most important effect of inhalation exposure to toluene is on the central nervous system and the brain in both humans and animals (Filley et al., 2004). Chronic exposure in workers at 30 to 150 ppm could result in hearing loss, color vision impairment and lower performance in neurobehavioral tests (ATSDR, 2000). Furthermore, effects on the reproductive system and development in children whose mothers were exposed to high concentrations of toluene during pregnancy have been reported (Bowen et al., 2006). Other effects have been reported on the respiratory, cardiovascular, hematological, hepatic and renal systems (ATSDR, 2000).
1.2.2. n-Hexane (C6H14)
1.2.2.1. Toxicokinetics
n-Hexane is highly volatile, colorless and slightly soluble in water. However, unlike toluene it is not an additive but a natural component of fuel (WHO, 1991). The respiratory tract is the main absorption route of n-hexane, but it can also be absorbed by the gastrointestinal tract and the skin (Bonnard et al., 2008). On the other hand, absorption of n-hexane via the skin is not significant (Stellman, 1998).
n-Hexane is metabolized in the liver by CYP2B1 into 2,5-hexanedione (HD) (Fabioano et al., 2010). It is eliminated either by the respiratory or urinary system (U.S. EPA, 2005). Up to 10% of unchanged n-hexane is eliminated by exhalation with an estimated half-life of 100 minutes. However, it is mostly eliminated in urine as 2-hexanol (60-70%), a urinary metabolite with a half-life of about 12hrs (ATSDR, 1999).
1.2.2.2. Toxicity
n-Hexane affects mostly the peripheral nervous system (Ali and Tardif, 1999). Based on their observation, workers who have been exposed for long periods of time complained about numbness in their arms and feet followed by paralysis. However, they recovered six months to one year after being removed from the contaminated environment. There is no evidence for human or animal carcinogenicity of n-hexane. It has not been classified as a carcinogen by U.S. EPA (group D). TLV® for n-hexane is 50 ppm.
13
1.2.3. 2,2,4-Trimethylpentane (Isooctane, C8H18)
1.2.3.1. Toxicokinetics
Isooctane is a colorless liquid, insoluble in water and soluble in toluene and benzene. Its chemical conformation increases the capacity of fuel to burn and reduces the knocking problem of engines (U.S. EPA, 2006). Therefore, by definition isooctane is given the RON of 100. Conversely, with a RON of zero, heptane has the poorest fuel burning capacity, and comparison between these two substances determines the octane number of other hydrocarbons in fuel.
Studies show a high rate of oral absorption (almost 95% of the oral dose) and a lower absorption rate after respiratory exposure (7-12% of the administrated dose) in rats (Kloss et al., 1986). Isooctane is metabolized by P450 mainly into pentanoic acids and 2,4,4-trimethy-2-penthanol (Olson et al., 1985; El-masri et al., 2009). The majority of metabolites are eliminated in urine (67% for males, 50% for females). However, it has been reported that 90% of the absorbed dose after inhalation exposure is eliminated from the respiratory system after about 70hr. It will be as much as 43% in males and 49% in females from exhalation (Kloss et al. 1986).
1.2.3.2. Toxicity
Studies have shown that isooctane induces proximal tubular tumor in male rats (Swann et al., 1974). This happens after its metabolite, 2,4,4-trimethy-2-penthanol, binds to α2u-globulin protein which results in a complex that leads to
the development of tumor in this part of kidney. The protein α2u-globulin is
specific to male rats (Charbonneau et al. 1987; El-masri et al., 2009) and therefore isooctane nephrotoxicity/carcinogenicity is not considered to be relevant for humans by the U.S. EPA and other scientific/regulatory agencies.
1.2.4. Cyclohexane (C6H12)
1.2.4.1. Toxicokinetics
Cyclohexane is a colorless liquid, slightly soluble in water. It is part of natural chemical substances found in crude oils and also a part of gasoline (U.S. EPA, 2003).
Espinosa-Aguirre et al., (1997) reported that cyclohexane is metabolized into cyclohexanol and to a lesser extent into cyclohexanone by CYP2B4 in the liver. They observed that cyclohexanol induces CYP2E1 and CYP2B1/B2 isozymes that are involved in the metabolism of toluene and n-hexane. Therefore, it is possible to speculate that the effects resulting from exposure to toluene and n-hexane separately can be different if exposure is to a mixture of cyclon-hexane, toluene, and n-hexane. Elimination of cyclohexane and its metabolites happens primarily via exhalation. Only 20% of elimination occurs via the urinary system (U.S. EPA, 2003).
1.2.4.2. Toxicity
No adequate human epidemiological studies are available on cyclohexane. Most animal studies suggest effects on the central nervous system. However, liver hypertrophy and differentiation in liver enzyme profile have also been mentioned (U.S. EPA, 2003).
1.3. Previous studies on multi-route exposures and interactions among toluene, n-hexane, cyclohexane and isooctane
Until now, there has been no study on interactions between these four chosen chemicals. There have been, however, two studies on binary exposure to toluene and n-hexane. The first study showed that exposure to the mixture of 1000 ppm
15
toluene and 1000 ppm n-hexane via the respiratory system, resulted in a reduction of the neurotoxic effects of hexane, compared to exposure to n-hexane alone (Takeuchi et al., 1981). The authors suggested that toluene reduces the oxidation rate of n-hexane to 2,5-hexanedione (HD). In the second study, Ali and Tardif (1999) also found a significant reduction of urinary HD (75%) after respiratory exposure to the mixture of 300 ppm toluene and 100 ppm hexane. However, these authors reported that amounts of hippuric acid (HA) (ie., toluene metabolite) did not decrease significantly (only by up to 25%).
There is no research about mixture exposure including cyclohexane or isooctane. However, one study reported that cyclohexanol (i.e., metabolite product of cyclohexane) induces CYP2E1 and CYP2B1/B2, indicating a potential for interaction with other chemicals (Espinosa-Aguirre et al., 1997). As these cytochromes are involved in the metabolism of toluene and n-hexane, hypothetically, simultaneous exposure to toluene, n-hexane and cyclohexane, can lead to metabolic interactions between them. However, neither experimental data nor predictive PBPK models are available to evaluate the relevance of occurrence of interactions among these substances for risk assessment considerations.
1.4. Objective and originality of this study
The general objective of this project is to evaluate the importance of both mixture and multi-route exposures in perspective of establishing better guidelines for chemicals in drinking water.
First, this study focused on developing PBPK models and comparing them to experimental data to determine the kinetics of individual chemicals by a single route (i.e., inhalation and ingestion) and multiple routes of exposure (Article 1). Then, the PBPK models were applied to simulate the kinetics of hydrocarbons (toluene, n-hexane, cyclohexane and isooctane) following mixed exposure via
multiple routes, in an effort to compare the outcome with those of individual chemical exposures via single or multiple routes (Article 2).
Manuscript prepared for submission to: “Journal of Applied Toxicology” PBPK modeling of the aggregate exposure of rats to n-hexane or isooctane
by inhalation and oral gavage
Nazanin Kaveh, Michelle Gagne, Ginette Charest-Tardif, Robert Tardifand Kannan Krishnan
19
Short abstract
Physiologically based pharmacokinetic (PBPK) models, as well as in vivo experiments were used in order to characterize the impact of simultaneous exposure by inhalation and oral gavage (aggregate exposure) on the total internal dose of n-hexane or isooctane in rats. The PBPK models developed in this study are useful tools for simulating kinetics of hydrocarbons, by accounting not only for the saturable metabolism but also the possible kinetic behavior during aggregate exposures.
Abstract
The objective of this study was to compare the results of the aggregate exposure (inhalation and gavage) to n-hexane or isooctane to the simple exposure (inhalation) on the total internal dose of the substances. Physiologically based pharmacokinetic (PBPK) models, as well as in vivo experiments were used in order to simulate the kinetics of each chemical for simple and aggregate exposure. First, experimental data were collected from simple exposure of male Sprague-Dawley rats (n=5) exposed to n-hexane or isooctane (2,2,4-Trimethylpentane; TMP) by inhalation (50 ppm or 200 ppm n-hexane, 300 or 1200 ppm isooctane) or oral gavage (5.5 or 22.3 mg/kg n-hexane, 40 or 162 mg/kg isooctane). Next, other groups of rats were exposed to each substance simultaneously by inhalation and oral gavage. Blood concentration was measured between 2-6 hours after inhalation and aggregate exposure, and 0.5-3 hours after oral gavage. The PBPK model could fit the experimental data of different exposure scenarios and also was validated by the data-derived area under the blood concentration vs time curve mg/l. min. PBPK models as well as experimental data suggest that the internal dose resulting from aggregate exposure to n-hexane is not additive of the sum of the internal doses resulting from individual exposure routes. However, results from multi-route exposure to isooctane show that it is additive of the sum of the results from simple exposure routes. The PBPK models developed in this study are useful tool for simulating the kinetics of hydrocarbons, by accounting not only for the saturable metabolism but also for the possible kinetic behavior during aggregate exposures.
21
Introduction
Contamination of ground water with petroleum products (i.e., gasoline) has widely preoccupied the regulatory agencies such as the U.S. EPA (Andelman, 1985). The main reason for this attention is the extended use of petroleum products and therefore the greater possibility of underground water contamination due to the leakage of fuel from containers of gas stations (U.S. EPA, 1990). In this study, n-hexane and isooctane (2, 2, 4-Trimethylpentane; TMP) are chosen to represent two different chemical classes in petroleum products (i.e., gasoline). n-Hexane and isooctane exemplify classes of alkanes and branched chain paraffins, respectively (Chen et al., 1998). n-Hexane is present in as much as 11% of crude gasoline (U.S. EPA, 2005). The neurotoxic effects of n-hexane have been reported in both animals and humans (Takeuchi et al., 1981; Filser et al., 1987; Hamelin et al., 2005). Isooctane is an additive to unleaded gasoline and is used to increase the octane number of fuel and the performance of the engine (Lock et al., 1993, El-Masri et al., 2009). The neurotoxic effects of isooctane have been reported in experimental animals (Swann et al., 1974; El-Masri et al., 2009). However, it is mostly known for its nephrotoxicity in male rats, which is not relevant to humans (Fowlie et al., 1987; Lock et al., 1993). Liver damage due to exposure to isooctane in rats has also been reported (Fowlie et al., 1987).
Both n-hexane and isooctane are volatile organic compounds (VOCs). VOCs possess low water solubility, high vapor pressure and low molecular weight (Liu and Zhou, 2011). These characteristics give them the capacity and mobility to contaminate different layers of soil and therefore underground water (U.S. EPA, 1990). As a result, consumers at home can be exposed to these chemicals from drinking water during bathing and showering or simply by inhaling the indoor air (Mckone, 1999). For years, regulatory agencies had considered the oral route to be the main exposure route to contaminated drinking water (McKone, 1999; reviewed in Krishnan and Carrier, 2008). Later, studies were able to show that
because of the efficient transfer from water to air, the inhalation route is an important exposure route for VOCs (Andelman, 1985; McKone, 1987, 1999). Several studies have shown that dermal exposure also contributes to the total absorbed dose depending upon the dose and physiochemical characteristic of the substance and duration of skin contact (Brown et al., 1984; McKone, 1999; Xu et al., 2002; Krishnan and Carrier, 2008).
Today, the significance of multiple routes of exposure (inhalation, gastrointestinal and dermal) to VOCs is widely recognized. However, conducting experimental studies with multiple chemicals for different scenarios of exposure, doses, and routes seems practically impossible (Haddad et al., 2001). PBPK modeling is a proven tool that makes it possible to evaluate the different pharmacokinetic phases such as absorption, distribution, metabolism and excretion in animals as well as humans regardless of the exposure scenario (Haddad et al., 2001; Dennison et al., 2004).
The objective of this study was to develop PBPK models to simulate the pharmacokinetics of n-hexane and isooctane after multi-route exposures. This approach would help better understand the effects of aggregate exposure on the internal dose of these chemicals in rats and the capacity of PBPK models to simulate multi-route exposure scenarios.
Materials and Methods 1) In vivo study
Chemical
n-Hexane (99%) and isooctane (anhydrous 99.8%) were obtained from Aldrich chemicals (Milwaukee, WI).
23
Animals
Adult male Sprague-Dawley rats (240-260 g) were obtained from Charles-River Canada (St-Constant, Québec). They were housed in temperature-controlled cages in groups of two or three per cage with a 12-h light–dark cycle. A minimum one week acclimatization period was provided. They were given food and water
ad libitum until the day of experiment. On the day of experiment they were placed
in individual cages and fasted during the experiment.
Exposure scheme Inhalation exposure
Groups of male Sprague-Dawley rats (n=5) were separately exposed to low and high concentrations of each substance by inhalation (50 ppm and 200 ppm of n-hexane; 300 ppm and 1200 ppm of isooctane; 2-hr) in a closed-atmosphere exposure system (Haddad et al., 2000). The concentrations were monitored using automatic injection of 0.25 ml air samples into a gas chromatograph (HP 5890) equipped with a flame ionization detector (FID). Helium was used as a carrier gas, at the rate of 5.4 ml/min.
Oral exposure
Groups of rats (n=5) were given a single low dose or high dose of the substances. Accordingly, 5.5 mg/kg or 22.3 mg/kg of n-hexane, and 40 mg/kg and 162 mg/kg of isooctane were diluted in Alkamuls® (10%). Ten ml of solution was administered per kg body weight.
Dermal route
In this study, the dermal exposure was omitted as a relevant absorption route because at the exposure levels chosen on the basis of the threshold limit values of n-hexane (50 ppm) and isooctane (300 ppm), the dermal route did not appear to contribute significantly to the systemic dose (Bonnard et al., 2008; U.S. EPA 2007; Faust, 1994). Moreover, the preliminary experiments in rats determined that neither n-hexane (1.39 mg/ml) nor isooctane (10.18 mg/ml) is absorbed significantly by the dermal route (results not shown).
Multi-route exposure
A group of rats (n=5) was given a single oral dose of 22.33 mg/kg of n-hexane and then placed within a closed-chamber system for inhalation exposure to 200 ppm during 2 hr. In the case of isooctane, two groups of rats (n=5) were orally administered with either 40 mg/kg or 162 mg/kg and then exposed to an atmosphere of 300 ppm or 1200 ppm for 2 hr.
Analysis of the blood concentration
Blood samples (25-200 µl) were collected by performing a small incision on the tail veins of rats. The concentration of unchanged substances in blood was quantified using a head-space gas chromatography method (Tardif et al., 1993). After single oral exposure, blood samples were taken from animals 0.5, 1, 1.5, 2, 2.5 and 3 hr post-exposure. For the inhalation and multi-route exposure, however, blood samples were taken 2, 2.5, 3, 3.5, 4 and 5 hr post- exposure.
25
2) PBPK Modeling Model representation
The four-compartmental PBPK models were developed similar to Haddad et al. (2000) separately for n-hexane and isooctane. The compartments of the PBPK model were: liver (as the metabolizing tissue), fat, richly-perfused tissues and slowly-perfused tissues, all connected by systemic blood circulation and gas exchange in the lung (Figure 1). In order to simulate oral and multi-route exposures, the gastrointestinal tract was included (Haddad et al., 2000). Accordingly, the stomach was described as additional portal of entry. The absorption rate from the stomach and constituted the systemic input of the orally-administered chemicals investigated in this study. The transfer of unabsorbed chemical from the stomach to the intestine has also included, and it was found to be essential to obtain reasonable model fit experimental data on oral kinetics.
Model parameterization
The physiological parameters of the rat as well as physiochemical parameters (i.e., partition coefficients and metabolic constants) for n-hexane were taken from Ali and Tardif (1999) whereas that of isooctane was obtained from El-Masri et al. (2009) (Table 1-2). The rate of metabolism (Amet/dt) in this model was described as a saturable process using Vmax (maximal velocity) of 1.35 mg/kg/h and Km (Michaelis-Menten affinity constant) of 0.4 mg/l for n-hexane as obtained from Ali and Tardif (1999). The values of Kx (absorption rate constant for stomach) and
Ko (stomach to intestine transfer constant) were obtained by fitting the PBPK model simulations to kinetic data for the oral route, and this yielded estimates of 0.2 min-1 and 0.007 min-1, respectively.
For isooctane, the Vmax of 0.3 mg/h and Km: 1 mg/l were fitted to the inhalation PBPK model. Kx: 0.001 min¯¹ and Ko: 0.003 min¯¹ were obtained by fitting PBPK model simulation to the oral gavage data.
The metabolism was considered to take place exclusively in the liver. The rate of the change in the amount of chemical (dAt/dt) for this compartment accounted for the metabolism rate as follow (Haddad et al., 2000):
max ( - ) -dAt Cvl x V Ql Ca Cvl dt = Cvl+ Km [1] where:
Ql: rate of blood flow through the liver
Ca: concentration of solvent in the arterial blood, and Cvl: concentration of solvent in the blood leaving the liver
And for oral and multiple exposure routes (Haddad et al., 2000)
max ( - )- ( ab) dAt Cvl x V Ql Ca Cvl A dt = Cvl Km+ + [2] where:
Aab: rate of chemical being absorbed during the oral exposure (mg/h). It was calculated as:
Aab= Kx × Qt [3]
where:
Kx: absorption rate constant of a chemical by the stomach (min-1)
Qt: remaining quantity of chemical in the stomach (mg)
27
Qt = Q – (Aab × ta) – (Ko × ta × Aab) [4]
where
Ko: stomach to intestine transfer constant (min¯¹) ta: interval of time (min)
Statistical analysis and model evaluation
The statistical analyses were conducted using SPSS for Windows (v15.0.0, Chicago, IL, USA). In order to validate the model, data-derived area under the blood concentration vs. time curves (AUC; mg/L x min) were obtained for every exposure scenario (inhalation, gavage and multi-route) and dose (low and high doses), and compared with those obtained using the PBPK model. The results were used to determine the degree of discrepancy between PBPK modeling and experimental data.
Results
Single route exposure: inhalation or oral gavage n-Hexane
The experimental data and PBPK model simulations after 2-hr inhalation exposure of rats to 50 ppm and 200 ppm n-hexane are presented in Figure 2A. Blood elimination rate (Kel) and half-life of n-hexane based on the experimental data (2-6 hr) were estimated as 1.22 hr-1 and 0.56 hr for the low dose and 0.84 hr-1 and 0.82 hr for the high dose, respectively. After 2-hr exposure to 50 ppm, maximum blood concentration of unchanged n-hexane (Cmax) was 0.09 ± 0.01 mg/l vs. 0.13 mg/l, respectively, as indicated by the experimental data and the PBPK model. In contrast, Cmax after exposure to 200 ppm were 0.45 ± 0.02 mg/l according to experimental data vs. 0.66 mg/l for PBPK model. The data-derived area under the blood concentration (AUC) after exposure to 50 ppm n-hexane by inhalation was 3.29 mg/l.min vs. 4.5 mg/l.min as simulated by the PBPK model (2- 4 hr). The AUCs of high dose exposure as obtained from experimental data and PBPK model were 20.75 mg/l.min vs. 20.25 mg/l.min, respectively.
Figure 2B compares the experimental data with PBPK model simulations after a single oral dose exposure to n-hexane. The experimental data from single oral exposure to high dose n-hexane could well fit our PBPK model (Figure 2B). The values of Kx (absorption rate constant for stomach) and Ko (stomach to intestine transfer constant) obtained by fitting were 0.2 min-1 and 0.007 min-1, respectively.
The only measurable concentration after exposure to 5.53 mg/kg dose of hexane occurred at 0.5 hr post-exposure (0.016± 0.006 mg/l). After that, n-hexane was not detectable in blood. Following the administration of 22.33 mg/kg, the Cmax observed 10 minutes post-dosing was 0.3 mg/l whereas the AUC based on experimental data was 21.06 mg/l.min The PBPK model-simulated Cmax and AUC for high dose exposure were 0.26 mg/l and 13.01 mg/l.min, respectively.
29
Isooctane
The PBPK model adapted for isooctane has been compared to the experimental data after 2-hr inhalation exposure to low (300 ppm) and high (1200 ppm) concentrations in Figure 3A. Figure 3B shows a significant correlation between the experimental data and the PBPK model from both low dose (40 mg/kg) and high dose (162 mg/kg) gavage exposure. Kx and Ko were fitted at 0.001 min-1 and 0.003 min-1, respectively.
Based on results from experimental data (2-6 hr), the Kel and half-life of isooctane were 0.39 hr-1 and 1.76 hr after exposure to 300 ppm, and 0.30 hr -1 and 1.15 hr after exposure to 1200 ppm of isooctane, respectively. The Cmax from experimental data was 1.25 ± 0.04 mg/l compared to 2.68 mg/l from the PBPK model after 2-hr exposure to 300 ppm. After exposure to 1200 ppm, Cmax from experimental data was 5.06 ± 0.35 mg/l vs. 11.07 mg/l from the PBPK model. The AUC after 2-hr exposure to 300 ppm (2-6 hr) from experimental data
vs PBPK model were 73.36 mg/l.min and 68.48mg/l.min. At 1200 ppm it was
295.58 mg/l.min vs. 287.72 mg/l.min, respectively.
The PBPK model could adequately simulate the kinetics of isooctane after 2 hr exposure of rats to low and high concentrations by inhalation route (Figure 3A). The ability of PBPK model to evaluate a single oral gavage exposure at low (40 mg/kg) and high (162 mg/kg) concentrations is shown in Figure 3B. Kel and half-life were 0.66 hr-1 and 1.04 hr after exposure to low dose, and 0.31 hr-1 and 2.2 hr after exposure to high dose, respectively. Cmax of low dose exposure based on the experimental data was 1.26 mg/l vs 1.13 mg/l from the PBPK model. After exposure to high dose, this amount increased to 1.8 mg/l and 3.6 mg/l for experimental data and PBPK model, respectively. The AUCs of PBPK model and experimental data (0.5-6 hr) were at low dose 148.61 mg/l.min and 135.51 mg/l.min, and at high dose 663.66 mg/l.min and 477.47 mg/l.min, respectively.
Multiple routes of exposure by inhalation and oral gavage n-Hexane
Figure 2C compares PBPK model simulations with experimental data after simultaneous exposure of rats to n-hexane by inhalation and oral gavage. The values of Kx and Ko used in PBPK model of multi-route were the same as those used for simulating single route (oral) exposures (0.007 min-1 and 0.2 min-1). Figure 2C also compares results from multi-route exposure to the sum of data obtained for the two single routes (inhalation and oral gavage) in the initial experiments.
Following multi-route exposures to 22.33 mg/kg (oral gavage) and 200 ppm (inhalation), Kel and half-life based on experimental data were 1.025 hr-1 and 0.67 hr, respectively. Cmax of n-hexane after multi-route exposures compared to the sum of the two single routes were 0.5 mg/l vs. 0.68 mg/l. The AUC from experimental data and PBPK model were 37.59 mg/l.min vs 27.25 mg/l.min. The ratio of AUC between multi-route exposure and the sum of single route exposure was 0.64.
Isooctane
Figure 3C depicts the PBPK model simulations of the blood concentration vs. time course after multi-route exposure to isooctane in rats at low dose (40 mg/kg + 300 ppm) and at high dose (162 mg/kg + 1200 ppm). The same values of Kx and Ko (0.001 min-1 and 0.003 min-1) used for oral exposure of the PBPK model,
were used in the PBPK model of multi-route exposure.
The Kel and half-life of isooctane after multi-route exposure were 0.36 hr-1 and 0.67 hr after low dose vs 0.35 hr-1 and 1.97 hr after high dose exposure. The Cmax of unchanged isooctane in the blood stream were 1.7 mg/l and 7.3 mg/l, respectively after low and high concentrations, after multi-route exposures. The AUCs calculated from PBPK model and experimental data were respectively
31
184.07 mg/l.min vs 148.56 mg/l.min after low dose, and 798.26 mg/l.min vs. 688.07 mg/l.min after high dose exposure. The ratios of the AUC between experimental data from multi-route and the sum of the single exposure (low and high dose) routes were 1.1 and 0.91, respectively.
Discussion
The PBPK model developed in this study was able to predict the kinetics of n-hexane and isooctane in rats following inhalation exposure and oral gavage. The systemic concentration of each chemical as a function of time after inhalation exposure, oral gavage or multiroute exposures was obtained using PBPK models and compared with experimental data. Previous experimental studies on the kinetics of n-hexane have primarily focused on the inhalation exposure in humans or rats (Bus et al., 1979; Veulemans et al., 1982; Perbellini et al., 1985; Gargas et al., 1989; U.S. EPA 2005). Interestingly, the tissue:air partition coefficients reflecting the volume of distribution in humans, were found to be comparable to that of F344 rats (example: 5.0, 5.2 and 104 for human muscle, liver and fat (Perbellini et al., 1985) vs. 2.9, 5.2 and 159 for rat muscle, liver and fat (Gargas et al., 1989)). No study on the kinetics of uptake and distribution of n-hexane after oral administration is yet available (U.S. EPA 2005).
In contrast, the pharmacokinetics of isooctane has been investigated by the oral route. Reviewed in U.S. EPA (2005), the study of Kloss et al. (1986) on the distribution of isooctane in F344 rats after single oral administration demonstrated sex-specific differences in the radioactivity in different organs (i.e., liver, heart, testis, kidney and spleen) 72 hrs after single oral administration of 500 mg/kg of this substance. The majority of isooctane was found in the kidney and its accumulation was 8 to 10-fold greater in male rat kidney than female (1225 nmol equivalent [eq]/g of wet tissue compared to 157 nmol-eq/g wet tissue). Following this study, Charbonneau et al. (1987) demonstrated that in the female rat, the concentration of 14C labeled isooctane in kidney, plasma and liver decreased significantly at 8 hrs after oral administration, whereas it remained fairly constant even after 12 to 24 hrs post-exposure in male rats (U.S. EPA 2005).
33
There are limited efforts on the development of PBPK models for isooctane (El-Masri et al., 2009) and n-hexane (Ali and Tardif, 1999; Yu et al., 1998; Dennison et al., 2004; Hamelin et al., 2005). All these modeling studies have focused only on inhalation exposure. In the present study, for the first time, not only the PBPK model was used to simulate inhalation and oral exposures separately but also the model was applied to simulate combined exposure via inhalation and oral routes.
n-Hexane
After 2-hr exposure to a lower concentration of 50 ppm or 0.18 mg/l of n-hexane in the rat, the maximum blood concentration decreased by 50% to 0.09 ± 0.01 mg/l in blood vs. 0.13 mg/l simulated by the PBPK model. However, at the high concentration of 200 ppm or 0.72 mg/l, it decreased by about 40% in 2 hrs and the resulting blood concentration was 0.45 ± 0.02 mg/l vs. 0.66 mg/l as simulated by the PBPK model. Comparable blood concentration (0.45 ± 0.1 mg/l) has been reported by Bus et al. (1979) after 6-hr exposure to 1000 ppm (3.5 mg/l) n-hexane in pregnant rats. Furthermore, Filser et al. (1987) with mathematical analyses showed that, for inhaled concentrations below 300 ppm, the metabolism of n-hexane is directly proportional to its atmospheric concentration, whereas at higher concentrations (i.e., >300 ppm), metabolism is non-linear and saturated.
No previous experimental study or PBPK modeling has focused on the oral absorption kinetics of n-hexane. However, neurotoxic effects of n-hexane following oral dosing of rats have been reported (U.S. EPA, 2005). In the study of Ono et al. (1981), n-hexane was not detectable after a single oral dose (5.53 mg/kg). Bonnard et al. (2008) corroborated these findings on the basis of the marked pulmonary clearance of n-hexane. Similarly, in the present study, no data could be obtained from oral exposure at lower concentration (5.53 mg/kg), because the concentrations were below the limit of quantification. Therefore
multi-route exposure to n-hexane was only performed at higher dose (200 ppm + 22.33 mg/kg) by inhalation and oral routes. The dermal route was ignored in these experiments after the preliminary experiments showed that at the doses used in this study, the dermal route did not significantly contribute to the total internal dose (Gagné, 2008). The PBPK model of multi-route exposures used in this study could fit the results from in vivo experiments (Figure 2C). Same values of Ko: 0.003 and Kx: 0.007 from oral exposure study, were used for simulating multi-route exposures. Results from both single and multi-route exposures were used to determine if simultaneous exposure to n-hexane by inhalation and oral gavage could have an additive effect. A perfect additive effect between single and multi-route exposures was not observed, except during the first 30 min of post-exposure (Figure 2C).
Isooctane
This is the first study of PBPK modeling of isooctane following oral dosing and multi-route exposure. Previous experimental studies in rat reported neurotoxicity following inhalation exposure (Swann et al., 1974; U.S. EPA 2006), or development of a PBPK model of inhalation exposure to isooctane (El-Masri et al., 2009). El-Masri et al. (2009) reported biphasic diminution of isooctane with the rapid phase indicative of absorption, distribution and metabolism of the substance, and the slower phase corresponding to the elimination part. The pharmacokinetic data collected and modeled in the present study reflect the same pattern. Right after 2-hr exposure to 300 ppm (1.42 mg/l), the blood concentration of isooctane was 1.25 mg/l. However, 30 minutes later, it dropped by almost 64% to 0.45 mg/l. The blood concentration at 180, 210, 270 and 360 minutes dropped at a much lower rate in rats, post-exposure, in both the low and high dose groups. Overall, the PBPK model used in this study could simulate well the inhalation kinetics of isooctane in rats (Figure 3A).
35
Based on the experimental data for inhalation routes, the derived Kel values are comparable for both exposure concentrations (i.e., 0.36 vs. 0.35 hr-1 for 300 ppm
or 1200 ppm), indicating that there is no metabolic saturation. Similarly, the Kel associated with the high oral dose (162 mg/kg) was 0.31 hr-1, which is quite
comparable. However, the Kel derived from the kinetic data for low oral dose (40 mg/kg) was indicative of faster elimination. Figure 3C shows additive effect between single and multi-exposures routes at high dose. At lower dose, the perfect additive effect starts about 100 mins post-exposure. Overall, there are good correlations between the PBPK models and the experimental data.
This study as well as that of others (Liao et al., 2007; Gagné, 2008) show that, internal dose of a substance after multiple routes of exposure is not always equal to the sum of the individual routes, although in the case of isooctane a good concordance was obtained. The PBPK model can be used as a reliable tool to simulate the effect of the single and multi-route on the internal doses.
Conclusion
Overall, the PBPK model could demonstrate the effect of the multi-route exposures on the internal doses in the case of two VOCs (n-hexane and isooctane). Investigations of the kinetic behavior of contaminants such as VOCs are important because of their volatile and lipophilic effect. VOCs can easily and abundantly contaminate underground water which will end up in drinking water and therefore human exposure to these chemicals. Having said that, humans are exposed not to a single chemical but to mixtures of chemicals every day (Konemann and Pieters, 1996). Hence, looking at the exposures as a mixture and not as a single chemical seems essential. Previous studies have shown the capacity of the PBPK model to simulate exposure to mixtures (Haddad et al., 2001, 2010). However, there is no study on the capacity of PBPK models to represent an exposure to a mixture by multiple routes. Future research should therefore focus to develop a PBPK model that can simulate both multi-route and multi-chemical exposures.
37
References
Ali N, Tardif R. 1999. Toxicokinetic modeling of the combined exposure to toluene and n-hexane in rats and humans. J. Occup. Health 41: 95- 103.
Andelman J. 1985. Human exposures to volatile halogenated organic chemicals in indoor and outdoor air. Environ. Health Perspect. 62:313- 318.
Bonnard N, Brondeau M T, Falcy M, Jargot D, Schneider O. 2008. CAS No. 110-54-3 n-hexane fiche toxicologique.
http://www.inrs.fr/inrs-pub/inrs01.nsf/IntranetObject-accesParReference/INRS-FR/$FILE/fset.html/ [10 January 2011]
Brown H S, Bishop D R, Rowan C A. 1984. The role of skin absorption as a route of exposure for Volatile Organic Compounds (VOCs) in drinking water. Am J
Public Health 74: 479- 484.
Charbonneau M, Lock E A, Strasser J, Cox M G, Turner M J, Bus J S. 1987. 2,2,4-trimethylpentane-induced nephrotoxicity : I. metabolic disposition of TMP in male and female Fischer 344 rats. Tox. Appl. Pharm. 91: 171-181.
Chen J S, Litzinger T A, Curran H J. 1998. The lean oxidation of iso-octane at elevated pressures. Edited by western states section combustion institute.
https://e-reports-ext.llnl.gov/pdf/235217.pdf
Dennison J E, Andersen M E, Clewell H J, Yang R S H. 2004. Development of a physiologically based pharmacokinetic model for volatile fractions of gasoline using chemical lumping analysis. Environ. Sci. Technol. 38: 5674–5681.
El-Masri H A, Dowd S, Pegram R A, Harrison R, Yavanhxay S J, Simmons J E, Evans A. 2009. Development of an inhalation physiologically based