Science Arts & Métiers (SAM)
is an open access repository that collects the work of Arts et Métiers Institute of Technology researchers and makes it freely available over the web where possible.
This is an author-deposited version published in: https://sam.ensam.eu Handle ID: .http://hdl.handle.net/10985/11193
To cite this version :
Jean-Paul VINCENT, Cyrille BAUDOUIN, Jérôme BRUYERE, Jean-Yves DANTAN, Régis BIGOT - Gear metrology of statistical tolerancing by numerical simulation - In: International Conference on Advanced Mathematical and Computational Tools in Metrology and Testing/ AMCTM VIII, France, 2008-06 - Advanced mathematical&computational tools in metrology&testing VIII - 2009
Any correspondence concerning this service should be sent to the repository Administrator : [email protected]
GEAR METROLOGY OF STATISTICAL TOLERANCING BY NUMERICAL SIMULATION
JEAN-PAUL VINCENT, CYRILLE BAUDOUIN, JÉRÔME BRUYERE, JEAN-YVES DANTAN, REGIS BIGOT
Laboratoire de Génie Industriel et de Production Mécanique. E.N.S.A.M. de Metz, 4 rue A. Fresnel, 57070 METZ Cedex, France.
E-mail: [email protected]
Tolerance verification permits to check the product conformity and to verify assumptions made by the designer. For conformity assessment, the uncertainty associated with the values of the measurands must be known. In the ISO TS 17450 part 2, the notion of the uncertainty is generalized to the specification and the verification. The uncertainty is divided into correlation uncertainty, specification uncertainty and measurement uncertainty. Correlation uncertainty characterizes the fact that the intended functionality and the controlled characteristics may not be perfectly correlated. Therefore, we propose a new specified characteristics based on the statistical tolerancing approach which is directly in relationship with the design intent: the probability distribution of maximum range of the transmission error (the transmission error is the main source of vibratory and acoustic nuisances), and the evaluation of this characteristic based on 3D acquisition by Monte Carlo simulation and Tooth Contact Analysis. Moreover, the measurement uncertainty of the evaluation of this characteristic is estimated by Monte Carlo Simulation.
1. Introduction
As technology increases and performance requirements continually tighten, the cost and required precision of assemblies increase as well. There is a strong need for increased attention to tolerance design to enable high-precision assemblies to be manufactured at lower costs. Tolerance verification permits to check the product conformity and to verify assumptions made by the designer. Tolerance verification defines inspection planning and metrological procedures for functional requirements, functional specifications and manufacturing specifications.
For gears, two kinds of metrology exist [1], [2]: Geometrical metrology and kinematic metrology. Geometrical metrology is performed to ensure that parts meet tolerance specified on its geometric definition. Kinematic metrology allows determining transmission error of the product. Concerning the gears standards (ANSI/AGMA 2009-B01; DIN 3962), three type of geometrical
deviation are identified: the flank deviation (profile or form deviation…), the situation deviations between flanks (cumulative and single pitch deviations…) and the situation deviations between teeth and hole (runout, …) As geometric deviations impact the kinematic behaviour of the product, it is possible to use a computer program, able to predict the total composite deviation F’I and the
tooth-to-tooth composite deviation f’I knowing the geometric deviation of the
product.This program evaluates the virtual kinematic error based on the CMM’s data points from the geometrical measurement of gears.
The notion of uncertainty is by now well entrenched in metrology. In the ISO TS17450-2, the notion of the uncertainty is generalized to the specification and the verification. In fact, the uncertainties through the product life cycle begin from the design intent to the inspection activity. The uncertainty is divided into correlation uncertainty, specification uncertainty and measurement uncertainty. Correlation uncertainty characterises the fact that the intended functionality and the controlled characteristics may not be perfectly correlated. The specification uncertainty characterizes the ambiguity in the specification expression. And the measurement uncertainty is considered by the metrologists and well described in GUM. The measurement uncertainty includes all the causes of variation from the geometric specification to the result of inspection.
To decrease the correlation uncertainty, a new specified characteristic based on a statistical tolerancing approach is proposed: the probability distribution of the transmission error of the studied gear. This characteristic is in direct relationship with the design intent: the requirement on the transmission error (this approach could be apply to others requirements – backlash, ...) In fact, it is interesting to predict the kinematic behaviour the studied gear with a gear randomly chosen from production i.e. to know the probability distribution of the transmission error of the studied gear.
2. Global Approach
The objective of this paragraph is to present the global approach followed to first estimate the total composite deviation F’I and the tooth-to-tooth composite
deviation f’I for a virtual master gear meshing with a studied gear based on its
acquisition CMM’s data points, and secondly to estimate the probability distribution of the transmission error of the studied gear.
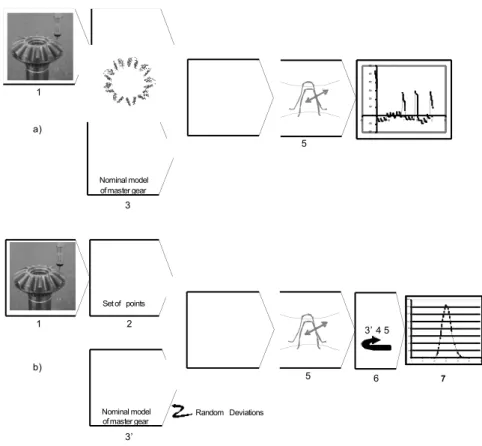
The estimation of F’I and f’I (Approach 1) is detailed in Figure 1a):
1. To obtain an image of a manufactured gear, the acquisition equipment chosen, has been a CMM.
3. A set of points of the nominal model of the master gear geometry is generated
4. Based on the result of the CMM acquisition [3], substitute tooth surfaces in the global coordinate system are reconstructed using Bezier surfaces. The geometrical modelling of parts is detailed in the third chapter.
5. Tooth Contact Analysis (TCA) [4], [6], program computes a simulated transmission error then F’I and f’I are calculated.
Secondly, the estimation of the probability distribution of the transmission error of a studied gear (Approach 2) is detailed in Figure 1 b):
1 2 4 5 3 -200 -100 0 100 200 300 400 500 600 -0,5 0 0,5 1 1,5 2 2,5 -200 -100 0 100 200 300 400 500 600 -0,5 0 0,5 1 1,5 2 2,5 Set of points Nominal model of master gear 4 5 6 3’ 4 5 7 0 200 400 600 800 1000 1200 1400 1600 0 10 20 30 40 50 60 Random Deviations 1 2 3’ Set of points Nominal model of master gear a) b)
Figure 1: a) Detail of the estimation of F’I and f’I. b) Detail of the estimation of the probability
distribution of the transmission error of a studied gear.
3'. The first and the second steps of this approach are the same as before. The geometrical deviations of the wheel and the assembly are modelized by random variables. These geometries provide an image of the manufactured gears.
6. A Monte Carlo simulation computes a set of meshing simulations. Each meshing simulation is computed by a computer program based on Tooth Contact Analysis. The result of this metrology and numerical simulation. 7. The probability distribution of the maximum range of the transmission error
of the measured pinion is then calculated.
To validate the program of virtual meshing simulation, a simulated kinematic error, based on the set of points of the CMM’s measurement of a pair of gears, has been compared to an experimental kinematic error of this same pair of gear. Several measurements have been performed in order to assess the measurement uncertainty of the kinematic metrology.For each test, the tooth-to-tooth composite deviation has been calculated. The simulation meshing program allows evaluating the transmission error of a manufactured gears meshing with an other gear, master, or manufactured one. It provides virtual kinematic metrology estimation. In order to test the robustness of this approach, the confidence interval must be evaluated.
3. Confidence interval of virtual kinematic metrology
In general, the result of a measurement is only an approximation or estimate of the value of the specific quantity subject to measurement. In this case, the measurands are the total composite deviation F’I and the tooth-to-tooth
composite deviation f’I. The uncertainty of the result of this measurement must
be evaluated by statistical methods. Furthermore, the TCA computer program is not base on an explicit model, that’s why the evaluation of uncertainty by the statistical analysis is made by Monte Carlo simulation [5].
The uncertainty and confidence interval of the result given by the meshing simulation program depend on several factors like the approximation error of the fitting operation, the point’s density used to reconstruct surfaces, the numerical precision of the TCA algorithm and the acquisition uncertainty due to the CMM. In order to evaluate the effects of acquisition uncertainty of the step 1 on the result of the simulation, the following method has been followed:
• The evaluation of the acquisition uncertainty is based on CMM’s manufacturer’s specifications,
• The measurand Y (the total composite deviation F’I or the tooth-to-tooth
composite deviation f’I) is not measured directly, but is determined from N
other quantities X1, X2. . . XN (the result of the acquisition: the set of points)
through a functional relation: Y = f(X1, X2, …, Xn). The input quantity Xi is
estimated from an assumed probability distribution based on the evaluation of the acquisition uncertainty. N independent observations Xi,k of Xi are
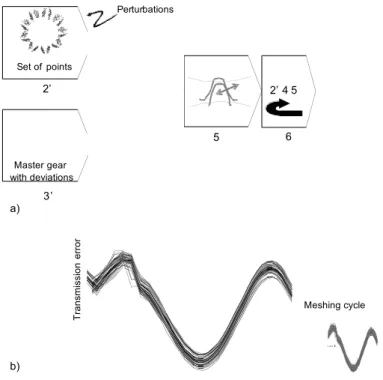
probability distribution and the combined standard uncertainty of the measurand Y is estimated (Figure 2a))
2'. Points of the first geometry are perturbed around there initial position. The perturbation is taken around the value of the uncertainty measurement of a CMM. For example 4 µm. Steps 3’ 4, 5, and 6 are the same as shown in section 2.
Figure 2 b) shows the set of simulations for a set of geometries (perturbed points from 4 µm to their initial position). The confidence interval of the tooth-to-tooth composite deviations for this set of simulation is 2 µm.
2’ 4 5 3’ 6 2’ 4 5 Set of points Master gear with deviations 0.06 0.080.100.120.140.16Mesh cycle _10 _5 5 10 Transmissionerror in_m Perturbations 0.06 0.08 0.10 0.12 0.14 0.16 Mesh cycle _10 _5 5 10 Transmission error in_m a) b) T ra n sm is si o n e rr o r Meshing cycle
Figure 2: a) Uncertainties evaluation approach due to acquisition uncertainties, b) A set of simulations based on perturbed geometries
4. Gear Metrology of Statistical Tolerancing on Transmission Error In this part, a statistical tolerancing approach is proposed to provide a new specified characteristic: the probability distribution of the transmission error of a
studied gear. This characteristic, in direct relationship with the design intent, could decrease the correlation uncertainty (ISO TS 17450 part 2).
Statistical tolerancing is a more practical and economical way of looking at tolerances and works on setting the tolerances so as to assure a desired yield [6]. By permitting a small fraction of assemblies to not assemble or function as required, an increase in tolerances for individual dimensions may be obtained, and in turn, manufacturing costs may be reduced significantly. Statistical tolerance analysis computes the probability that the product can be assembled and will function under given individual tolerance.
Gear roll testing allows knowing the kinematic error of a gear from production meshing with a master gear, but to know how a manufactured gear behaves with others, randomly chosen from production i.e. to know the probability distribution of the kinematic error of the studied gear, a large number of meshing must be performed. To do so, geometrical deviations are introduced in the model of gears. Different models can be use to introduce these deviations i.e. vectorial tolerancing or zone tolerancing.
0 200 400 600 800 1000 1200 1400 1600 0 10 20 30 40 50 60 f’i (micrometers ) N um be r 0 10 20 30 40 50 60 0 400 800 1200
Figure 3: Probability distribution of the maximum range of the transmission error.
Usually, statistical analysis uses a relationship of the form Y = f(X1, X2, …,
Xn) where Y is the response (characteristic such as gap or functional
characteristics) of the assembly and X ={X1,X2, …, Xn} are the values of some
characteristics (such as situation deviations or/and intrinsic deviations) of the individual parts. f can be an explicit function or implicit expression. As it is implicit in or case, statistical analysis methods like Linear Propagation (RSS) and Taylor series cannot be employed. Quadrature technique can be use if the
function is approximable. Monte Carlo Simulation is a powerful tool to know the probability distribution of a functional characteristic of a product for example. The following figure shows the result of a Monte Carlo simulation with 4000 samples: probability distribution of the maximum range of the transmission error: a measured pinion meshing with randomly generated geometries of wheel (equivalent to ISO Quality 6) (Figure. 3).
5. Conclusion
The important point of the proposed specification and metrology for a gear based on dimensional metrology and numerical simulation is to provide a solution which is in adequacy with the design intent. There is no more interpretation for the designer, the manufacturer and the metrologist. This approach could be decrease the correlation uncertainty [ISO TS 17450 – part 2]. Further more, in order to test the robustness of the proposed approach (to evaluate the impact of the measurement uncertainties on the simulated transmission error), the confidence interval of the proposed characteristic has been evaluated using Monte Carlo simulation.
Reference
1. G. Goch, Gear metrology, keynote papers, Annals of the CIRP, 52(2), 1–37. (2003)
2. S. Boukebbab, H. Bouchenitfa, H. Boughouas, J. M. Linares. Applied iterative closest point algorithm to automated inspection of gear box tooth,
Computers & Industrial Engineering, 52, 162-173. (2007)
3. C. Baudouin, R. Bigot, S. Leleu, P. Martin, Gear geometric control software: approach by entities, The International Journal of Advanced
Manufacturing Technology.(2007)
4. F.L. Litvin, A. Funetes and K. Hayasaka. Design, manufacture, stress analysis, and experimental tests of low-noise high endurance spiral bevel gears, . Mechanism and Machine Theory, 41, 83-118. (2006).
5. K.D. Sommer, O. Kuehn, A. Weckenmann, Use of MCM for Uncertainty Evaluation of a Non-Linear and Multivariate Dimensional Measurement Task. CIRP Seminar on Computer Aided Tolerancing, Germany. (2007). 6. J. Bruyère, J.Y. Dantan, R. Bigot, P. Martin, Statistical tolerance analysis of
bevel gears by Tooth Contact Analysis and Monte Carlo simulation,