HAL Id: hal-01021047
https://hal.inria.fr/hal-01021047
Submitted on 9 Jul 2014HAL is a multi-disciplinary open access archive for the deposit and dissemination of sci-entific research documents, whether they are pub-lished or not. The documents may come from teaching and research institutions in France or abroad, or from public or private research centers.
L’archive ouverte pluridisciplinaire HAL, est destinée au dépôt et à la diffusion de documents scientifiques de niveau recherche, publiés ou non, émanant des établissements d’enseignement et de recherche français ou étrangers, des laboratoires publics ou privés.
Ply Level Uncertainty Effects on Failure of Composite
Structures
Shuvajit Mukherjee, Ranjan Ganguli, S Gopalakrishnan, Léa Dominique Cot,
Christian Bes
To cite this version:
Shuvajit Mukherjee, Ranjan Ganguli, S Gopalakrishnan, Léa Dominique Cot, Christian Bes. Ply Level Uncertainty Effects on Failure of Composite Structures. EWSHM - 7th European Workshop on Structural Health Monitoring, IFFSTTAR, Inria, Université de Nantes, Jul 2014, Nantes, France. �hal-01021047�
P
LY LEVEL UNCERTAINTY EFFECTS ON FAILURE OF COMPOSITE
STRUCTURES
S. Mukherjee1, R. Ganguli1, S. Gopalakrishnan1, L. D. Cot2, C. Bes2
1Department of Aerospace Engineering, Indian Institute of Science, Bangalore-560012, India. 2 ICA: Institut Clément Ader, Université de Toulouse; INSA, UPS, Mines Albi, ISAE; ICA; 1, rue
Caroline Aigle, F-31077 Toulouse, France.
[email protected], [email protected], [email protected],
[email protected], [email protected]
ABSTRACT
Composite materials are popular in aerospace engineering because of their light weight, high strength to weight ratio, stiffness to weight ratio and tailoring properties. However, the modeling of composites is still a challenging task because of its highly uncertain material properties which arise from the manufacturing process.The effect of material uncertainties in failure strength and reliability analysis for single ply and cross ply laminated composite subjected to only axial loading is studied in this work. Researchers have categorized the uncertainty at different scales. Meso-scale uncertainty, that is ply level uncertainty, is being considered here. In this paper, the ply level uncertainties are taken as basic random variables and the strength parameters of the composite are derived through uncertainty propagation considering both Tsai-Wu and Maximum stress criteria. Monte Carlo simulation is performed to quantify uncertainty effects.
KEYWORDS: Composite, Material Uncertainty, Reliability, Probability of Failure, Monte Carlo Simulation
INTRODUCTION
Composites are widely used in modern engineering industry due to their high specific strength and specific stiffness value. Composites offer advantages such as the tailoring of properties to meet the design requirements.
Despite the significant advantages, composites suffer from different types of damage
Mechanisms such as fiber breakage, matrix crack, fiber-matrix debonding, edge cracking etc [1, 2]. Researchers have done many deterministic studies to quantify the mechanical properties of composite materials but there are differences between theoretical and experimental investigations [3]. This mismatch is partly attributed to different kinds of uncertainties which comes from manufacturing, quality control etc. The uncertainties in volume fraction, voids, imperfect bonding, misalignment of fiber, crack, fiber breakage, residual stress etc. propagate to larger scale and are responsible for creating the uncertainty in strength and stiffness properties [4, 5]. Researchers have used stochastic methods to account for uncertainties at different scales. Composites are being modeled in different scales [6] such as micro-scale (constituent level, fiber / matrix), meso-scale (ply level), and macro-scale (coupon level). In micro-scale problem fiber/matrix level parameters are taken as random [7]. In macro-scale problem, material and geometric properties at the coupon level are considered as random. These are evaluated by doing some experiments at the coupon level. These parameters are then incorporated into the structural model.
Many researchers have found different distributions for elastic modulus of composite materials based on experiments. Shaw et al. [7] have stated that are best fitted with normal distribution with the help of some hypothesis testing. They have studied uncertainty propagation
considering uncertainty in micro-level parameters. There are many other researchers who have modeled uncertainty and calculated reliability for different loading conditions [8, 9].
In the present work, meso-scale parameters such as , , , are taken as random [10,11].
The ply angle and ply thickness are kept as deterministic. Classical laminated plate theory (CLPT) is used along with Tsai-Wu and Maximum-Stress failure criterion to evaluate the distribution of the strength parameters and probability of failure estimation is performed for cross ply and angle ply laminates with the help of Monte Carlo simulations [12].
1 MATHEMATICAL MODEL
A unidirectional fiber composite is taken. The principal material direction is denoted by 1-2 axis and the reference axis system is shown by the x-y axis. Different lamina with different fiber directions with respect to the reference direction can be arranged to get the specific design.
Classical laminated plate theory is considered to perform the analysis. According to Kirchhoff, a line normal to mid-plane of the plate will remain straight and normal to the deformed mid-plane. A displacement of a point belonging to a normal line to the plate is composed of a translation and a rotation. The in-plane displacement field at any arbitrary point is given by
( ) ( ) ( )
( ) ( ) ( )
( ) ( ) (1) Where and denotes the mid-plane displacement in the direction parallel to reference x-y
axis system and is the transverse displacement of the mid-plane along z axis. The strain displacement equation in matrix form is:
{ }( ) { } { } (2)
Where, { } { } is the mid-plane strain vector and { } { } is the mid-
plane change of curvature and twist vector. Stiffness matrix with respect to principal material coordinate system for a single lamina of a laminated composite is:
[ ]( ) [ ] ( ) (3) Where, , (4)
[ ]( ) is called reduced stiffness matrix of lamina. are longitudinal modulus,
transverse modulus and shear modulus, respectively, for lamina. Also and
are Poisson
ratios. The stress-strain relations for the lamina with respect to principal material direction and
global x-y system are as follows:
{ }( ) [ ]( ){ }( ) , { }( ) [ ̅]( ){ }( ) (5)
Where, [ ̅]( ) [ ] [ ]( )[ ] is the transformed reduced stiffness matrix with respect to
reference x-y system and [ ] is transformation matrix. The laminate constitutive equation that relates the in-plane force and moment resultants to strain is:
{ } [ ] { } (6)
Where, { } { } is the mid-plane stress resultant vector and in-plane stiffness
{ } { } is the mid-plane moment resultant vector. The A, B, D matrix are the
matrix, coupling stiffness matrix, and bending stiffness matrix.
Solving equation (6), we ultimately we get the strain and the curvature with respect to applied force and moment
EWSHM 2014 - Nantes, France
{ } { } { } (7)
{ } ( ) ({ } { }) (8)
Equation (5) is then used to get the stress values with respect to principal material direction.
2 MAXIMUM STRESS FAILURE CRITERION
According to this theory a lamina will fail when at least one of the stress components along the principal material direction reaches the magnitude of the corresponding strength in that direction:
or (for tensile stress) or (for compressive stress)
| | (for shearing stress) (9)
Where and are normal stresses with respect to principal material direction (1-2), is the shear stress in the 1-2 plane, and are tensile and compressive strength in the fiber direction; and are the tensile and compressive strength normal to fiber direction, and is the shear strength.
3 TSAI-WU FAILURE CRITERION
Tsai-Wu criterion suggests that a lamina will be safe if it satisfies the following condition:
(10)
The failure surface for an orthotropic material under plane stress condition becomes:
(11)
The coefficients are determined by the following relationships:
( ) (12)
4 PROBABILISTIC FAILURE CURVE
AS4/8522 carbon-epoxy laminated composite plate is considered here to perform the analysis. Thickness of each ply is taken as 0.182 mm. The mean and coefficient of variation values of meso-scale uncertain parameters such as longitudinal modulus, transverse modulus, shear modulus and Poisson ratio are taken from Onkar et al. [11].
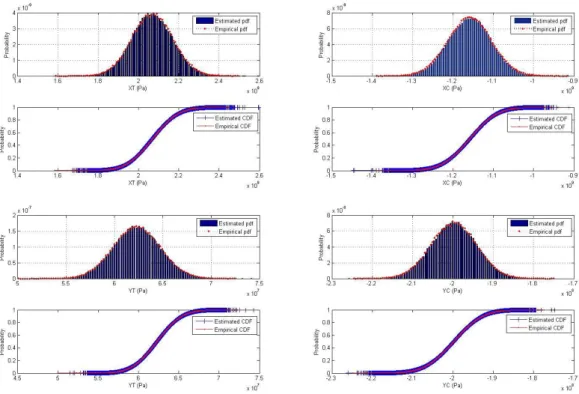
Considering this meso-level uncertainty, the probabilistic failure curve for Tsai-Wu and maximum stress criteria and the distribution of the strength parameters using Tsai-Wu and maximum stress criteria is evaluated. Figure 1 is shows the probabilistic failure envelopes. The histogram and CDF, shown in Figure 2 and figure 3 for the strength parameters are obtained from Tsai-Wu and maximum stress criterion. After performing the KS test all of them are best fitted with normal distribution with some mean and coefficient of variation (COV); the details are given in Table 1. Monte Carlo simulation is performed considering 100000 sample points to generate the distribution of the strength parameters.
To determine the strength parameters, a symmetric laminate is taken and subjected to in-plane loads thickness of each lamina is taken as t. Laminate strength can be analyzed with the help of strength ratios. Tsai-Wu failure theory and maximum stress criteria is being used for this endeavor. The form of Tsai-Wu failure criteria becomes:
[ ] [ ] (13)
The strength ratios are functions of lamina orientation and applied load and one pair will exist for each ply of the laminate. When the analysis is completed, a failure ellipse for the entire laminate is constructed. The mid-surface stresses are determined in terms of the applied load divided by the total thickness. The load vector { } { } becomes { } { } . The lamina
stress with respect to material coordinate system is evaluated in terms of and it is incorporated into Tsai-Wu and Maximum stress failure equation to get the failure curves. Here only 0 degree plies are taken. Thus we obtain the strength values corresponding to transverse and longitudinal strength values. Here we obtain a number of stochastic realizations for the 100000 values of each of the strength parameters due the material uncertainty.
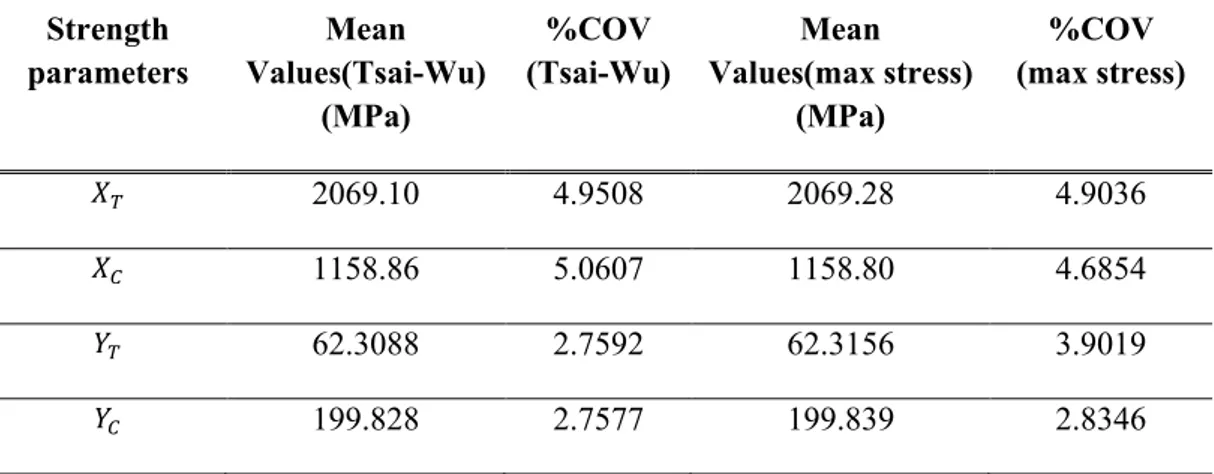
Figure 1: Probabilistic Failure Envelopes of Tsai-Wu and Maximum Stress criteria Table 1: Derived mean and standard deviation values of strength parameters
From Maximum Tsai-Wu and stress failure curve equation Strength parameters Mean Values(Tsai-Wu) (MPa) %COV (Tsai-Wu) Mean Values(max stress) (MPa) %COV (max stress) 2069.10 4.9508 2069.28 4.9036 1158.86 5.0607 1158.80 4.6854 62.3088 2.7592 62.3156 3.9019 199.828 2.7577 199.839 2.8346
EWSHM 2014 - Nantes, France
Figure 2: Distribution of strength parameters from Tsai-Wu criterion
5 PROBABILITY OF FAILURE
In the present study only in-plane longitudinal force along the global reference system is considered to evaluate the probability of failure. Only cross-ply and angle-ply laminate is considered for probability of failure analysis. To determine the stress tensor developed in each ply, classical laminated plate theory is used. The probability of failure is evaluated under generalized plane stress condition. The uncertainty is considered in both material properties as well as in strength values to calculate the probability of failure (Pf).
6 FAILURE FUNCTION
Here Tsai-Wu criterion, one of the quadratic failure criteria, is considered to obtain the limit state equation for the analysis of failure. For unidirectional fiber composite, the limit state function becomes:
( ) (( ) ( ) ( ) ( ) ) (14)
Where { } and { }. When ( ) , failure will occur. Both Stress and strength parameters are considered random. The stress values are random because of material uncertainty. The material uncertainty is incorporated through CLPT.
7 MONTE CARLO SIMULATION
Monte Carlo simulation is one of the most useful and powerful methods to determine the probability of failure of a system with the help of basic system design variables. The limit state equation for a system can be defined with the help of load and strength parameters as follows:
( ) (15) Where ’s denote the basic design variables and ( ) denotes the limit state function. Here equation (14) is taken as the limit state equation. The failure will occur when ( ) and survive when ( ) . So the probability of failure of a structure is represented by the following equation and the integration is done over the region ( ) .
∬ ∫ ( ) (16)
Monte Carlo simulation is performed to evaluate this integral. Each of these basic design variables is generated as per their specified distribution and they are put into the limit state equation. The probability of failure is calculated by the following relationship:
(17) Where, denotes the number of cycles that satisfy ( ) and N is the total number of
Monte Carlo simulation.
8 PROBABILITY OF FAILURE CURVE
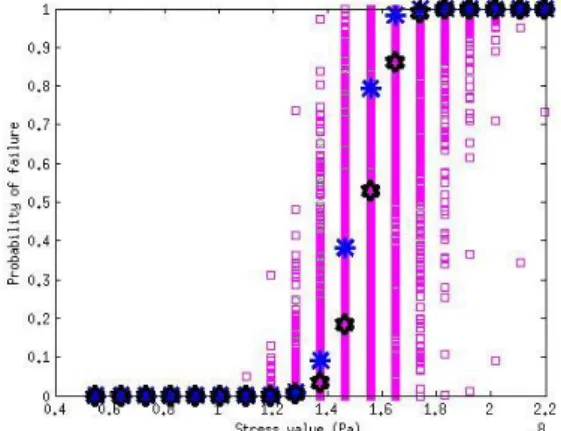
We can see from the figures of probability of failure (Pf) curve (figures. 4-6) that for a lamina of a cross-ply or angle-ply laminate there is a band of Pf value for a particular stress value. The Pf curve for outer lamina is denoted by green circle and the same is denoted by square boxes for the middle layer of a three layered laminate. The Pf curve without material uncertainty is shown by black hexagonal point for the middle lamina and blue asteroid for outer lamina. Probability of failure curve without ply level uncertainty for two lamina is quite distinguishable. If we see the probability
EWSHM 2014 - Nantes, France
of failure curves considering the ply level uncertainty we can see for some laminate overlap is there and for some cases the overlap is indistinguishable.
Figure 4: Pf of two lamina cross ply laminate Figure 5: Pf of two lamina of crossply laminate
Figure 6: Pf of two lamina of angle ply Figure 7: Reliability of two lamina of cross ply laminate laminate
CONCLUSION
In this present work, Monte Carlo based simulation technique is used to estimate the probabilistic failure curve from Tsai-Wu and maximum stress criterion. Probability of failure curve of three layered cross-ply and angle-ply laminate is evaluated. The results focused on the effect of the probabilistic nature of meso-scale material properties. From figure 7, it is clear that if we do not consider the material uncertainty effect on structural reliability assessment, we will overestimate the reliability value of composite. It is seen in the stochastic failure curve that the variability is more in the third quadrant of the failure envelope. From the figures of Pf of cross ply and angle ply laminate it is clear that due to ply level uncertainty we are getting a band of Pf values for a particular stress value and sometimes it is difficult to separate the failure curve for corresponding lamina. For most conservative design, we can take the innermost boundary of the scatter plot of Tsai-Wu failure envelope or the left zone of Pf curve for corresponding level of probability of failure.
ACKNOWLEDGEMENT
The authors acknowledge the support of the Indo-French Centre for Applied Mathematics for conducting this research.
REFERENCES
[1] P.M. Pawar, and R. Ganguli, On the Effect of Matrix Cracks in Composite Helicopter Rotor Blades, Composite Science and Technology, Vol. 65, No. 3-4, 2005, pp. 581-594.
[2] P. Gayathri, R. Ganguli, Material Uncertainty Effects on Frequency of Composite Plates with Matrix Crack Induced Delaminations, Structural Durability and Health Monitoring, Vol. 7, No. 1-2, 2011, pp. 119-137.
[3] Jones RM. Mechanics of Composite Materials. 2nd Ed. London: Taylor & Fransis; 1999.
[4] H.K. Jeong, R.A. Shenoi. Probabilistic Strength Analysis of Rectangular FRP Plates Using Monte Carlo
Simulation. Comput Struct 76(3):219-35, 2000.
[5] S. Sriramula, M.K Chryssanthopoulos, Quantification of Uncertainty Modeling in Stochastic Analysis of
FRP Composite Structures. Composites Part A: Appl Sci Manuf 40:1673-84,2009.
[6] A. Shaw, S. Sriramula, P.D Gosling, and M.K Chryssanthopoulos, A Critical Reliability Evaluation of
Fiber Reinforced Composite Materials Based on Probabilistic Micro and Macro-Mechanical Analysis, Composites: Part B, Vol. 41(6,Pp. 446-453, 2010)
[7] M.C. Shiao, CC Chamis. Probabilistic Evaluation of Fuselage-Type Composite Structures. Probab Eng
Mech,14(1-2):179-87, 1999.
[8] C.T. Sun, S.E. Yamada. Strength Distribution of a Unidirectional Fiber Composite. J Compos
Mater,15:462-80, 1981
[9] R.C. Wetherhold. Reliability Calculations for Strength of a Fibrous Composite Under Multiaxial Loading. J Compos Mater, 15: 240-8, 1981.
[10] G. Sarangapani, R. Ganguli, Effect of Ply Level Material Uncertainty on Composite Elastic Couplings in Laminated Plates, International Journal for Computational Methods In Engineering Science And Mechanics 14(3) 244-261, 2013.
[11] A.K. Onkar, C.S. Upadhyay, D. Yadav, Stochastic Finite Element Buckling Analysis of Laminated Plates With Circular Cutouts Under Uniaxial Compression Journal of Applied Mechanics 74(4), 798-809, 2007.
[12] R.Y. Rubinstein, D.P. Kroese. Simulation and the Monte Carlo Method. 2nd Ed. A John Willey & Sons,Inc. Publication.
EWSHM 2014 - Nantes, France