HAL Id: hal-01348833
https://hal.archives-ouvertes.fr/hal-01348833
Submitted on 25 Jul 2016
HAL is a multi-disciplinary open access
archive for the deposit and dissemination of
sci-entific research documents, whether they are
pub-lished or not. The documents may come from
teaching and research institutions in France or
abroad, or from public or private research centers.
L’archive ouverte pluridisciplinaire HAL, est
destinée au dépôt et à la diffusion de documents
scientifiques de niveau recherche, publiés ou non,
émanant des établissements d’enseignement et de
recherche français ou étrangers, des laboratoires
publics ou privés.
Radio frequency spectral characterization and model
parameters extraction of high Q optical resonators
Zeina Abdallah, Y.G. Boucher, Arnaud Fernandez, Stéphane Balac, Olivier
Llopis
To cite this version:
Zeina Abdallah, Y.G. Boucher, Arnaud Fernandez, Stéphane Balac, Olivier Llopis. Radio frequency
spectral characterization and model parameters extraction of high Q optical resonators. Scientific
Reports, Nature Publishing Group, 2016, 6 (6), pp.27208. �10.1038/srep27208�. �hal-01348833�
Radio frequency spectral
characterization and model
parameters extraction of high Q
optical resonators
Zeina Abdallah
1,2, Yann G. Boucher
3,4, Arnaud Fernandez
1,5, Stéphane Balac
6& Olivier Llopis
1A microwave domain characterization approach is proposed to determine the properties of high quality factor optical resonators. This approach features a very high precision in frequency and aims to acquire a full knowledge of the complex transfer function (amplitude and phase) characterizing an optical resonator using a microwave vector network analyzer. It is able to discriminate between the different coupling regimes, from the under-coupling to the selective amplification, and it is used together with a model from which the main resonator parameters are extracted, i.e. coupling factor, intrinsic losses, phase slope, intrinsic and external quality factor.
High quality (Q) factor optical resonators1,2 (also known as resonant optical cavities) with different configura-tions, have been extensively investigated in the last decades, because of their importance in different applications such as narrow linewidth laser stabilization3, microwave photonics4, optical frequency combs generation5, optical filters6,7 and sensors8. Many different resonator technologies can be involved in these applications, with some of which featuring a ultra-high Q factors, such as: Ultra Low Expansion (ULE) Fabry-Perot resonators9 (Q ~ 1010), Whispering Gallery Modes (WGM) resonators, e.g. silica spheres10 (Q ~ 109) or polished monocrystalline disks11 (Q ~ 108 to 1010), active or passive fiber ring resonator12 (Q ~ 108 to 1010). Therefore, a detailed knowledge of their properties is essential to accurately model these devices and thus to achieve better performance.
The optical resonator should be experimentally characterized in order to determine its real parameters, espe-cially its free spectral range (FSR), full-width at half-maximum (Δ f1/2), loaded optical quality factor (Q), intrinsic quality factor (Q0), intra-cavity losses (α), transmission coefficient (ρ) and, last but not least its intra-cavity power enhancement factor (IPEF).
In a high Q factor resonator, it is difficult to induce a sufficient amount of light from conventional lasers. For example, a Q factor of 109 near λ = 1550 nm results in a 3 dB bandwidth of 200 kHz, which is lower than the spectral width of a semiconductor laser. Using a high spectral purity laser (such as a fiber laser) can be part of the solution. However, when the laser light is injected in the resonator, it heats the resonator (even at low power, because of the photons lifetime), the resonator frequency is thus shifted and, consequently, the signal is lost.
To address these problems, several techniques have been investigated to accurately measure the resonator properties. These techniques are either based on optical domain approaches or on radio frequency domain approaches.
The first one is the optical scan method, which uses the slow tuning of a high spectral purity laser to scan the resonant modes. A good estimate of the resonator optical quality factor is provided by a slow scan of one resonant mode. However, because of the resonator’s self-heating and the resulting resonance frequency shift, the resonance plot is often different when the scan is performed with an increasing or a decreasing frequency, even if the laser frequency tuning speed is carefully adjusted13. This technique can thus induce errors in the measured spectral shape of ultra-high Q resonators, and it contains no information regarding the phase of the transfer function.
The second technique is a time domain approach based on the frequency-swept cavity ring down spectros-copy14–16, based on the measurement of the photon lifetime inside the resonant cavity by studying its relaxation
1LAAS-CNRS, Université de Toulouse, CNRS, 7 avenue de Colonel Roche, 31031 Toulouse, France. 2CNES, 18 avenue
Edouard Belin, 31400 Toulouse, France. 3FOTON CNRS, UMR 6082, ENSSAT, CS 80518, 22305 Lannion, France. 4ENIB, CS 73862, F-29238 BREST cedex 3, France. 5Univ de Toulouse, UPS, LAAS, F-31400 Toulouse, France. 6IRMAR, Université de Rennes 1, CNRS, Campus de Beaulieu, 35042 Rennes, France. Correspondence and requests
for materials should be addressed to Z.A. (email: zeina.abdallah@laas.fr) received: 21 January 2016
accepted: 11 May 2016 Published: 02 June 2016
www.nature.com/scientificreports/
regime. This technique is mostly applied to measure resonators with very high intrinsic finesse without the use of a stabilized laser. It provides not only the state of the resonator coupling regime but also the different contribution of the resonator’s parameters to its optical quality factor as well. Nevertheless, this method can only be accurate with resonator’s quality factor higher than 107 and must include a least square fitting method to recover amplitude and phase transition.
The third one is a spectral domain measurement bench17 based on a microwave vector network analyzer (VNA) featuring a very high frequency precision as good as 1 Hz. This technique has been used to characterize several types of resonators, featuring Q factors ranging from 106 to 1010. This paper demonstrates that, in addition to the amplitude response of the resonator, which gives access to the measure of several parameters like the FSR, the Δ f1/2 and thus the quality factor, this technique is also able to simultaneously characterize the resonator phase response thanks to a VNA. This is essential because the slope of the phase transition at the resonance is helpful to the identification of the resonator’s coupling regime, and the model extraction based on both the amplitude and the phase plot is also very accurate compared to an extraction based only on the amplitude data. In this paper, the characterization technique is thoroughly described and analyzed, and then the resonator model and the parame-ter extraction procedures from VNA measured data are detailed and discussed.
Results
Analytical study.
Temporal dependence is given as ejw t0. As first established by A. Yariv18,19, a simple and ideal description of an optical resonator in linear regime is depicted as monomode straight and ringing wave-guides connected together through an ideal coupler (Fig. 1a). This resonator can be characterized by three essen-tial parameters18,19: the coupler direct transmission coefficient (ρ ∈ [0, 1]), the roundtrip attenuation or amplitude amplification coefficient (α, real positive number) and ring roundtrip phase (ϕ).By varying α and/or ρ coefficient, the coupling regime is changed from the under-coupling to the selective amplification regime (Fig. 1b). If α < 1, the ring resonator has internal losses, this is likely to occur in the under- over- and critical regimes; if α > 1, the ring behaves as an amplifier and the regime is known as selective ampli-fication. However, α can’t be greater than a threshold value corresponding to the system’s oscillation αth = 1/ρ.
Using the same formalism as Yariv, which is a frequency approach based on transfer matrix, the resonator’s transfer function can be expressed as:
ϕ ρ α αρ ϕ = = − − = ϕ ϕ φ − − A b a e e A e ( ) 1 ( ) (1) j j j 2 1
and the intensity transmission of the resonator is readily expressed from equation (1) as,
ϕ α ρ αρ ϕ αρ αρ ϕ = + − + − A( ) 2 cos( ) ( ) 1 2 cos( ) (2) 2 2 2 2
Previous studies18 have shown the intensity profile behavior as a function of the amplitude amplification parame-ter α, keeping the transmission coefficient ρ constant (Fig. 2a). Moreover the resonator’s Q factor can be deduced from the intensity profile half width (Δ f1/2) measurement thanks to formula Q = ν0/Δ f1/2, where ν0 = w0/2π is the optical frequency.
Using the fact that 0 < aρ < 1, the exact expression of Δ f1/2 can be computed from equation (1). This yields to the following expression for the resonator’s Q factor:
τ αρ αρ = + − Q w 2 arc cos 2 1 ( ) (3) L 0 2 1
where the constant τL = ngL/c stands for the ring cavity roundtrip time, ng is the refractive index, L the resonator
length and c the speed of the light in free space. Excepted for transparency where Δ f1/2 is not defined (A(ϕ) = 1)
because the resonator behaves as a purely dephasing component, equation (3) shows that the Q factor is getting higher as aρ increases (Fig. 3a).
In the specific case of high finesse resonators, it is usual to express the resonator’s Q factor in terms of the intrinsic quality factor Q0, due to the inside ring losses and corresponding to ρ = 1 in equation (3), and the exter-nal quality factor Qe obtained from the assumption of zero losses inside the ring, i.e. α = 1 in equation (3), as
= +
− − −
Q 1 Q01 Qe1 (4)
For high finesse resonators, Δ f1/2 is small and approximating cos(ϕ) by its second order Taylor expansion 1 − ϕ2/2 leads to the following expression for the resonator’s Q factor deduced from equation (3)
τ α ρ αρ = + − Q w 1 2 2 (1 ) (5) L 0 2 2
Now, to express Q−1 as a sum in which the dependence on α and ρ is separated, the second order mixed derivative of Q−1 with respect to α and ρ must be zero. This rigorously happens if and only if αρ = 1 but the decomposi-tion into two separated funcdecomposi-tions can be assumed for αρ ≅ 1, which agrees with the high finesse assumpdecomposi-tion. Elementary differential calculus shows that the expressions of Q0 and Qe are then
τ α τ ρ = − = − Q w Q w 2 ln( ) 2 ln( ) (6) L e L 0 0 0
This Q factor expression, using Q0 and Qe with separated variables, makes the link between Yariv approach and
H. Haus20 phenomenological model.
Using Yariv formalism, the resonator’s phase φ can be deduced from equation (1) and it is expressed as:
Figure 2. (a) Intensity |A(ϕ)|2 and (b) phase φ(ϕ) transition of the transfer function for ρ = 0.5 depending on the different possible coupling regime of the resonator: α = 0.1 (under coupling); α = 0.5 (critical coupling);
α = 0.6 (over coupling); α = 1 (transparency); α = 1.5 (selective-amplification).
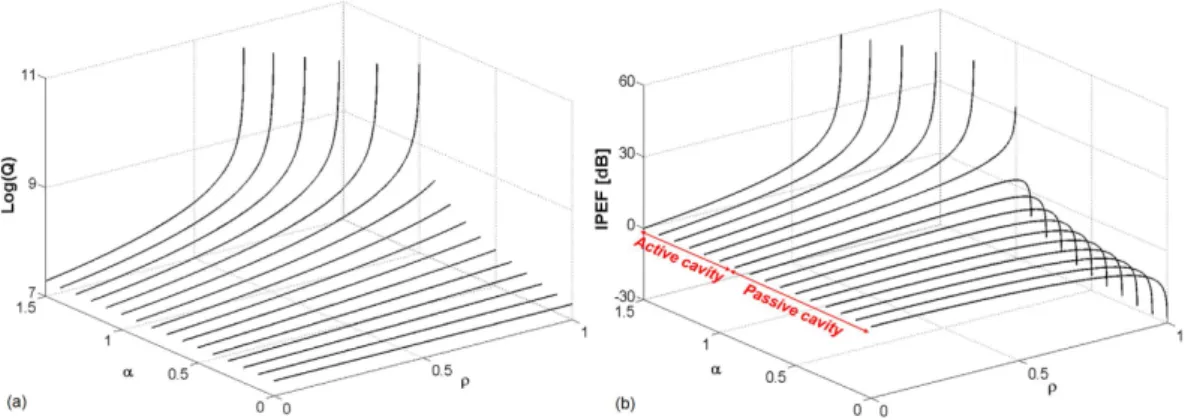
Figure 3. (a) Optical quality factor (Q) and (b) intra-cavity enhancement factor (IPEF) in function of α and ρ
www.nature.com/scientificreports/
φ ϕ α ϕ ρ α ϕ αρ ϕ αρ ϕ = − − − +K ( ) arc tan sin( )cos( ) arc tan
sin( )
1 cos( ) (7)
where K denotes a real positive constant. In under-coupling regime and at critical coupling, K = 0 and therefore
φ ∈ [− π/2, π/2]. In selective amplification, transparency or over-coupling regime, K = 0 when
ϕ∈ − −π ρ α
∪
π ρ α( )
a a[ , cos( / )] cos , , K = − π when ϕ ∈ −
ρ α
( )
a cos , 0 and K = π when ϕ ∈ 0, cosa
( )
αρ and therefore φ ∈ [0, 2π] (see Fig. 2b). A particular attention has to be paid to the phase slope FD given by
φ ϕ ϕ α ρ αρ ρ α = = − − − ϕ= F d d ( ) (1 ) (1 )( ) (8) D 0 2
and to its sign at resonance φ(ϕ = m2π), where m is some integer.
The sign of FD, positive or negative, refers to “fast light” and “slow light” regime21,22 respectively. Note that since
one can get the same intensity profile at under- and over- coupling regimes, see equation (2), the phase profile will help to discriminate each regime. It is noteworthy that FD is not defined for the critical coupling since φ(ϕ) is
discontinuous for ϕ = m2π.
This analytical study shows that a qualitative observation of both intensity and phase profile allows the deter-mination of the coupling regime of the resonator and thus on the relationship between the two parameters α and
ρ describing the linear resonator. Last but not least, A. Yariv’s formalism makes it possible to obtain the exact solution for the phase and intensity profiles without doing any assumption.
Additionally, it is desirable to control the intra-cavity power inside the resonator by quantifying its intra-cavity power enhancement factor (IPEF) as a function of α and ρ (equation 9), since due to the intra-cavity power build up at resonance, many nonlinear optical effects are generated inside the resonator, for example the stimulated Brillouin scattering, which may be harmful12 or beneficial23 depending on the application.
In the case of a passive cavity (i.e. α < 1), IPEF reaches its maximum in the critical coupling regime (ρ = α). However, in the case of an active cavity (i.e. α > 1), IPEF increases remarkably as the resonator approaches the laser oscillation threshold (ρ = 1/αth) (Fig. 3b).
ρ αρ = − − ϕ= IPEF 1 (1 ) (9) 2 2 0
Characterization technique description.
The microwave characterization bench is depicted in Fig. 4. This characterization starts once the laser is stabilized onto one of the resonator’s resonant frequencies by using a low-frequency Pound-Drever-Hall (PDH) feedback loop24–27 (see section Methods for details). Other techniques may be used to lock the laser and resonator frequencies, such as thermal lock28 or direct optical lock, or a com-bination of both techniques29. However, these techniques are not well suited to the proposed characterization approach, firstly because the thermal lock involves a small shift between the resonator and the laser frequencies (in such a case, a single sideband modulator is needed to recover the resonator transfer function) and secondly because both techniques are not as stable as the PDH loop in case of a small room temperature drift. Also, the optical locking is only possible if a non-isolated laser is closely connected to the resonator, which is a hard to control configuration.As soon as the laser is locked, a sweeping low power RF signal (~10 GHz) coming out of VNA’s port 1 (i.e. RF output) drives the Mach-Zehnder modulator (MZM), biased at Vπ/2 in order to get a linear modulation. The
resulting modulation optical sidebands travel along an all-fiber polarization controller so as to select TE (trans-verse electric) or TM (trans(trans-verse magnetic) modes and then go through the optical resonator. The response is finally recovered on a fast photodiode (PD), with a sufficiently large bandwidth and analyzed on port 2 of the VNA (i.e. RF input port), which displays the optical resonator’s transfer function (amplitude and phase) in elec-trical domain. If the laser is stabilized at the resonance center, the RF response is the optical response translated to the RF domain thanks to the frequency mixing effect of the photodiode. If the VNA has been correctly cali-brated (see below), the RF losses at the resonant frequency are twice the optical losses in dB at the laser frequency
Figure 4. Experimental setup of the microwave characterization technique using a vector network analyzer (VNA). EOM: electro-optic modulator; MZM: Mach-Zehnder modulator; PC: polarization controller; PD:
(resonance center) because of the power detection effect. However, the overall slope of the transfer function is unchanged while it is brought back to the RF domain.
It is noteworthy that even though the VNA is a highly linear receiver featuring sufficient spectral purity, a number of imperfections may limit the measurement accuracy. Firstly, the laser must be properly locked to one resonance of the resonator. In case of a slightly laser detuning with resonance, the beating response of the two lateral sidebands won’t exactly reproduce the complex transfer function of the resonator. This problem can be avoided thanks to the offset function of the PDH loop. Another solution would be to use a single sideband mod-ulator in place of a conventional MZM. This could be particularly useful in case of a dispersive resonator, for which the two lateral resonances under investigation may occur at different offset frequencies from the central one. However, this configuration is scarce on a frequency bandwidth reachable with electronic devices, i.e. below 50 GHz offset from the central resonance peak. Secondly, one must calibrate the VNA in order to measure the transfer function without taking into account the length of the access RF cables and optical fibers. This is per-formed by proceeding to a calibration when the resonator is bypassed. Then to cancel the remaining resonator’s pigtail fiber length (l), a virtual time delay τ is added to the calibration correction such that τ = ngl/c.
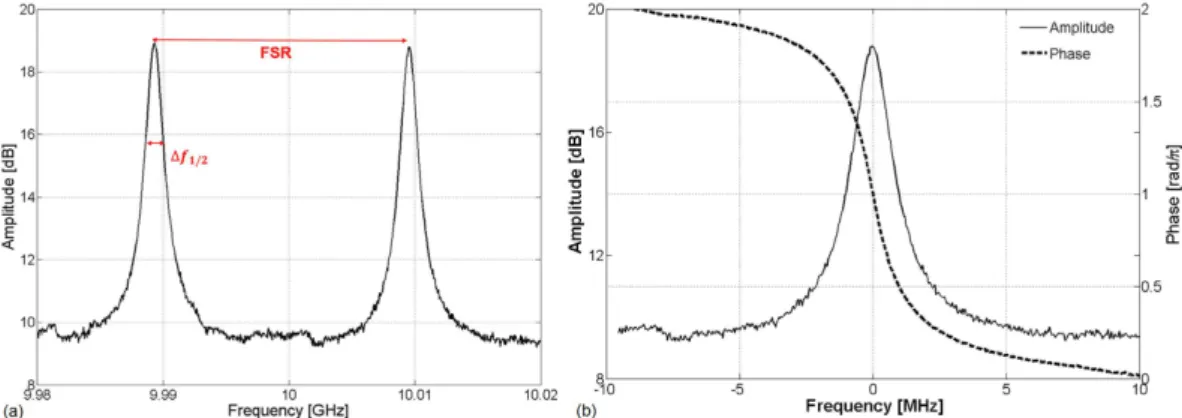
Figure 5a shows an example of such a measurement performed when the laser carrier is locked onto an active fiber ring resonator. This response transcribes accurately the resonator frequency comb and, focusing on the amplitude response of some resonant modes (from 9.96 to 10.02 GHz in this case), gives access to the measurement of the resonator parameters like the free spectral range (FSR), Δ f1/2, Q and the finesse F (defined as FSR/Δ f1/2).
Here, in the selective amplification regime, the measured Q factor is 1.66 108, for ν0 and Δ f1/2 equal to 193 THz and 1.16 MHz respectively.
The profile and slope of the phase transition (Fig. 5b) at the resonance are as important as the amplitude response since they provide additional information and conditions to accurately identify the state of the reso-nator’s coupling regime. Along with amplitude response, they can be fitted by the analytical expressions of the transfer function (equations (2) and (7)), so as to extract the main resonator’s coefficients: ρ (or coupling coeffi-cient κ) and α.
Using this technique, any problem in the characterization bench, especially in the locking process, is imme-diately detected via the resonance shape (amplitude of the transfer function). One of these problems could be the two states of polarization behavior of the optical carrier or a possible shift between the laser and the resonator frequencies, leading to two optical modes propagation inside the resonator. Another problem is the calibration of the VNA and particularly of the offset delay value τ, since an inaccurate delay could affect the measurements, precisely the slope of the phase transition of the transfer function. However, in case of high Q resonators charac-terization, the possible error on the phase slope is extremely small. As an example, a 1 cm error on a pigtail length will only lead to a relative error of 3 10−3 on the measured equivalent delay (and Q factor) of a Q = 107 resonator. Furthermore, the bandwidth of this bench is restricted by the bandwidth of the optoelectronic components (mod-ulator and photodiode), and in its current version, the bench is only able to characterize resonators with an FSR smaller than 50 GHz.
Discussion
An experiment has been carried out to demonstrate the validity of the RF-spectrum characterization technique using an active optical fiber ring resonator30,31, which has been designed using an erbium-doped fiber amplifier and an optical bidirectional coupler (see section Methods for more details). The laser used in this experiment is a fiber laser (Koheras Adjustik) with a very narrow linewidth (1 kHz) emitting at λ = 1550 nm. The laser lock on a resonance is achieved first by varying the laser temperature and then using a piezoelectric control input. Once locked, the amplitude and the phase of the resonator’s output have been measured while varying the intra-cavity losses α (by changing the laser pump power, PPump), in order to assess the different coupling regimes. Figure 5b
depicts the transfer function (amplitude and phase) for a pump power of 21.5 dBm. From its amplitude curve and its phase slope at the resonance, it is obvious that the resonator is in selective amplification regime.
Figure 5. (a) Transfer function of an active fiber ring resonator measured using the RF-spectrum
www.nature.com/scientificreports/
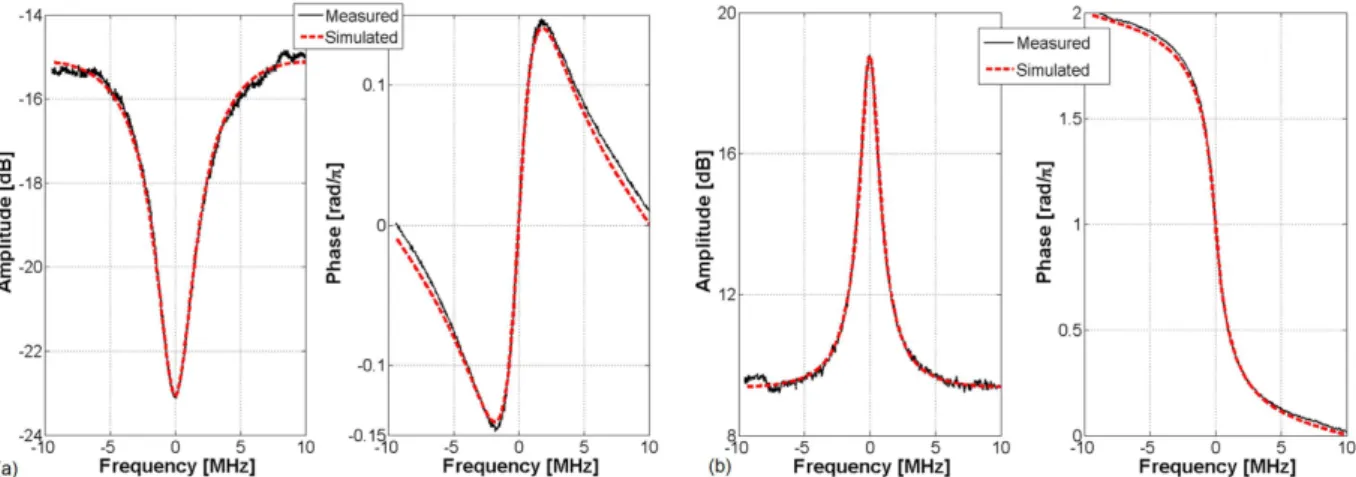
The experimental data (amplitude and phase) are then fitted with equations (2) and (7) using the least mean square algorithm, which is based on only two parameters, i.e. the intra-cavity losses (or gain) α and the trans-mission coefficient ρ. Figure 6 shows the fitted and measured data for both the amplitude and phase of the output transfer function under two different laser pump power (7.5 and 21.5 dBm). The α and ρ parameters are thus extracted from the numerical fitting method (Table 1).
For low laser pump power (7.5 dBm, i.e. low gain amplifier, Fig. 6a), the resonator is in under-coupling regime, which means that the intra-cavity losses must be lower than the coupler transmission coefficient, i.e. α < ρ. For high PPump (21.5 dBm, Fig. 6b), precisely for 1 < α < 1/ρ, the selective amplification is obtained. Once α and ρ
are obtained, the Q0 and Qe factors can be calculated and Q values are computed from equations (3) and (4). The
obtained values of the fitting parameters meet well the conditions for each coupling regime.
When the resonator is in its selective amplification regime, α is a gain (1 < α < 1/ρ) and the intrinsic quality factor Q0 is negative. The computed Q values are compared to the measured data, 3.26 107 and 1.66 108 for 7.5 and 21.5 dBm of laser pump current respectively, in order to obtain the error. A good agreement is found between measured and computed values of Q from the extracted α and ρ data.
It’s notable that even though the cavity ring down approach allows to get the same parameters, the fitting procedure in the spectrum-RF approach allows a simple and more accurate extraction of the resonators’ state and parameters. In fact, the modulus and phase transfer function are immediately observed with spectrum-RF method which is not the case with cavity ring down approach. This allows a visual and straightforward deduction of the coupling regime and of the relationship between α and ρ coefficients. This relationship is immediately fed to the least mean square algorithm as initial condition.
Methods
Stabilization technique description.
The Pound-Drever-Hall (PDH)24–27 laser stabilization technique is based on using the phase information of a laser signal passing through the resonator. Firstly, the laser carrier is phase modulated with a low frequency (fG) by means of an electro-optic modulator (EOM). The signal generatorfrequency (fG) is typically a few MHz, which is around the resonator bandwidth. The transmitted signal through
the resonator is then sent to a fast photodiode. The amplitude of the photodiode’s output voltage is filtered and sent to an electrical mixer to be mixed with a fraction of the low frequency signal (fG) used to drive the modulator.
The mixer’s output represents an error signal proportional to the frequency detuning between the laser and the resonance. Finally, the error signal is sent to a servo-controller in order to adjust the laser’s wavelength.
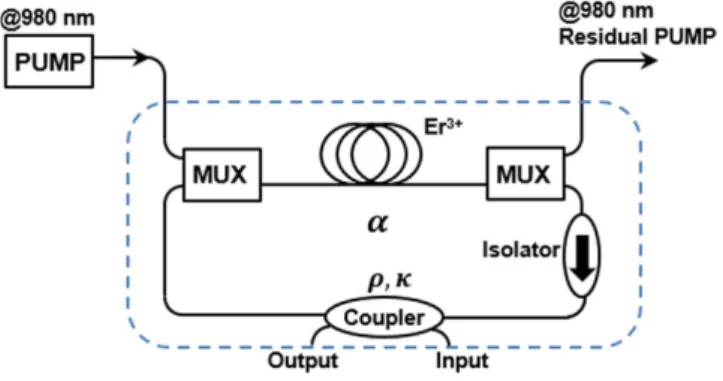
Active optical fiber ring resonator.
Figure 7 depicts the active optical resonator which was designed using a fibered 2 × 2 optical bidirectional coupler linked to a 2.1m-long erbium-doped (DrakaElite eHPW-9) fiber amplifier. The coupler’s transmission coefficient (ρ) is 50%. An isolator is added to prevent backward reflectionsFigure 6. Experimental data (black solid line) and curve fitting (red dotted line) of the amplitude and phase of
the output signal (a) PPump = 7.5 dBm, (b) PPump = 21.5 dBm.
PPump = 7.5 dBm PPump = 21.5 dBm
α 0.503 1.2
ρ 0.72 0.69
Q0 4.69 107 − 1.65 108
Qe 9.75 107 8.44 107
Q Equation (3) ≈ 3.46 107 (5.7% error) ≈ 1.66 108 (3.6% error)
Equation (4) ≈ 3.17 107 (3% error) ≈ 1.72 108 (3.5% error)
Table 1. Fitting parameters values for PPump = 7.5 dBm and PPump = 21.5 dBm, the fitted Q values are
and to ensure unidirectional light wave propagation. By varying the laser pump power, it is possible to change the roundtrip cavity losses (α) of the resonator and therefore to control the coupling regime from under-coupling to over-coupling, and up to the selective amplification.
References
1. Vahala, K. J. Optical microcavities. Nature 424, 839–846 (2003).
2. Heebner, J., Grover, R. & Ibrahim, T. Optical microresonators: theory, fabrication, and application (Springer, 2008). 3. Liang, W. et al. Ultralow noise miniature external cavity semiconductor laser. Nat. Commun. 6, 1–6 (2015).
4. Savchenkov, A. A. et al. Whispering-gallery mode based opto-electronic oscillators. Frequency Control Symposium (FCS), 2010 IEEE
International, Newport Beach, CA, 554–557, doi: 10.1109/FREQ.2010.5556268 (2010).
5. Kippenberg, T. J., Holzwarth, R. & Diddams, S. A. Microresonator-based optical frequency combs. Science 332, 555–559 (2011). 6. Mandal, S., Dasgupta, K., Basak, T. K. & Ghosh, S. K. A generalized approach for modeling and analysis of ring-resonator
performance as optical filter. Optics Communication 264, 97–104 (2006).
7. Merrer, P. H., Llopis, O., Nicole, P. & Constant, S. Modeling and practical demonstration of multiple optical fiber ring resonators in the microwave domain. Microw. Opt. Technol. Lett. 54, 1552–1556 (2012).
8. Maxwell, A. et al. Polymer microring resonators for high-frequency ultrasound detection and imaging. IEEE. J. Sel. Topics Quantum
Electron. 14, 191–197 (2008).
9. Ludlow, A. D. et al. Compact, thermal-noise-limited optical cavity for diode laser stabilization at 1 × 10⁻¹⁵. Opt. Lett. 32, 641–643 (2007).
10. Righini, G. C. Whispering gallery mode microresonators: Fundamentals and applications. Riv. Nuovo. Cimento 34, 437–488 (2011). 11. Savchenkov, A., Ilchenko, V., Matsko, A. & Maleki, L. Kilohertz optical resonances in dielectric crystal cavities. Phys. Rev. A 70,
051804 (2004).
12. Saleh, K., Llopis, O. & Cibiel, G. Optical scattering induced noise in fiber ring resonators and optoelectronics oscillators. J. Lightwave
Technol. 31, 1433–1446 (2013).
13. Merrer, P. H. et al. Microwave filtering using high Q optical resonators. Microwave Conference, 2008. EuMC 2008. 38th European,
Amsterdam, 2008, 381–384, doi: 10.1109/EUMC.2008.4751468 (2008).
14. Hahn, J. W., Yoo, Y. S., Kim, J. W. & Lee, H. W. Cavity ringdown spectroscopy with a continuous-wave laser: calculation of coupling efficiency and a new spectrometer design. Appl. Opt. 38, 1859–1886 (1999).
15. He, Y. & Orr, B. J. Ringdown and cavity-enhanced absorption spectroscopy using a continuous-wave tunable diode laser and a rapidly swept optical cavity. Chem. Phys. Lett. 319, 131–137 (2000).
16. Dumeige, Y. et al. Determination of coupling regime of high-Q resonators and optical gain of highly selective amplifiers. J. Opt. Soc.
Am. B 25, 2073–2080 (2008).
17. Merrer, P. H. et al. Characterization technique of optical whispering gallery mode resonators in the microwave frequency domain for optoelectronic oscillators. Appl. Opt. 51, 4742–4748 (2012).
18. Yariv, A. Universal relations for coupling of optical power between micro-resonators and dielectric waveguides. Electronics Letters 36, 321–322 (2000).
19. Yariv, A. Critical coupling and its control in optical waveguide-ring resonator systems. IEEE Photon. Technol. Lett. 14, 483–485 (2002).
20. Haus, H. A. Waves and fields in optoelectronics (Prentice-hall, 1984).
21. Tomita, M., Uesugi, H., Sultana, P. & Oishi, T. Causal information velocity in fast and slow pulse propagation in an optical ring resonator. Phys. Rev. A 84, 043843 (2011).
22. Rasoloniaina, A. et al. Controling the coupling properties of active ultrahigh-Q WGM microcavities from undercoupling to selective amplification. Sci. Rep. 4, 4023, doi:10.1038/srep04023 (2014).
23. Geng, J. et al. Highly stable low-noise brillouin fiber laser with ultranarrow spectral linewidth. IEEE. Photon. Technol. Lett. 18, 1813–1815 (2006).
24. Black, E. D. An introduction to Pound-Drever-Hall laser frequency stabilization. Am. J. Phys. 69, 79–87 (2001).
25. Merrer, P. H., Llopis, O. & Cibiel, G. Laser stabilization on a fiber ring resonator and application to RF filtering. IEEE Photon.
Technol. Lett. 20, 1399–1401 (2008).
26. Drever, R. V. Electronic frequency stabilization of microwave oscillators. Rev. Sci. Instrum. 17, 490–505 (1949). 27. Drever, R. W. P. et al. Laser phase and frequency stabilization using an optical-resonator. Appl. Phys. B. 31, 97–105 (1983). 28. Carmon, T., Yang, L. & Vahala, K. J. Dynamical thermal behavior and thermal self-stability of microcavities. Opt. Express 12,
4742–4750 (2004).
29. McRae, T. G., Lee, K. H., McGovern, M., Gwyther, D. & Bowen, W. P. Thermo-optic locking of a semiconductor laser to a microcavity resonance. Opt. Express 17, 21977–21985 (2009).
30. Zhang, F. & Lit, J. W. Y. Direct-coupling single-mode fiber ring resonator. J. Opt. Soc. Am. A 5, 1347–1355 (1988).
31. Heebner, J. E., Wong, V., Schweinsberg, A., Boyd, R. W. & Jackson, D. J. Optical transmission characteristics of fiber ring resonators.
IEEE. J. Quantum Electron. 40, 726–730 (2004).
www.nature.com/scientificreports/
Acknowledgements
We acknowledge the financial support of CNES (Centre National d’Etude Spatiales) and the Regional Council of Midi Pyrénées (Optomilliref project).
Author Contributions
Z.A., A.F. and O.L. performed the experiments and designed the active optical ring resonator, the programming and simulations were done by Z.A., A.F. and S.B. All the authors contributed in the analytical studies, reviewed the manuscript and agreed on the interpretations.
Additional Information
Competing financial interests: The authors declare no competing financial interests.
How to cite this article: Abdallah, Z. et al. Radio frequency spectral characterization and model parameters
extraction of high Q optical resonators. Sci. Rep. 6, 27208; doi: 10.1038/srep27208 (2016).
This work is licensed under a Creative Commons Attribution 4.0 International License. The images or other third party material in this article are included in the article’s Creative Commons license, unless indicated otherwise in the credit line; if the material is not included under the Creative Commons license, users will need to obtain permission from the license holder to reproduce the material. To view a copy of this license, visit http://creativecommons.org/licenses/by/4.0/