See discussions, stats, and author profiles for this publication at: https://www.researchgate.net/publication/306172897
Traditional versus scientific method: The differences exist between selecting
players
Article · July 2016 DOI: 10.7752/jpes.2016.s1108 CITATIONS 2 READS 570 4 authors, including:Some of the authors of this publication are also working on these related projects:
Design of a combined Test to Measure the Skills Performance among the Junior Football Players View project
study some biomechanical variables in the steps of supports of the triple jump and their relationship with the digital levelView project Mohammed Zerf
Université Abdelhamid Ibn Badis Mostaganem
95 PUBLICATIONS 68 CITATIONS SEE PROFILE Houar Abdelatif Université de Ghardaia 7 PUBLICATIONS 11 CITATIONS SEE PROFILE Bengoua Ali Mostaganem University 36 PUBLICATIONS 27 CITATIONS SEE PROFILE
All content following this page was uploaded by Mohammed Zerf on 20 September 2016. The user has requested enhancement of the downloaded file.
online ISSN: 2247 - 806X; p-ISSN: 2247 – 8051; ISSN - L = 2247 - 8051
Original Article
Traditional versus scientific method: the differences exist between selecting
players
ZERF MOHAMMED1, HOUAR ABELATIF2, MIME MOKHTAR3, BENGOUA ALI4
1,2,3,4
Physical Education Institute Laboratory OPAPS, University of Mostaganem, Mostaganem 27000, ALGERIA
Published online: July 30, 2016
(Accepted for publication June 20 2016)
DOI:10.7752/jpes.2016.s1108 Abstract:
The purpose of this study was to evaluate the differences existed between the traditional method and Scientific, based on the Soccer Post-Game. Where our sample was the Selecting Players, representing the lightship Oran for year 2014- 2015. On this basis as specialists, our interventions have come to determine, firstly the errors of the traditional method, as well as differences between the post-game. Where our objective was to integrate the scientific observation as a means to analyse the data acquired by research Team, for the 38 players selected, tested by the test Cooper and vertical jump as physiological parameters, body fat and body mass index as anthropometric characteristics.
Based on the analysis statistics, we confirm the defects of the traditional method:
a) the weakness of the traditional method is in Body Fat Which cannot be predicted with the naked eye. b) All attackers and defenders chosen, have more body fat, at less maximal aerobic capacity and string.
c) The difference between the selected players return to the relationships body fat with the performance demands physiological.
On based on differences acquired by research Team, we subject that the tradition is not more subjective methods of selecting Algerian players. Thing confirmed in the participation of national young teams in various world championships and internal continent, which is not famous, observed in the choice of the national team coach, which prefers to recruit players from abroad and dispenses on the local player Service.
Keywords: Soccer, Post-Game, Algerians Soccer Players. Introduction
Identification the Talent in sport is big business. Where (Elaine Wolstencroft, 2002)confirm that many East European countries released the weakness of the traditional method, and attempted to develop methods of identification which could be underpinned with scientific theory and evidence.
Whether the traditional method is the most used in football Algerian (DRISSI, B, 2004) . According to (Athanasios G. Papaioannou, Dieter Hackfort -, 2014) that there are a number of problems with these traditional methods of talent identification when applied in sports performance. Where (ZAHNER, L. e, 2003) confirms it in the concepts of the Selection based on the "gaze of coach" which is subjective and based on instinct.
Whereabouts Filipe Manuel Clemente confirms that the profile of player/ team is related to both biological and environmental factors (Filipe Manuel Clemente, Micael Santos Couceiro,Fernando Manuel Lourenço Martins,Monika Ognyanova Ivanova, and Rui Mendes, 2013). that it can be estimated by the new evaluations technology (Zerf Mohammed, Mokkedes Moulay idriss, Dani Hassiba, 2015) as the physiological databases for the elite soccer players which original from Western Europe and North America (Ming-Kai Chin PhD, Y. S. A. Lo MD FRCP, C. T. Li MPhil MCSPt and C. H. So MPhilt, 1992), based on the scientific observation acquired by method kinematic analysis (Barros RML, Misuta MS, Menezes RP, Figueroa PJ, Moura FA, Cunha SA, Anido R, Leite NJ, 2007) , which it referred on the distance covered by players in a match to calculate the index of physiological demands presented by the total distance covered in a game (Reilly T, Gilbourne D., 2003) (Haff , G. Gregory , Triplett , N. Travis, 2015). Unfortunately, there is a scarcity of descriptive data on the physical characteristics of Algerian soccer players, where Zerf Mohammed et al, (Zerf Mohammed, Mokkedes Moulay idriss, Dani Hassiba, 2015) explain in the lack of new technology Kinematic and kinetic analysis and the argument of Algeria coach to the objective assessment.
From the above, the purpose of this study was to evaluate the differences existing between Soccer Post-Game Players selected to represent the teams of lightship Oran in the selection of regional teams. Where the research team recorded on this occasion, the parameters of 38 selected players (anthropometric and physiological), tested by the Cooper, vertical jump, body fat and body mass index, as a database statistical for a multinomial logistic regression chosen to identify the defects of the observation method.
ZERF MOHAMMED, HOUAR ABELATIF, MIME MOKHTAR, BENGOUA ALI
---
JPES ®
www.efsupit.ro674
Material and Methods Sample
The data used in this study were obtained through the database Team 5 Physical Education Institute Laboratory OPAPS for the academic year 2014-2015 (Optimization of physical activity and sport programs (LABOPAPS), 2015). In terms of player-related data, 38 male soccer players under 17 years selected to represent the teams of lightship Oran in the selection of regional teams. were Examined by the Research Team 5 laboratory OPAPS in parameters (anthropometric and physiological chosen for the current study) see table1, after one week of them regional selections. Whereas to expert the study protocol and methods we choose the laboratory OPAPS “Institute of Physical Education of our University” who approve it by the professors of football and physiological training effort.
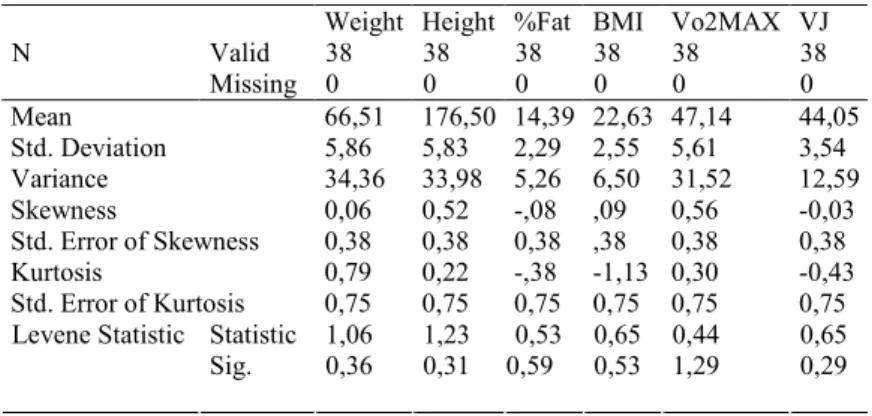
Table 1. Physiological and Anthropometric characteristics by total group
Weight Height %Fat BMI Vo2MAX VJ
Valid 38 38 38 38 38 38 N Missing 0 0 0 0 0 0 Mean 66,51 176,50 14,39 22,63 47,14 44,05 Std. Deviation 5,86 5,83 2,29 2,55 5,61 3,54 Variance 34,36 33,98 5,26 6,50 31,52 12,59 Skewness 0,06 0,52 -,08 ,09 0,56 -0,03 Std. Error of Skewness 0,38 0,38 0,38 ,38 0,38 0,38 Kurtosis 0,79 0,22 -,38 -1,13 0,30 -0,43 Std. Error of Kurtosis 0,75 0,75 0,75 0,75 0,75 0,75 Statistic 1,06 1,23 0,53 0,65 0,44 0,65 Levene Statistic Sig. 0,36 0,31 0,59 0,53 1,29 0,29 Testing Protocol:
The maximal aerobic capacity: We have chosen the maximal aerobic capacity based on the formula
Test Cooper (VO2max = 22,351 d (km)- 11,288 (ml/min/kg)) (Jean Ferré, Philippe Leroux, 2009) where John Gormley et al set (2009) (John Gormley, Juliette Hussey, 2009)that the Cooper 12-minute test, the 1.5-mile test, the Rockport One-Mile Fitness Walking Test and the multi-stage shuttle have A corresponding vO2max obtained by the formula. Also Yigal Pinchas, (2006) (Yigal Pinchas, 2006) set them accurate which is correlated between 90–95 per cent. where Oskari Saari,et al (2016) (Oskari Saari, Aki Hintsa , 2016)indicate that the Cooper test provide a better picture of endurance of maximal aerobic capacity. However, Joel A. DeLisa et al (Joel A. DeLisa, Bruce M. Gans, Nicholas E. Walsh, 2005)confirm that maximal aerobic capacity is rarely the limiting factor in performing daily work tasks. Where the Progressive respiratory muscular weakness leads to restrictive lung disease.
Weight and Height: Height (m) and weight (kg) were each measured in the standing position (Yoko
Goto, Hirohide Yokokawa,corresponding author Hiroshi Fukuda, Toshio Naito, Teruhiko Hisaoka, and Hiroshi Isonuma, 2015) where Helge Hebestreit et al, (2008) confirm that the Vo2peak is associated with biological status after controlling for height and weight.
Body Fat: The method uses is the Anthropometric, it requires body circumference measurements to
estimate body fat percentages. In our case we choose the Body Fat Calculator from the U.S. Navy it requires takes waist, neck, and height circumference for men and hips, neck, and height for women.
Where Chandra B Singh (Chandra B Singh, 2014) set that this calculator is quite important to find the ratios of fat in the body. Thing confirms by Wayne Jacobs (2015) for the sake of ease, let's use (Dr. Wayne Jacobs - 2015, 2015) this online calculator. According to Johnny T. Flynn (2006) http://imuw.linear-software.com/online.html.
Body mass index: BMI was calculated as body mass (kg) divided by height (m) squared. The subjects’
adiposity was classified according to WHO standards (World Health Organization (WHO), 2008): underweight was defined as BMI < 18.5, normal weight as BMI ≥ 18.5 and <25, overweight as BMI ≥ 25 to BMI <30, and obesity as a BMI ≥30 (Marzena Malara, Anna Kęska, Joanna Tkaczyk and GraŜyna Lutosławska, 2015)
Statistical Analyses
Data analysis was performed using SPSS 22.0 for Windows (32BIT). Data obtained from the tests showed a normal distribution and were presented as mean ± standard deviation, Anova, LSD, Levene Statistic, Shapiro-Wilk test and Regression analyses which were conducted to analyse the combined of the variables chosen to study. Where the relationship between the variables was analysed by Pearson correlations (r).
Results
The characteristics of the study sample are presented in Table1. All the variables accept Normality and the homogeneity based on Shapiro-Wilk test Thought the total group and Levene Statistic based on the Soccer Post-Game. Whereas the Mean ± SD, Anova and LSD choose the differences between Post-Game case the body fat, BMI, cooper test and vertical Jump in the opposites of Weight and Height which they are not significant.
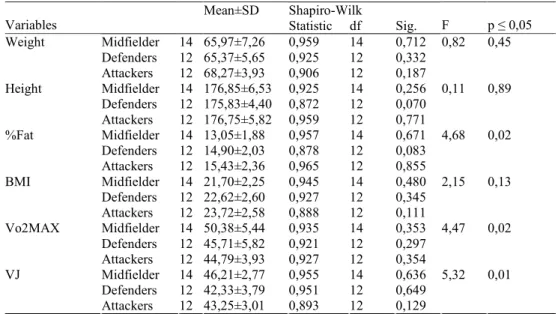
--- 675 Table 2. Presents the baseline characteristics of the participants based on the post-game.
Shapiro-Wilk Variables Mean±SD Statistic df Sig. F p ≤ 0,05 Midfielder 14 65,97±7,26 0,959 14 0,712 Defenders 12 65,37±5,65 0,925 12 0,332 Weight Attackers 12 68,27±3,93 0,906 12 0,187 0,82 0,45 Midfielder 14 176,85±6,53 0,925 14 0,256 Defenders 12 175,83±4,40 0,872 12 0,070 Height Attackers 12 176,75±5,82 0,959 12 0,771 0,11 0,89 Midfielder 14 13,05±1,88 0,957 14 0,671 Defenders 12 14,90±2,03 0,878 12 0,083 %Fat Attackers 12 15,43±2,36 0,965 12 0,855 4,68 0,02 Midfielder 14 21,70±2,25 0,945 14 0,480 Defenders 12 22,62±2,60 0,927 12 0,345 BMI Attackers 12 23,72±2,58 0,888 12 0,111 2,15 0,13 Midfielder 14 50,38±5,44 0,935 14 0,353 Defenders 12 45,71±5,82 0,921 12 0,297 Vo2MAX Attackers 12 44,79±3,93 0,927 12 0,354 4,47 0,02 Midfielder 14 46,21±2,77 0,955 14 0,636 Defenders 12 42,33±3,79 0,951 12 0,649 VJ Attackers 12 43,25±3,01 0,893 12 0,129 5,32 0,01
Thought the table 3 were the calculate of LSD based on post-game show Less fatty mass registered in the benefit of Midfielder. While the BMI stresses that the defenders and attackers carrying more percentage of grease. Whereas the maximum oxygen consumption and vertical jump, shows the differences which are in the interests of the Midfielder and no differences between defenders and attackers in all the compare.
Table 3. The differences characteristics of the participants in basic post-game.
Dependent Variable (I) POST (J) POST Mean
Difference (I-J) p ≤ 0,05 Defenders -1,84* 0,03 Midfielder Attacker -2,37* 0,00 Midfielder 1,84* 0,03 %Fat Defenders Attacker -0,53 0,53 Defenders -0,92 0,35 Midfielder Attacker -2,02* 0,04 Midfielder 0,92 0,35 BMI Defenders Attacker -1,09 0,28 Defenders 4,66* 0,02 Midfielder Attacker 5,58* 0,00 Midfielder -4,66* 0,02 Vo2MAX Defenders Attacker 0,92 0,66 Defenders 3,88* 0,00 Midfielder Attacker 2,96* 0,02 Midfielder -3,88* 0,00 VJ Defenders Attacker -0,91 ,48
Through Table 4 where the Results of regression shows that the problem of players slected lines in the proportion of fat as single variable explains the differences between the Post-Game
Table 4. Results of regression analyses relating Post-Game and the variables chosen to study.
Model Stepwise R R 2 Adjusted R2 Coefficientsa T P f P
(Constant) -0,45 0,65 1 0,44 a 0,19 0,18 %Fat 2,9 3 ,00 8,6 0 0,00
Variables Entered: all the variables.
Dependent Variable: Post-Game / Predictors: (Constant), %Fat Excluded Variables: Weight. Height, BMI, Vo2MAX, vertical Jump
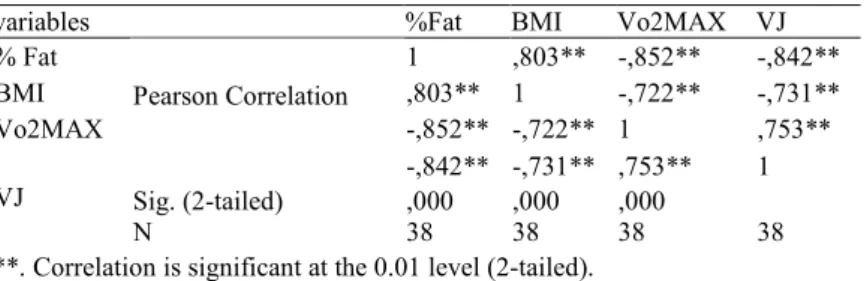
Through the table 5 The Pearson correlations are perceived strongly positively between anthropometric measurements, which are negative with measurements physiological.
ZERF MOHAMMED, HOUAR ABELATIF, MIME MOKHTAR, BENGOUA ALI
---
JPES ®
www.efsupit.ro676
Table 5. The correlations between the variables tested in the current study by total group
variables %Fat BMI Vo2MAX VJ
% Fat 1 ,803** -,852** -,842** BMI ,803** 1 -,722** -,731** Vo2MAX -,852** -,722** 1 ,753** Pearson Correlation -,842** -,731** ,753** 1 Sig. (2-tailed) ,000 ,000 ,000 VJ N 38 38 38 38
**. Correlation is significant at the 0.01 level (2-tailed).
Discussion
Based on the statistical applied. Our results confirm:
a) the weakness of the traditional method is in Body Fat, which cannot be predicted with the naked eye. Thing confirmed by Zahner, L et al (2003) in the concepts of the Selection based on the "gaze of coach" which is subjective and based on instinct.
b) All attackers and defenders chosen, have more body fat, at less maximal aerobic capacity and string. where Arthur D Stewart, et al (2011) set that the skeletal age and anthropometric characteristics in adolescent elite soccer players, their judgment requires skinfold measurements.
c) The difference between the selected players return to the relationships body fat with the performance demands physiological. Where (Dave Day, Tegan Carpenter, 2015)confirm that the performance demands within a sport, an accurate assessment of athlete capabilities in relation to these demands. Whereas William N.et al (2002) and A.W.S. Watson (2014) confirm that Low body fat is an important factor in athletic performance (William N. Taylor, M.D, 2002), (A.W.S. Watson, 2014). Case Midfields in the opposites of the other post-game.
Based on the soccer similar studies by post, case the performance in the cooper test, we agree that the requirements imposed for the players training and competition, advantage the midfielders which run the long-distance (Briggs, Marc, 2013), in the opposite of the attacker and defender (Tim McGarry, Peter O'Donoghue, António Jaime de Eira Sampaio, 2013). Whereas the problem of our soccer selected set in the indicate of Hossein Soltani et al where they set that defenders and attackers’ Vo2max has decreased as a result of less running (Hossein Soltani, Syed Reza Attarzadeh Hosseini, Majid Farahneia, Zahra Hojati, 2012). Whereas JESPER STRØYER et al confirm that The elite players exercised a higher vo2max related to the body mass composition compared with the young elite players (JESPER STRØYER, LONE HANSEN, and KLAUS KLAUSEN, 2004). In the case of vertical Jump our attackers and defenders’ values are less then Midfields, from that, we agree the indicate of Bram Swinnen (2016): to Improving the maximal sprinting speed of players with a higher training status requires velocity-specific strength training (Bram Swinnen , 2016 ). Whereabouts to explain the physical level of our attackers and defenders, we refer to indicate of Youlian Hong et al (Youlian Hong, Roger Bartlett, 2008) that the Longer distance covered by walking is record to the attackers and defenders, which do not meet modern football requirements, where the player is called to defend and attack simultaneously. Where Svetlana Liparova, Mgr, (2014) (Svetlana Liparova, Mgr, 2014)confirm that The basic endurance zone comprises 75-85% of the individual maximum, i.e. aerobic metabolism. Where the special race endurance ranges from 85% up to 95% of the individual speed maximum (SVETLANA LIPÁROVÁ, JAROSLAV BROĎÁNI, 2015). further (Donald A. Chu, Gregory Myer, 2013) confirm that The strength development is one of the crucial elements in endurance training. As well the Specialised trainings help to develop the appropriate and most loaded muscular areas during the performance (Gill Stewart, 2014). Whether (Plisk, S. S., & Stone, M. H., 2003) The employed training means should correspond to the structure of the performance.
Conclusion
From the above, we agree the choice of the national team coach, which prefers to recruit players from abroad and dispenses on the local player Service. Where of B. Drissi, (2004) [2] confirms that the national football never reached its cruising speed, as much as the traditional method is used as selection means in football Algerian [2]. an evidence confirmed by Athanasios G. Papaioannou et al [3] that there are a number of problems with these traditional methods. From proof, our finding confirms that the levels of the aerobic and anaerobic fitness (Per A. F. H. Renström, 2008) in Selecting Players must be are relate with the analysis of body composition (body fat bone and muscle), which are important for any complete fitness program (Robert G. McMurray , 1998 ). whether it is important for our players and their coaches to identify the changes in body composition during growth to allow for the accurate interpretation (Nick Draper, Helen Marshall, 2014) related to their progressions. On base and limitation of this study, we advise our selection committee, that the physiological and anthropometric characteristics of young soccer players according to their playing position is a relevant way to the selection process (Christopher Carling, Tom Reilly, A. Mark Williams, 2008). Because the
--- 677 lower in weight as the crucial physiological characteristic and low percentage body fat as the most important physical characteristic. (Thomas Reilly, N. Secher, P. Snell, 2005)
References
A.W.S. Watson. (2014). Physical Fitness and Athletic Performance . US: Routledge.
Athanasios G. Papaioannou, Dieter Hackfort -. (2014). Routledge Companion to Sport and Exercise
Psychology. US: Routledge.
Barros RML, Misuta MS, Menezes RP, Figueroa PJ, Moura FA, Cunha SA, Anido R, Leite NJ. (2007). Analysis of the distances covered by first division Brazilian soccer players obtained with an automatic tracking method. Journal of Sports Science and Medicine, 6, 233–242.
Bram Swinnen . (2016 ). Soccer, Strength Training for Soccer. US: Routledge. Briggs, Marc. (2013). Training for Soccer Players. UK: British Library.
Chandra B Singh. (2014). Weight Loss Calculators for Motivation Before and After Weight Loss. US: Google books Edition.
Christopher Carling, Tom Reilly, A. Mark Williams. (2008). Performance Assessment for Field Sports. US: Routledge.
Dave Day, Tegan Carpenter. (2015). A History of Sports Coaching in Britain: Overcoming Amateurism. US: Routledge.
Donald A. Chu, Gregory Myer. (2013). Plyometrics. US: Human Kinetics.
Dr. Wayne Jacobs - 2015. (2015). The Strong Temple: A Man's Guide to Developing Spiritual and
Physical Health. US: WestBow Press.
DRISSI, B. (2004). Morpho-functional characteristics and technical-tactical performance. Alger: these de doctorat.
Elaine Wolstencroft. (2002). Talent Identification and Development:An Academic Review. UK: www.sportscotland.org.uk.
Filipe Manuel Clemente, Micael Santos Couceiro,Fernando Manuel Lourenço Martins,Monika Ognyanova Ivanova, and Rui Mendes. (2013). Activity Profiles of Soccer Players During the 2010 World Cup. J
Hum Kinet, 30(38), 201–211. doi:Published online 2013 Oct 8. doi: 10.2478/hukin-2013-0060
Gill Stewart. (2014). The Complete Guide to Nordic Walking . US: A&C Black.
Haff , G. Gregory , Triplett , N. Travis. (2015). Essentials of Strength Training and Conditioning 4th
Edition. US: Human Kinetics.
Hossein Soltani, Syed Reza Attarzadeh Hosseini, Majid Farahneia, Zahra Hojati. (2012). The Comparison of Aerobic Fitness and Anaerobic Power of Iranian Soccer. Scholars Research Library, 3(8), 4023-4027.
Jean Ferré, Philippe Leroux. (2009). Preparedness sports teacher qualifications. FR: Editions Amphora.
Jesper Strøyer, Lone Hansen, and Klaus Klausen. (2004). Physiological Profile and Activity Pattern of Young Soccer Players during Match Play. Official Journal of the American College of Sports Medicine, 168-174. doi:10.1249/01.MSS.0000106187.05259.96
Joel A. DeLisa, Bruce M. Gans, Nicholas E. Walsh. (2005). Physical Medicine and Rehabilitation:
Principles and Practice, Volume 1. US: Wolters Kluwer Health.
John Gormley, Juliette Hussey. (2009). Exercise Therapy: Prevention and Treatment of Disease. US: Wiley.com.
Marzena Malara, Anna Kęska, Joanna Tkaczyk and GraŜyna Lutosławska. (2015). Body shape index versus body mass index as correlates of health risk in young healthy sedentary men. Journal of Translational
Medicine, 13, 75. doi:10.1186/s12967-015-0426-z
Ming-Kai Chin PhD, Y. S. A. Lo MD FRCP, C. T. Li MPhil MCSPt and C. H. So MPhilt. (1992). Physiological profiles of Hong Kong elite soccer. Br J Sp Med, 26(4), 262-266.
Nick Draper, Helen Marshall. (2014). Exercise Physiology: For Health and Sports Performance. US: Routledge.
Optimization of physical activity and sport programs (LABOPAPS). (2015, 01 01). Laboratoires de
recherche. (Université Abdelhamid Ibn Badis Mostaganem) Retrieved from http://www.univ-mosta.dz/index.php/k2/k2-user-page
Oskari Saari, Aki Hintsa . (2016). The Core: Better Life, Better Performance. Filand: ISBN 978-951-0-42086-7.
Per A. F. H. Renström. (2008). Handbook of Sports Medicine and Science, Tennis. US: Wiley.com. Plisk, S. S., & Stone, M. H. (2003). Periodization strategies. In National Strength & Conditioning
Association, 25(6), 19-37.
Reilly T, Gilbourne D. (2003). Science and football: a review of applied research in the football codes.
Journal of Sports Sciences, 21, 693–705.
ZERF MOHAMMED, HOUAR ABELATIF, MIME MOKHTAR, BENGOUA ALI
---
JPES ®
www.efsupit.ro678
Svetlana Lipárová, Jaroslav Broďáni. (2015). Dynamics of the aerobic and anaerobic threshold in relation to training load in cross triathlon. Journal of Physical Education and Sport, 15(4), 619 - 626. doi:10.7752/jpes.2015.04094
Svetlana Liparova, Mgr. (2014). Anaerobic lactate resistance ofa cross triathlete's body. European
Scientific Journal, 10(9), 80-94.
Thomas Reilly, N. Secher, P. Snell. (2005). Physiology of Sports. US: Routledge.
Tim McGarry, Peter O'Donoghue, António Jaime de Eira Sampaio. (2013). Routledge Handbook of
Sports Performance Analysis. US: Routledge.
William N. Taylor, M.D. (2002). Anabolic Steroids and the Athlete, 2d ed. Farland: McFarland.
World Health Organization (WHO). (2008). Waist circumference and waist-to-hip ratio. Geneva: Report of a WHO Expert Consultation WHO.
Yigal Pinchas. (2006). The Complete Holistic Guide to Working Out in the Gym. Canada: University of Calgary Press.
Yoko Goto, Hirohide Yokokawa,corresponding author Hiroshi Fukuda, Toshio Naito, Teruhiko Hisaoka, and Hiroshi Isonuma. (2015). Body mass index and waist circumference are independent risk factors for low vital capacity among Japanese participants of a health checkup: a single-institution cross-sectional study.
Environ Health Prev Med, 20(2), 108–115. doi: 10.1007/s12199-014-0431-5
Youlian Hong, Roger Bartlett. (2008). Routledge Handbook of Biomechanics and Human Movement
Science. US: Routledge.
Zahner, L. e. (2003). Les 12 elements de la reussite .concept de base de Swiss OlympicAssociation pour
l’encouragement de la releve. Swiss: Swiss Olympic.
Zerf Mohammed, Mokkedes Moulay idriss, Dani Hassiba. (2015). Impact of the Distribution Ratio Properties in the Evaluation of the Technique Triple Jump Theoretical Technique. International Journal of Novel
Research in Humanity and Social Sciences, 2(4), 1-15. Retrieved from www.noveltyjournals.com
View publication stats View publication stats