HAL Id: inserm-02913845
https://www.hal.inserm.fr/inserm-02913845
Submitted on 10 Aug 2020
HAL is a multi-disciplinary open access
archive for the deposit and dissemination of
sci-entific research documents, whether they are
pub-lished or not. The documents may come from
teaching and research institutions in France or
abroad, or from public or private research centers.
L’archive ouverte pluridisciplinaire HAL, est
destinée au dépôt et à la diffusion de documents
scientifiques de niveau recherche, publiés ou non,
émanant des établissements d’enseignement et de
recherche français ou étrangers, des laboratoires
publics ou privés.
Structural variations within proteins can be as large as
variations observed across their homologues
Iyanar Vetrivel, Alexandre de Brevern, Frédéric Cadet, Narayanaswamy
Srinivasan, Bernard Offmann
To cite this version:
Iyanar Vetrivel, Alexandre de Brevern, Frédéric Cadet, Narayanaswamy Srinivasan, Bernard Offmann.
Structural variations within proteins can be as large as variations observed across their homologues.
Biochimie, Elsevier, 2019, 167, pp.162-170. �10.1016/j.biochi.2019.09.013�. �inserm-02913845�
Preprint for publication in Biochimie
Structural variations within proteins can be as large
as variations observed across their homologues
Iyanar Vetrivel
a, Alexandre G. de Brevern
b, Frédéric Cadet
c,d,
Narayanaswamy Srinivasan
e, Bernard Offmann
a*a. Université de Nantes, UFIP UMR 6286 CNRS, UFR Sciences et Techniques, 2 chemin de la Houssinière, Nantes, France. b. INSERM UMR_S 1134, DSIMB team, Laboratory of Excellence, GR-Ex, Univ Paris Diderot, Univ Sorbonne Paris Cité, INTS, 6 rue Alexandre Cabanel, Paris, France.
c. INSERM UMR_S 1134, DSIMB team, Laboratory of Excellence, GR-Ex, Université de La Réunion, Faculty of Sciences and Technology, Saint Denis Cedex, La Réunion, France.
d. PEACCEL SAS, Paris, France
e. Molecular Biophysics Unit, Indian Institute of Science, Bangalore, India * Corresponding author. Email- bernard.offmann@univ-nantes.fr
Abstract:
Understanding the structural plasticity of proteins is key to understanding the intricacies of their functions and mechanistic basis. In the current study, we analyzed the available multiple crystal structures of the same protein for the structural differences. For this purpose we used an abstraction of protein structures referred as Protein Blocks (PBs) that was previously established. We also characterized the nature of the structural variations for a few proteins using molecular dynamics simulations. In both the cases, the structural variations were summarized in the form of substitution matrices of PBs. We show that certain conformational states are preferably replaced by other specific conformational states. Interestingly, these structural variations are highly similar to those previously observed across structures of homologous proteins (r2=0.923) or across the ensemble of conformations from NMR data (r2=0.919). Thus our study quantitatively shows that overall trends of structural changes in a given protein are nearly identical to the trends of structural differences that occur in the topologically equivalent positions in homologous proteins. Specific case studies are used to illustrate the nature of these structural variations.
Keywords:
Protein conformation, Protein structural variation, Structural alphabet, Molecular dynamics.
1. Introduction
Proteins exhibit a higher degree of structural conservation compared to sequence conservation1-4 as they require maintaining certain key residues in a specific orientation to fulfill their functional constraints5-9. Proteins are also known to be dynamic entities. Their intrinsic dynamic nature is encoded in the amino acid sequence itself as suggested by the high dynamics associated with certain intrinsically disordered proteins displaying compositional bias10. These conformational changes occur also due to natural events such as binding of a ligand and association with other proteins or nucleic acids
and
also due to thermodynamic fluctuations in proteins. Extrinsic factors like molecular packing in the crystal lattice, pH, temperature, pressure and crystallization conditions are also known to affect the protein conformation. There are several studies that document the dynamic nature of proteins11-15 contributed by one or more of these factors. The user friendly ConTemplate12 webserver takes as input a protein structure (or model) and proposes possible alternative conformations for the protein. The Protein Data Bank16 Flexibility (PDBFlex)13, Conformational Diversity of the Native State (CoDNaS)14 and Conformational Change Profile (CCProf)15 and studies document the structural variations in proteins sharing >=95%
sequence similarity. For the current study we focus only on proteins sharing exact (100%) sequence identity. The observed structural changes in this dataset may be caused by diverse factors. Considered collectively, multiple structural entries for a given protein represent stable (crystallizable) conformers and they represent the extent of structural diversity possible in a protein irrespective of the factor causing the structural change.
In this work, inspired by the availability of CoDNaS resource, we studied the local structural changes observed over a large collection of alternate crystal structures of the same protein using Protein Blocks (PBs), a structural alphabet. Protein Blocks are a 16 state classification of pentapeptide fragments that can abstract any part of a protein backbone structure17-18. The versatility of PBs to abstract protein structures have been exploited for diverse applications: to predict protein structure19-21, in fold recognition22,23, for structural motif identification24-26, molecular dynamics trajectory analysis 27,28 etc.39 Furthermore, PBs have been shown to be convenient in identifying local structural variations in proteins29,30. It is also effective in differentiating between structurally variable and conserved regions in protein structures31,32. The relationship between this PB based metric and the conventionally used root mean squared deviation (RMSD) have been extensively presented and discussed in other studies29,31. Previously, non PB based studies have been undertaken to analyze structural variations in homologous proteins using normal mode analysis33 and Gaussian network approach34,35 and also structural variations inherent to proteins36. The novelty of our current work lies in analyzing the structural variations occurring within a set proteins and to compare them with those occurring between their respective homologues. PBs have been used to characterize the nature of the structural variations observed across structures of homologous proteins32,29 and conformers from NMR ensembles30. From these analyses, two PB substitution matrices were derived. One PB substitution matrix summarizes the local structure variations occurring between structurally equivalent regions across homologous structures and another between alternate NMR models. The comparison of the two matrices showed a high degree of similarity in the nature of structural variations at play in these two contexts.
In this work, we extended this analysis by investigating the nature of the structural variations observed between conformers of the same protein derived from multiple crystallographic instances and from conformations explored during molecular dynamics simulations. Inherent to the nature of these datasets, these structural variations are not drastic but the structural variations that do occur in the protein backbone, are statistically very similar to those observed across homologous structures or across models from NMR experiments.We summarized these structural variations in the form of two additional substitution matrices and investigated how they relate to the matrices established previously29-32.
2. Materials and Methods 2.1 Datasets
To analyze the structural variations across multiple entries of the same protein in the PDB16, all protein chains were considered independently. If a PDB entry has 2 identical protein chains (e.g a homodimer), some structural variations could be observed between them, hence justifying they are considered separately. All the 250,000 protein chains available in the PDB at the time of the study were clustered at 100% sequence identity using the BLASTClust algorithm38. This resulted in 56,829 clusters of identical protein chains with the largest cluster being the one with the capsid protein of HIV-1 with 2,580 chains. These are viral capsid proteins in multimeric forms that were solved by different research groups. Out of these 56,829 clusters, singletons were not kept since a minimum of two structures in a cluster is needed in order to study their structural variability. Further our study focuses only on structures solved by X-ray crystallography with a resolution of 2.5 Å or better. Protein chains with chain breaks were also removed. After this filtering process we were left with a total of 254,979 protein chains distributed in 23,631 clusters. From this dataset, a total of 7.8 million pairwise comparisons were performed. For example, in a cluster with n=30 protein chains, we made a total of 435 (i.e. (n*(n-1))/2) pairwise comparisons .
2.2 Protein Blocks
Protein Blocks are a library of 16 backbone conformational states (structural alphabet) denoted by the letters a to p. The orientation of the backbone atoms in any five consecutive residues in a protein structure can be defined by a series of 8 torsion angles (φ,ψ). PBs are defined by 16 sets of these 8 torsion angles. This standard library of torsion angles were determined by unsupervised clustering of the torsion angles from a non-redundant set of proteins17. Parsing a protein structure through a sliding window of 5 residues enables abstraction of the backbone 3D structure into 1D string of PBs. The PBE-T (Protein Block Transform) tool available on the PBE (Protein Blocks Expert) web-server (http://www.bo-protscience.fr/pbe/?page_id=10) can be used to encode protein structures into PB sequences37. There are many advantages to approximating protein backbone conformation using PBs and a number of applications have been developed based on PBs39.
2.3 Molecular dynamics
A collection of 130 structures of unrelated proteins were subjected to molecular dynamics simulation using the GROMACS40 program for a duration of 10 ns each. These proteins shared less than 30% sequence identity with one another, were single chain proteins with no chain breaks and no ligands bound. Further structural criteria imposed were a
X-ray crystallographic resolution better than 1.75 Å, R-factor <0.18 and free R-factor <0.24. The simulations were carried out in NPT conditions using the Amber99SB-ILDN force field with TIP3P water model at 300K temperature and 1 atm pressure. The leapfrog integrator was used with the timestep set as 2 fs. Periodic conditions were applied. Global charge was neutralized to 0.15 mol/L with Na+ and Cl- ions.
2.4 Generating the matrices
Structures of 254,979 protein chains in our data set were represented as sequences of PBs using an in-house Perl script. Multiple structural entries of the same protein represented as PB sequences were compared in an all-vs-all fashion. PB sequences that constituted our dataset are provided in supplementary material S4. To ensure only structurally equivalent regions of both the proteins were being compared, the missing residues at the N-terminal and C-terminal were adjusted by introducing appropriate number of gaps to the shorter sequence. The PB variations from these 7.8 million pairwise comparisons were cumulated and used to populate a 16 X 16 variation matrix. Henceforth this matrix is referred to as the
altconfMAT because it summarizes the alternate conformations of crystallographic structures.
An equivalent 16 x 16 matrix was constructed that summaries the PB change between snapshots during the MD simulation. Out of the 10 ns simulation, the first 5 ns were not taken into consideration for the analysis to allow for the system to stabilize. Coordinates of the protein structure were written out after every 250 ps. Hence we get 19 sets of coordinates for each of the 130 simulations. These coordinates were converted into PB sequences exactly in the same manner as described before. Similarly, the corresponding PB sequences that constituted this dataset are provided in supplementary material S4. The PB variations among these PB sequences were used to populate the second PB variation matrix, henceforth called the
dynamicsMAT.
Since all the 16 PBs do not occur in the same frequency in protein structures, the matrices so obtained needs to be normalized. As described previously29,30, the normalization was carried out as per the procedure described by Johnson and Overington41 (Eqn. 1). Sx,y is the normalized score for variation of PB x to y, Nx,y is the raw count of PB x varying to PB y
and M is the total number of PBs i.e. 16.
In the dynamicsMAT dataset there were no PB n ↔ PB d changes observed, hence in order to avoid undefined values during the normalization process, the value was changed from 0 to a nominal value of 0.0001. This value was chosen to be lower than the lowest observed value in the matrix.
3. Results and Discussion
3.1 Inferences from qualitative analysis of structural plasticity
Previously, backbone structural differences, as inferred from Protein Block (PB) variations observed among models in NMR ensembles of large number of NMR structures of proteins were compared to the structural differences observed in topologically equivalent regions of homologous protein structures30. The cumulated normalized frequencies of PB variations in NMR ensembles and homologous protein structures were represented as matrices referred to as NMRMAT and
homologueMAT respectively. The Pearson correlation coefficient between the two matrices (0.92) suggested an excellent
correlation30. We were interested to see how the newly established PB variation matrices, altconfMAT and dynamicsMAT (see section 2.4), related to the previously established NMRMAT and the homologueMAT matrices.
The correlations between each of these matrices are summarized in Table 1. All the correlation coefficient values are quite high with lowest value of about 0.87. This means backbone conformational variations observed in the same proteins in different crystal structures, variations observed during molecular dynamics simulations, variations among the models in NMR ensembles and differences observed in topologically equivalent positions in homologous protein structures are all well correlated with one another. The best correlation is between NMRMAT and homologueMAT matrices. All the other matrices show similar correlation values with the lowest correlation coefficient between NMRMAT and dynamicsMAT matrices (r2=0.87). A finding from our work is that, overall, the backbone structural variations due to dynamics and structural differences between homologues are highly similar. Furthermore, to ascertain that these correlations are not an artifact of the non-variant PBs occuring in the diagonals of these matrices, we recalculated the correlations excluding the diagonals. These results show a slight reduction in the correlation but very similar trends hence indicating that the bias brought about by the non-variant PBs is minimal.
Table 1: Correlation among the three PB variation matrices (NMRMAT30, altconfMAT, dynamicsMAT) and the PB transition matrix (homologueMAT29). The values in the brackets are the correlations calculated by excluding the non-variant (diagonal) PBs.
homologueMAT NMRMAT altconfMAT dynamicsMAT homologueMAT 1 NMRMAT 0.945 (0.921) 1 altconfMAT 0.923 (0.908) 0.919 (0.850) 1
dynamicsMAT 0.910 (0.864) 0.872 (0.787) 0.922 (0.885) 1
Torsion angles of the PBs are organized in such a way that specific PBs have a higher predisposition to be present in certain secondary structure elements (SSE). PBs a, b and c correspond to the N-terminal capping regions of β-strands, PB d corresponds to the geometry of β-strand central regions, PBs e and f to C-terminal caps of β-strands. The counterparts for the helices are PBs k and l for the N-terminal caps, PB m for the central region and PBs n, o and p for the C-terminal caps. PBs g, h, i and j represent the loop regions. Therefore, as expected, PBs representing the ends of the spectrum namely PBs
m and d show the least structural variation. This is represented by Figure 1’s rows (or columns) of PB m and PB d having
the highest shades of red in the heat map. This pattern is consistent across all the four matrices. Apart from the PBs m and d, the PB f and PB k are highly represented in the top five invariant PBs. They represent the C-terminal of β-strands and N-terminal of helices respectively. The PBs g, j, b, h and i are highly represented in the top 5 varying PBs across all the four matrices. PB b is the exception in this list as it typically corresponds to the N-terminal cap of β-strands whereas the other PBs correspond to the loop regions.
Figure 1. Tri colored heat maps of the four substitution matrices. (a) altconfMAT. (b) dynamicsMAT. (c) homologueMAT. (d) NMRMAT.
3.2 Inferences from quantitative analysis of structural plasticity
All the 4 matrices are symmetric across the diagonal. Diagonal elements represent extent of retention of PBs and the off diagonal values correspond to PB substitutions. The proportion of the sum of the raw counts of off-diagonal elements to the sum of all the raw counts of the matrix reflects the amount of structural variability captured by that particular matrix. For the altconfMAT this value is 4.88% and it is 7.04% for the dynamicsMAT matrix. The sum of the values of a row in the normalized matrix is a measure of how favorable or unfavorable the particular PB is to structural variations. The more negative this value is, the more resistant that particular PB is to structural variations (see supplementary material S1 for
individual PB values for all the four matrices). PBs m and d often correspond to the central regions of α-helices and β-sheets respectively (92% and 75% of -helix and -sheet respectively18). The extent to which PBs m and d are refractory to structural variation are very comparable in the altconfMAT and dynamicsMAT. However, this is not the case for the previously established matrices- the NMRMAT and the homologueMAT. In both these cases, PB m is significantly better retained than PB d.
Once it is established that the central regions of the regular Secondary Structural Elements (SSE), α-helix and β-sheet, are mainly structurally invariant, we now focus on the loop regions and the interface of loop and SSE. In the altconfMAT matrix, this amounts to 78.2% of the structural variations out of which 64.3% are from the capping regions of the SSEs. In the case of dynamicsMAT, 65.9% of the variations are from the capping regions and this value increases to 79.4% if the loop regions are included (see Supplementary materials S2 for a more detailed break-up of which regions contribute to the variations). It must be noticed that the distribution of PBs in the central regions of SSEs, capping regions of SSEs and the loop regions are not absolute. For example, although the PBs g, h, i and j represent the loop regions we can occasionally find other PBs in the loop regions as well.
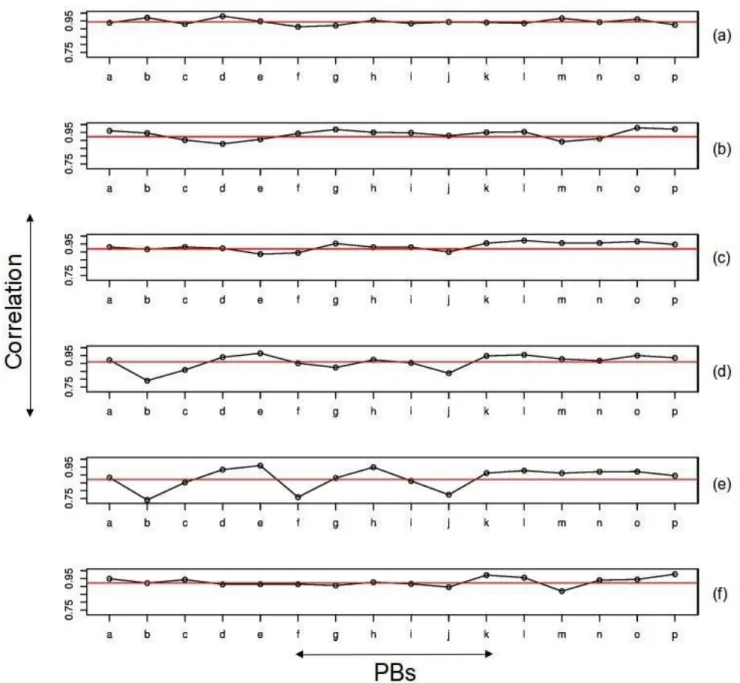
The correlation coefficients listed in Table 1 are overall values for all the 16 PBs. They can hide differences in correlation at the individual PB level. Hence we decided to calculate the individual PB wise correlation between these four matrices. Figure 2 is a plot of these PB-wise correlations. In each case the red line corresponds to the overall correlation, the points above contribute positively to the correlation and the ones below negatively. The NMRMAT vs dynamicsMAT PB wise correlation shows the maximum dispersion.
Figure 2. Individual PB wise correlation between the four matrices.
(a) homologueMAT vs NMRMAT (b) homologueMAT vs altconfMAT, (c) NMRMAT vs altconfMAT, (d) homologueMAT vs
dynamicsMAT, (e) NMRMAT vs dynamicsMAT, (f) altconfMAT vs dynamicsMAT. The global correlation values in Table 1
are represented by the horizontal red lines. Points above this line contribute positively to the correlation and the ones below negatively.
3.3 Case study of structural variations in alternate conformations of the same protein
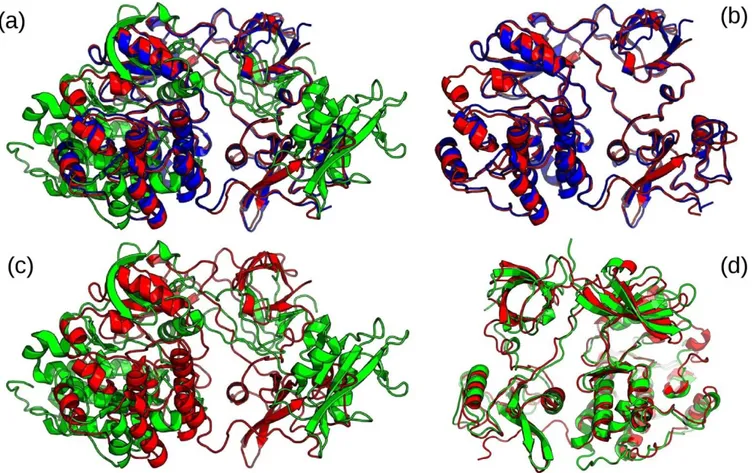
Implications of different functional states or conformational changes potentially induced by ligand binding on the backbone conformational variations in a given protein were analyzed. The cluster we get from BLASTClust filtered at 100% sequence identity for human tyrosine kinase consists of three structures (PDBID: 2SRC42, 1Y5743, 1FMK44). Their superimposition featured in Figure 3 clearly shows that there are large structural variations that are induced upon binding to MPZ ligand.
Figure 3. Comparison between 3 structures of human tyrosine kinase C-SRC by rigid body & flexible superimposition.
Shown in blue is the unbound form (PDBID 1FMK)44, in red is the conformation (PDBID 2SRC) when it binds to phosphoaminophosphonic acid adenylate ester (ANP)42 and in green is bound form to MPZ ligand (PDBID 1Y57)43. Ligands are not shown for clarity. (a) Shown is the rigid body superimposition of the 3 structures. (b) Shown is the rigid body pairwise superimposition between 2SRC and 1FMK with a calculated RMSD of 0.8 Å. (c) Shown is the rigid body pairwise superimposition between 2SRC and 1Y57 with a calculated RMSD of 21.0 Å. (d) Shown is the pairwise flexible superimposition between 2SRC and 1Y57 after introducing a twist at position 259 using FATCAT that resulted into a calculated RMSD of 2.7 Å.
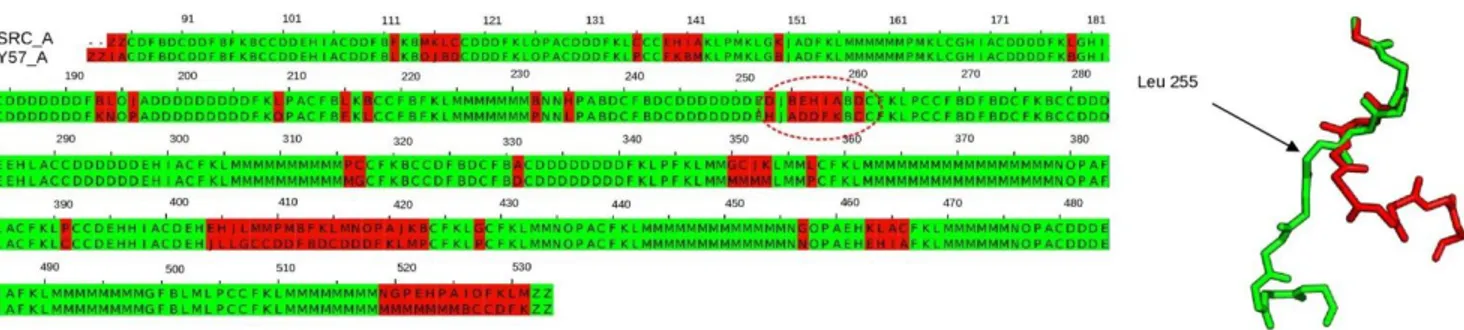
These are further compared using protein blocks below. Figure 4 shows the PB alignment between the structures of human tyrosine kinase C-SRC bound to ANP ligand (PDBID 2SRC) and to MPZ ligand (PDBID 1Y57). The regions marked in red are the regions that show structural changes based on PBs. A total of 75 out of the 452 PBs variations are observed. Rigid body superposition of the two structures using the ProFit45 software (http://www.bioinf.org.uk/software/profit/) results in a high RMSD of 21.3 Å (Figure 3c). When the same two structures are aligned flexibly using the FATCAT program46 the RMSD reduces to 2.7 Å (Figure 3d). This was achieved by the FATCAT algorithm46 by introducing a twist located at residue 259. Indeed, in this region PB sequence between the two structures showed a major difference with a twist at residue Leucine 255, here PBs behiaare aligned with PBs addfk (Figure 4). When the same structure is compared with the ligand unbound form (PDBID 1FMK) 68 PBs show variation and most importantly the region of the twist shows only one PB change as opposed to 5 PB changes in the previous case (Figure 5).
Figure 4. PB alignment between two structures of human tyrosine kinase C-SRC bound to ANP ligand (PDB ID 2SRC) and MPZ ligand (PDB ID 1Y57) captured by altconfMAT matrix.
Shown is alignment of chain A for both structures. The region responsible for the high RMSD value calculated after rigid superimposition is circled in red. This region displays drastic PB variations that reflect a major twist in the backbone at the level of leucine 255.
Figure 5. PB alignment between two structures of human tyrosine kinase C-SRC in the unbound form (PDB ID 1FMK) and bound with ANP ligand (PDB ID 2SRC).
This is an example of structural variation captured by altconfMAT matrix. Shown is alignment of chain A for both structures. The region featured in Figure 10 is again circled here. This region displays minor PB variations that reflect very little change in the backbone conformation in this region.
Figure 6 shows the structure of a mutant amidase from Geobacillus pallidus (PDBID 4LF0)47 at the end of 5 and 10 ns of a molecular dynamics simulation. The regions marked in red are the regions that show structural changes between these two states. In this case 25 out of 340 PBs showed variations. In both the cases, the PBs corresponding to the capping regions of secondary structural elements and loop regions are highly represented. The logical succession to this work would be to characterize the structural changes during a molecular dynamics simulation at different time steps.
Furthermore, when we consider the above examples of tyrosine kinase and amidase and compare them
to their respective 95% sequence homologues, we see similar PB substitutions between them. The
frequently occurring PB l ↔ b variation in alternate structures of tyrosine kinase (8 instances) are also
seen between their homologues (5 instances). There are also three instances of PB l ↔ b variation each
for alternate structures vs. homologues of amidase, hence indicating a correlation in structural
Figure 6. Example of the structural variation captured by dynamicsMAT matrix after 5 and 10 ns MD simulations. Shown is the PB variations observed in an amidase (PDB ID 4LF0) after 5 and 10 ns MD simulations. On the left is the cartoon representation of the x-ray structure and on the right are its corresponding PB sequences after 5 and 10 ns MD simulation. The regions marked in red represent structurally varying regions between the two structures extracted at these simulation times.
3.4 Case study of structural variations between two homologous proteins having alternate conformations
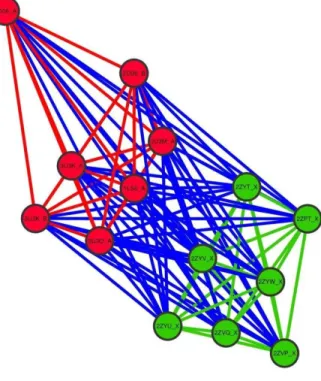
Implications of backbone conformational variations in a given protein on the perceived structural differences between homologous proteins were analyzed in this case study. In this analysis we used PB-ALIGN31 to compare two homologous proteins each having multiple alternate conformations. The main results are featured in the form of network (Figure 7). The cluster in red corresponds to alternate structures of human sulfotransferase and the ones in green are various conformational states of the homologue from mouse. All the members of a single group share 100% sequence identity but inter group members share 59% sequence identity. The edges in red and green represent intra-group alignments and the blue edges are inter-group alignments. The alignment scores were normalized by length. In all cases the edge length corresponds to the normalized alignment scores, higher alignment scores correspond to shorter edges. Global distribution of the normalized alignment scores are featured in (Figure 8).
Figure 7. Network showing structural (dis)similarity between mouse and human sulfotransferases each having multiple alternate conformations.
The red nodes are the group of human sulfotransferase structures while the green nodes represent the group of mouse structures. Intragroup alignments are colored in red and green respectively. Intergroup alignments are colored in blue. Distance between nodes are inversely proportional to the normalized alignment scores. Intragroup distances for the mouse sulfotransferases are lower than any intergroup distance. Some of the intragroup distances for the human sulfotransferases are greater than some its intergroup distances.
Figure 8. Distribution of PB-ALIGN normalized alignment scores.
On the left is the distribution of the normalized alignment scores for the mouse sulfotransferase structures group. On the right is the distribution of the normalized alignment scores for the human sulfotransferase structures group. In red are the inter group normalized alignment scores. In green are intra group alignment scores. Intragroup scores for the mouse sulfotransferases are higher than any of its intergroup scores. Intragroup scores for the human sulfotransferases show some overlap with some of its intergroup scores. This overlap is indicated in blue in the histogram on the left.
The closest inter group structures (PDB ID 1LS6 chain A and PDBID 2ZYV chain X) have a normalized alignment score of 1.83 and the farthest pair (PDB ID 2D06 chain A and PDB ID 2ZVP chain X) have 1.65. Their corresponding all atom superposition RMSDs are 0.40 Å and 0.46 Å, respectively. The difference in normalized alignment score (0.177) and RMSD (0.06 Å) seem to be minor but it is noteworthy that this variability is seen in homologues sharing a high sequence identity of almost 60%. We can expect this variability effect to be more pronounced in homologues sharing much lower sequence identity and also when the sizes of the groups are larger. More importantly, as shown in Figure 7, taking one conformation of the human sulfotransferase as a reference (PDB ID 1LS6 chain A), it can be seen that a mouse sulfotransferase (PDB ID 2ZYV chain X) conformation is strikingly more structurally similar to it than another conformation of the same human sulfotransferase (PDB ID 2D06 chain A).
4. Conclusions
We showed that the backbone structural differences, represented as Protein Blocks (PBs) observed in the data set of multiple crystal structures of a given protein are remarkably similar to the structural differences between the homologous protein structures. In other words, overall trends observed in structural changes in a given protein are nearly identical to the trends of structural differences that occur in the topologically equivalent positions in homologous proteins. Different PBs in topologically equivalent positions in two homologous proteins can be characterized by high exchange frequency. Therefore, if one considers the fact that the easily exchangeable PBs within a protein and between the homologous proteins are nearly the same, it could be inferred that backbone structures of homologous proteins are more similar than previously thought. This also means that upon superposition of two homologous proteins, two residues which are not found to be topologically equivalent, maybe topologically equivalent if different crystal structures of the homologues are superimposed.
Our analysis of comparison two homologous protein structures by considering all multiple crystal structures available for the two homologues shows that the extent of structural variability within a protein can be similar to the extent of structural differences between the homologues. Indeed we have shown that structural similarity measure among multiple crystal forms of a given protein can be less than the structural similarity measure between the protein under study and its homologue. Therefore if one considers conformational changes intrinsic and extrinsic in two homologous proteins, it appears that homologous protein structures more closely resemble each other than what one might infer based only on comparing one of
the conformers of each of the two homologues. Therefore, a more complete understanding of how similar the structures of two homologues is arrived at by considering multiple crystal structures of same two proteins.
Molecular dynamics simulation and models from NMR ensembles seem to capture different aspects of protein structural dynamics, as indicated by the lowest correlation between the dynamicsMAT and NMRMAT, see Table 1.
Acknowledgement
The authors are thankful to Dr. Swapnil Mahajan and Lionel Hoffmann for valuable discussions on PB substitution matrix and help with MD simulations respectively.
Funding
This work was supported by the Région Réunion and the Fond Social Européen, in the form of a PhD. grant [grant no.20131528] to IV. This work was in part supported by Conseil Regional des Pays de la Loire in the framework of GRIOTE project. AdB and FC acknowledge grants from the Ministry of Research (France), National Institute for Blood Transfusion (INTS, France), National Institute for Health and Medical Research (INSERM, France) and labex GR-Ex. The labex GR-Ex, reference ANR-11-LABX-0051 is funded by the program “Investissements d’avenir” of the French National Research Agency, reference ANR-11-IDEX-0005-02. AdB acknowledge supports by University Paris Diderot, Sorbonne, Paris Cité (France), FC acknowledge supports by Université de La Réunion, Faculty of Sciences and Technology. NS and AdB acknowledge to Indo-French Centre for the Promotion of Advanced Research / CEFIPRA for collaborative grant (number 5302-2). Research in NS laboratory is also supported by Department of Biotechnology, Government of India. NS is a J.C. Bose National Fellow.
References
1.
Chothia C, and Lesk AM. The Relation between the Divergence of Sequence and Structure in Proteins. The EMBOJournal 1986;5 (4): 823–26.
2.
Bashford D, Chothia C, and Lesk AM. Determinants of a Protein Fold. Unique Features of the Globin Amino Acid Sequences. J Mol Biol 1987;196(1):199–216.3.
Bowie J, Reidhaar-Olson J, Lim W, and Sauer R. Deciphering the Message in Protein Sequences: Tolerance to Amino Acid Substitutions. Science 1990;247 (4948): 1306–1310.4.
Hark Gan H, Perlow RA, Roy S, Ko J, Wu M, Huang J, Yan S, et al. Analysis of Protein Sequence/Structure Similarity Relationships. Biophysical Journal 2002; 83 (5): 2781–91.5.
Nagl SB, Freeman J, and Smith TF. Evolutionary Constraint Networks in Ligand-Binding Domains: An Information-Theoretic Approach. Pacific Symposium on Biocomputing, 1999;90–101.6.
Lecomte J, Vuletich DA, and Lesk AM. Structural Divergence and Distant Relationships in Proteins: Evolution of the Globins. Current Opinion in Structural Biology 2005;15 (3): 290–301.7.
Dessailly BH, Lensink MF, and Wodak SJ. Relating Destabilizing Regions to Known Functional Sites in Proteins.BMC Bioinformatics 2007; 8 (1): 141.
8.
Najmanovich R, Kurbatova N, and Thornton J. Detection of 3D Atomic Similarities and Their Use in the Discrimination of Small Molecule Protein-Binding Sites. Bioinformatics 2008; 24 (16): i105–111.9.
Saldaño TE, Monzon AM, Parisi G, and Fernandez-Alberti S. Evolutionary Conserved Positions Define Protein Conformational Diversity. PLOS Computational Biology 2016;12 (3): e1004775.10. Hansen JC, Lu X, Ross ED, and Woody RD. Intrinsic Protein Disorder, Amino Acid Composition, and Histone
Terminal Domains. The Journal of Biological Chemistry 2006;281 (4): 1853–1856.11. Gerstein M, Lesk AM, and Chothia C. Structural Mechanisms for Domain Movements in Proteins. Biochemistry
1994;33 (22): 6739–49.12. Narunsky A, Nepomnyachiy S, Ashkenazy H, Kolodny R, & Ben-Tal N. ConTemplate
Suggests Possible Alternative Conformations for a Query Protein of Known Structure. Structure
2005; 23(11): 2162–2170.
13. Hrabe T, Li Z, Sedova M, Rotkiewicz P, Jaroszewski L, & Godzik A. PDBFlex: exploring
flexibility in protein structures. Nucleic Acids Research 2016; 44(D1): D423-428.
14. Monzon AM, Rohr CO, Fornasari MS, & Parisi G. CoDNaS 2.0: a comprehensive database of
protein conformational diversity in the native state. Database 2016; baw038.
15. Chang C-W, Chou C-W, & Chang DT-H. CCProf: exploring conformational change profile of
proteins. Database 2016; baw029
16. Rose PW, Prlić A, Bi C, Bluhm WF, Christie CH, Dutta S, Green RK, et al. The RCSB Protein Data Bank: Views
of Structural Biology for Basic and Applied Research and Education. Nucleic Acids Research 2015;43 (Database issue): D345–356.17. de Brevern AG, Etchebest C, and Hazout S. Bayesian Probabilistic Approach for Predicting Backbone. Proteins
2000; 287: 271–287.18. de Brevern AG. New Assessment of a Structural Alphabet. In Silico Biology 2005;5 (3):283–89.
19. de Brevern, A. G., Benros, C., Gautier, R., Valadié, H., Hazout, S., & Etchebest, C. (2004). Local
backbone structure prediction of proteins. In Silico Biology, 4(3), 381–386.
20. Suresh, V., & Parthasarathy, S. (2014). SVM-PB-Pred: SVM based protein block prediction
method using sequence profiles and secondary structures. Protein and Peptide Letters, 21(8), 736–
742.
21. Vetrivel, I., Mahajan, S., Tyagi, M., Hoffmann, L., Sanejouand, Y. H., Srinivasan, N., de Brevern,
A. G., Cadet F., Offmann, B. (2017). Knowledge-based prediction of protein backbone
conformation using a structural alphabet. PLoS ONE, 12(11), 1–20.
22. Ghouzam, Y., Postic, G., de Brevern, A. G., & Gelly, J.-C. (2015). Improving protein fold
recognition with hybrid profiles combining sequence and structure evolution. Bioinformatics,
(August), btv462.
23. Mahajan, S., de Brevern, A. G., Sanejouand, Y.-H., Srinivasan, N., & Offmann, B. (2015). Use of
a structural alphabet to find compatible folds for amino acid sequences. Protein Science, 24, 145–
153.
24. Dudev, M., & Lim, C. (2007). Discovering structural motifs using a structural alphabet:
application to magnesium-binding sites. BMC Bioinformatics, 8, 106.
25. Schneider, B., Cerný, J., Svozil, D., Cech, P., Gelly, J.-C., & de Brevern, A. G. (2014).
Bioinformatic analysis of the protein/DNA interface. Nucleic Acids Research, 42(5), 3381–3394.
26. Wu, C. Y., Chen, Y. C., & Lim, C. (2010). A structural-alphabet-based strategy for finding
structural motifs across protein families. Nucleic Acids Research, 38(14), e150.
27. Barnoud, J., Santuz, H., Craveur, P., Joseph, A. P., Jallu, V., de Brevern, A. G., & Poulain, P.
(2017). PBxplore: a tool to analyze local protein structure and deformability with Protein Blocks.
PeerJ, 5, e4013.
28. Vetrivel, I., Hoffmann, L., Guegan, S., Offmann, B., & Laurent, A. D. (2019). PBmapclust:
Mapping and Clustering the Protein Conformational Space Using a Structural Alphabet.
Workshop on Molecular Graphics and Visual Analysis of Molecular Data. The Eurographics
Association.
29. Tyagi M, Gowri VS, Srinivasan N, de Brevern AG, and Offmann B. A Substitution Matrix for Structural Alphabet
Based on Structural Alignment of Homologous Proteins and Its Applications. Proteins 2006;39: 32–39.30. Mahajan S, de Brevern AG, Offmann B, and Srinivasan N. Correlation between Local Structural Dynamics of
Proteins Inferred from NMR Ensembles and Evolutionary Dynamics of Homologues of Known Structure. Journalof Biomolecular Structure & Dynamics 2014;32 (5): 751–758.
31. Tyagi M, de Brevern AG, Srinivasan N, and Offmann B. Protein Structure Mining Using a Structural Alphabet.
Proteins 2008;71 (2): 920–37.