HAL Id: hal-02384175
https://hal.archives-ouvertes.fr/hal-02384175
Submitted on 28 Nov 2019
HAL is a multi-disciplinary open access
archive for the deposit and dissemination of
sci-entific research documents, whether they are
pub-lished or not. The documents may come from
teaching and research institutions in France or
abroad, or from public or private research centers.
L’archive ouverte pluridisciplinaire HAL, est
destinée au dépôt et à la diffusion de documents
scientifiques de niveau recherche, publiés ou non,
émanant des établissements d’enseignement et de
recherche français ou étrangers, des laboratoires
publics ou privés.
Intermediate band in the gap of photosensitive hybrid
gel based on titanium oxide: role of coordinated ligands
during photoreduction
Thomas Cottineau, Annabelle Rouet, Vincent Fernandez, Luc Brohan,
Mireille Richard-Plouet
To cite this version:
Thomas Cottineau, Annabelle Rouet, Vincent Fernandez, Luc Brohan, Mireille Richard-Plouet.
In-termediate band in the gap of photosensitive hybrid gel based on titanium oxide: role of coordinated
ligands during photoreduction. Journal of Materials Chemistry A, Royal Society of Chemistry, 2014,
2 (29), pp.11499-11508. �10.1039/c4ta02127d�. �hal-02384175�
Journal Name
Cite this: DOI: 10.1039/c0xx00000x
www.rsc.org/xxxxxx
Dynamic Article Links
►
ARTICLE TYPE
This journal is © The Royal Society of Chemistry [year] [journal], [year], [vol], 00–00 | 1
Intermediate Band in the Gap of Photosensitive Hybrid Gel Based on
Titanium Oxide: Role of Coordinated Ligands During Photoreduction.
†
Thomas Cottineau,*
a,bAnnabelle Rouet,
a,cVincent Fernandez,
aLuc Brohan
aand Mireille
Richard-Plouet*
,aReceived (in XXX, XXX) Xth XXXXXXXXX 20XX, Accepted Xth XXXXXXXXX 20XX 5
DOI: 10.1039/b000000x
UV light induced chemical modifications of a new hybrid organic-inorganic gel, based on titanium oxide and obtained by a soft chemistry method, are studied by XPS and UV-visible spectroscopy. XPS experiments, with an in situ UV illumination design, were performed in order to study the different chemical modifications of the gel. The Ti4+ to Ti3+ reduction, as well as the associated change in the
10
ligands coordinating titanium cations, are accompanied by a deprotonation of the molecules in the vicinity of the inorganic part. In the meantime, an intermediate band arises in the gap just below the Fermi level. The appearance of this band correlates with the light absorption properties of the gel as measured by UV-visible spectroscopy. Following on from these experiments, a complete band diagram of the electronic structure is proposed in order to clarify the position of this intermediate band. These distinctive properties
15
suggest that the nanostructured hybrid gel could be used as a new class of intermediate band material that can be synthesized at low cost for photovoltaic applications.
Introduction
Solar energy harvesting is one of the most interesting approaches towards fulfilling the need for a clean energy supply. It is an
20
inexhaustible, decentralized natural resource, and the solar power reaching the earth is far greater than actual energy consumption.1 Photovoltaic (PV) conversion requires a relatively low land occupation (e.g. compared to biomass) in order to convert solar energy into electricity, and should thus become a major source of
25
electricity.2 However, even though some PV systems are very efficient, the electricity produced generally remains more expensive than that produced by traditional technologies based on the use of fossil fuels. Future development of the PV industry therefore hinges upon the discovery of alternative, low-cost
30
materials and concepts that promote an increase in the efficiency of PV systems over and above the Queisser-Schokley limit of the p-n junction PV cell (max. efficiency ≈ 34%).3
Currently, several innovative concepts exist proposing the development of third-generation PV solar cells that can overcome
35
this limit, such as down- and up-conversion,4,5 multiple electron generation6 or a multijunction PV cell.7 The lattermost PV system holds the world record for conversion efficiency (44.4% under 300 suns)8 but its large-scale development is greatly limited by
the cost and complexity of device manufacture. Among these new
40
approaches we find the intermediate-band solar cell (IBSC), which is a device based on a single material that could absorb photons in different energy ranges while maintaining an elevated output voltage, in order to obtain a high level of efficiency.9 This concept is based on the presence of an intermediate band (IB) in
45
the gap of a semiconductor.10 In addition to the usual band gap
absorption, this intermediate band should permit the absorption of photons with an energy below the band gap, i.e. between the valence band (VB) and the IB, as well as between the IB and the conduction band (CB).
50
The first proposed approach for obtaining IB material systems was based on quantum dots of a small band gap material dispersed in the matrix of a large band gap semiconductor.11 Even though the concept of an intermediate band solar cell was confirmed (below ambient temperature), the cost associated with
55
the production methods of this system is considered to be too high for commercial development.12 Nowadays, a large part of the work in this domain is devoted to finding bulk IB materials.13 From ab initio studies, different materials with potentially high photovoltaic efficiency were identified,14 and different concepts
60
are proposed, such as semiconductor alloys,15 semiconductor superlattices16 or non-compensated n-p co-doping of large band gap semiconductors.17 Nevertheless, to the best of our knowledge, no clear evidence of the presence of an intermediate band was reported at room temperature, and the overall efficiency
65
of IB solar cells does not reach the expected high conversion yield.13 New materials and concepts have yet to be identified with
respect to this particular application.
Recent advances in nanomaterial synthesis offer smart options for innovative energy conversion and storage materials. In
70
particular, the development of hybrid organic-inorganic materials with distinctive properties that provide new prospects when integrated into PV devices.18 These materials blend the diversity and processability of organic molecules or polymers together with the favorable electronic and optoelectronic properties of
75
2 | Journal Name, [year], [vol], 00–00 This journal is © The Royal Society of Chemistry [year]
ratio of nanostructured materials leads to the predominance of surface states inducing enhanced photochemical effects that differ tremendously from their bulk counterparts.19,20 They also offer cost-efficient production prospects with respect to high-performance electronic and optoelectronic devices.
5
This study details the properties of a hybrid organic-inorganic gel, under UV illumination, which might be used as a new class of intermediate band material synthesized at low cost and at room temperature. This material is based on a nanostructured titanium oxide inorganic network in strong interaction with the
10
surrounding organic molecules. TiO2 nano-objects are already
used in various photochemical applications, such as photocatalysis,21 photoelectrochemical22 and PV solar cells.23 TiO2 provides an attractive option for green technologies due to
its natural abundance on earth, chemical stability and ease of
15
synthesis at low cost. However, due to a bandgap of 3.1 eV, it absorbs less than 5% of the solar spectrum.24 Our new synthesis method involves an inorganic reactant, as a precursor for Ti cations, that is hydrolyzed by an organic solvent such as N,N-dimethylformamide (DMF).25,26 Even though the formation
20
mechanism and the structural model of these sols and gels are known,27 the origin of their interesting properties under
illumination is not yet fully understood. Indeed, these sols and gels are photosensitive and become dark blue under UV illumination. EPR experiments indicate the reduction of Ti4+ to
25
Ti3+ which is accompanied by a change in the nature of the ligands around the Ti cations.28,29 Nevertheless, the role of the organic matrix in the sensitivity mechanism is still unclear. Here we present new XPS results obtained on the hybrid titanium oxide gel, and their evolution under in-situ UV illumination.
30
Experimental results indicate that photoinduced chemical modifications on the organic and inorganic parts of the gel generate an intermediate band within its band gap, just below the Fermi level. UV-visible absorption spectra of the gel, after photoinduced modification, are used to clarify the position of this
35
intermediate band.
Experimental
TiDMF gel synthesis
The hybrid sol and gel are synthesized using anhydrous N,N-dimethylformamide (noted DMF; (CH3)2NCHO, 99.8 %,
40
Aldrich) and the titanium oxychloride solution is stabilized in an acidic medium (TiOCl2•1.4HCl•7H2O, 4.85 mol L-1 in titanium,
Cristal Global). The sol is prepared by adding droplets of DMF (12 mL) to an ice-cooled TiOCl2 solution (5 mL) under
continuous stirring. The mixture is then stored in a closed
45
container at 70°C, and 24 hours later a transparent, waxy solid (denoted TiDMF gel) is obtained.
XPS with in situ UV illumination
XPS experiments were conducted on TiDMF gel which was deposited on a glass slide. In order to avoid analyzer
50
contamination due to massive desorption, the gel was deposited in the form of a thin layer (< 0.1 mm) on a surface of 5*5 mm2. The solvent part of the gel, unbound to the TiO2 network, is
evacuated in the pre-chamber in which the pressure decreases down to 5.10-5 Pa.
55
The XPS spectra were recorded on a Kratos Axis Ultra photoelectron spectrometer using a monochromatic Al Kα source (1486.6 eV) operating at 150 W. The pressure in the analysis chamber was always kept below 6.7.10-7 Pa. Due to the insulating nature of the sample, charge compensation was accomplished
60
using a low-energy electron flow gun. Survey spectra were measured from -2 to 1200 eV, using constant pass energy of 160 eV. High-resolution spectra of O 1s, Ti 2p3/2, N 1s, C 1s, and Cl
2p core level were recorded using a pass energy of 40 eV and a θ=0° take-off angle (angle between the surface normal and the
65
detection direction). Under the same conditions, the valence band was measured between 9 eV and -4 eV to take into account any charge neutralizer shift. With a pass energy equal to 160 and 40 eV, the spectral widening of the instrument measured on the silver Fermi edge was 1.9 and 0.55 eV respectively.
70
In order to achieve the in situ UV illumination, a UV led (Nichia) emitting at 375 nm with a 3.2 mW.cm-2
power density, at the sample position, was fixed below the glass slide, in the sample holder. Its polarization, with a 3.5 V voltage and 25 mA current, is ensured by the manipulator of the XPS apparatus. Such
75
a configuration allows us to illuminate the sample and control the illumination sequence during the acquisition procedure. Sequences of XPS measurements (30 minutes acquisition and 30 minutes illumination) were conducted for 70 h.
The angular dependence of the XPS signal of the different
80
elements was also studied by rotating the sample to θ = 30, 45, 60 and finally back to 0°, in order to check if any chemical modification was induced by the XPS measurement.
All high-resolution spectra were analyzed and fitted with CasaXPS.30 All spectra were calibrated to the binding energy of
85
adventitious carbon at 284.7 eV. All data were fitted using a Shirley function for the background and a pseudo-Voigt function with a Lorentzian ratio of 30% for the various peaks. All parameters were left free during fitting, except for the full widths at half maximum (FWHM) that were kept the same for the
90
different contributions of one element, and this FWHM value was fitted to minimize the refinement uncertainty.31
UV-visible spectroscopy
UV-visible spectra were recorded with a Varian Cary 5G spectrometer between 350 and 1600 nm, with a step of 1 nm. Due
95
to the strong visible absorption of the TiDMF gel, a homemade sample container was built for this experiment: the TiDMF fresh sol was introduced and sealed between two quartz glasses, separated by a spacer of Kapton tape, ensuring an optical pass of the gel of 145 ± 5 μm. The TiDMF sol to gel transformation was
100
done in situ in the cell by heating at 70°C for 24h. The obtained TiDMF gel sample was then exposed to a UV lamp (365 nm; 200 μW cm-2
) for different lengths of time before recording the data.
Results and discussion
TiDMF Sol and gel formation mechanism
105
The complete mechanism of titanium oxide sol and gel (hereafter denoted as TiDMF) formation, although already detailed in previous studies,25,27,32 will nevertheless be iterated below in
Journal Name
Cite this: DOI: 10.1039/c0xx00000x
www.rsc.org/xxxxxx
Dynamic Article Links
►
ARTICLE TYPE
This journal is © The Royal Society of Chemistry [year] [journal], [year], [vol], 00–00 | 3
Fig. 1 XPS spectra of TiDMF gel before (red) and after (blue) 34h of UV illumination. a) survey spectra and high-resolution spectra of b) Ti 2p3/2, c) O 1s,
d) C 1s, e) N 1s and Cl 2p. Black squares are the experimental data, and bold blue and red lines are the curve fitting results.
When mixing the titanium precursor (TiOCl2, 1.4 HCl, 7 H2O;
denoted as TiOCl2) with DMF, a double hydrolysis takes place:
5
(i) the dimethylformamide is hydrolyzed as dimethylammonium chloride (DMACl) and methanoic acid (HCOOH);33 (ii) the hydrolysis of the titanium precursor occurs via olation and oxalation reactions according to equation 1:34
(TiOCl2, 1.4 HCl, 7H2O) + 6.4 DMF →
10
(TiO2, zH2O)polymer + y DMACl + y HCOOH + (6.4-y) DMF +
(3.4-y) HCl + (6-y-z) H2O (1)
During this slow hydrolysis reaction, the inorganic clusters extend in a bi-dimensional polymeric form of hydrated titanium oxide network, which was determined by transmission electron
15
microscopy (TEM) and X-ray absorption spectroscopy (XAS) experiments.25 This polymerisation increases the viscosity of the sol. At the same time, part of the DMF enters into the Ti4+
coordination and is then hydrolyzed as DMACl and HCOOH, or more precisely as the methanoate group coordinating the Ti4+.
20
Taking into account the previous XAS results, XRD and TEM measurements, this allowed us to conclude that DMACl is located between the bi-dimensional titanium oxide layers.25 Once all the chlorides have been consumed and the TiDMF sol has turned into a gel, the expected formulation is (TiO2, zH2O)polymer, 3.4
25
DMACl, 3.4 HCOOH, 3 DMF, (2.6-z)H2O.
XPS with in-situ irradiation
The analysis was conducted using a modified sample holder that integrates a UV LED emitting at 375 nm for the purpose of
in-situ illumination. The sample is exposed to UV irradiation for a
30
total time of 34 hours and the XPS spectra are periodically recorded every 30 minutes. The chemical composition of the gel and its modifications under UV illumination can thus be monitored.
Before introducing the sample into the XPS analysis chamber,
35
the liquid phase is evacuated from the gel by maintaining the preparation in an ultra-high vacuum in the pre-chamber. The analysis is, therefore, conducted solely on the solid part of the photosensitive material, which is comprised of the inorganic titanium oxide network, as well as the surrounding molecules
40
interacting strongly with this inorganic part. These species were identified by Raman27 and 1H solid NMR spectroscopies (Suppl. Info. fig.S1), i.e. HCOO-, DMACl…
XPS peaks attribution
As expected, the different elements present in the gel could be
45
detected on the survey spectrum i.e. O, Ti, N, C and Cl (figure 1.a). The high-resolution spectra of Ti 2p3/2, O 1s, C 1s, N 1s and
Journal Name
Cite this: DOI: 10.1039/c0xx00000x
www.rsc.org/xxxxxx
Dynamic Article Links
►
ARTICLE TYPE
This journal is © The Royal Society of Chemistry [year] [journal], [year], [vol], 00–00 | 4
Table 1 Refinement of the various XPS peaks for a TiDMF gel of 1.42 mol.L-1 before and after in situ UV illumination for 34 h.
Core level Before illumination After illumination Attribution Position (eV) FWHM (eV) At. (%) Position (eV) FWHM (eV) At. (%)
O 1s 30.9 42.5 Oa 1s 530.2(1) 1.25(5) 49.6(5) 530.4(1) 1.26(5) 52.1(5) Ti-O-Ti36 Ob 1s 531.7(1) 1.26(5) 36.5(5) 531.9(1) 1.54(5) 32.2(5) Ti-O-C, 37 Ti-OH or Ti-OH 238 Oc 1s 532.4(1) 13.9(5) 532.6(1) 15.7(5) C=O39 Ti 2p3/2 8.7 13.9 Ti4+ 2p3/2 458.8(1) 1.21(5) 95.5(5) 459.0(1) 1.41(5) 75.3(5) Ti 4+ 35 Ti3+ 2p 3/2 457.2(1) 4.5(5) 457.4(1) 24.7(5) Ti3+ 35 N 1s 6.2 2.1 Na 1s 401.8(1) 1.45(5) 98.3(5) 402.1(1) 1.60(5) 53.9(5) DMACl41 Nb 1s 399.7(1) 1.7(5) 400.1(1) 46.1(5) DMA41 C 1s 46.1 36.6 Cp 1s 284.7(1) 1.24(5) 52.5(5) 284.7(1) 1.40(5) 62.0(5) Pollution Ca 1s 286.2(1) 31.4(5) 286.3(1) 14.7(5) DMACl40 Cb 1s 288.6(1) 16.1(5) 289.0(1) 23.3(5) C-O (methanoate)37 Cl 2p 8.1 4.9 Cl 2p1/2 199.5(1) 1.47(5) - 200.2(1) 1.38(5) - Cl 2p DMACl36 Cl 2p3/2 197.9(1) - 198.6(1) -
The overall atomic composition is in bold font, and the relative percentage of each atom is in normal font..
grouped together in figure 1. Positions, Full Width at Half Maximum (FWHM) and proportions of the different components, before and after illumination, are reported in table 1.
5
Before UV illumination, the Ti 2p3/2 peak at 458.8 ± 0.1 eV is
attributable to Ti4+ cations (figure 1.b).35 Due to ultra-high vacuum and/or incident X-ray beam during height adjustment, a small percentage of Ti cations are reduced to Ti3+ (less than 5%) and are visible as a shoulder located at 457.2 ± 0.1 eV. After 34
10
hours of UV illumination, up to 25% of the Ti4+ is reduced. The O 1s peak (figure 1.c) is decomposed into three components: one at 530.2 ± 0.1 eV (Oa), which is characteristic of
oxygen atoms belonging to the Ti-O framework36; and two
nearby components, Ob and Oc, located at 531.7 and 532.3 ± 0.1
15
eV, respectively. The binding energy of Ob is characteristic of
oxygen atoms involved in Ti-O-C-R bonds,37 such as carboxylate species, but also of an OH group or water molecule coordinating Ti cations.38 The higher binding energy of Oc is typical of oxygen
from O=C-R bonds that can be attributed to monodentate
20
HCOO-.39
Three components are required to fit the C 1s spectra presented in figure 1.d. The first component being the peak exhibiting the lowest binding energy, which is attributed to adventitious carbon and is calibrated to 284.7 eV (Cp). The second component, noted
25
Ca, at 286.2 ± 0.1 eV, is attributed to the carbon of DMACl.40 A
third component, Cb, located at 288.6 ± 0.1 eV is attributed to the
C atoms bonded to oxygen atoms. This lattermost peak is attributed to the methanoate (HCOO-) group coordinating Ti cations, as indicated by IR and Raman spectroscopies.25,27
30
Before illumination, nitrogen atoms mainly appear as one lone component (Na) located at 401.8 ± 0.1 eV, which is assigned to
dimethylammonium chloride (DMACl).41 The other component (Nb), the intensity of which increases with UV illumination time,
exhibits a smaller binding energy (399.7 ± 0.1 eV) and may be
35
attributed to nitrogen atoms related to the amine type, presumably dimethylamine (DMA), that can result from the equilibrium between DMACl and DMA:41
(CH3)2NH2+ + Cl- ↔ (CH3)2NH + HCl (2)
Chlorine atoms are detected as a single contribution typical for
40
Cl- and therefore in agreement with the presence of DMACl.
TiDMF gel composition
A formulation of the gel can be proposed from the intensities of the different components,according to the following procedure:
45
Na and Nb peak intensities indicate the quantity of DMACl and
DMA, respectively; the overall amount of methanoate is evaluated by the Cb 1s peak intensity; and the quantity of
monodentate HCOO- can be deduced from the Oc 1s peak area
corresponding to the oxygen of C=O bonds. The following
50
chemical formula can thus be proposed for the TiDMF gel sample before illumination (normalized for one Ti atom):
TiO1.75(HCOO)0.85 + 0.71 DMACl + 0.01 DMA + 0.08 Ob +
0.23 Ca + 0.22 Cl- (3)
The charge equilibrium between the titanium and the
55
coordinating ligand is not taken into account in this formula and will be discussed in detail in the next section. The Ti/methanoate ratio of 0.85 is fairly coherent with the result deduced from the liquid 1H NMR (1.0).27 Approximately half of these methanoate molecules are in a bidentate conformation. At this stage, DMACl
60
is predominant in the gel. It should be noted that 0.22 Cl-/Ti is present in excess and cannot be attributed to DMACl. The total amount of Cl- (0.93) is lower than the expected value of 3.4. This suggests that the dimethylammonium chloride may be partially decomposed (and evacuated under high vacuum) by the incident
65
This journal is © The Royal Society of Chemistry [year] Journal Name, [year], [vol], 00–00 | 5
Fig. 2 Evolution of the Ti 2p, O 1s, C 1s N 1s and Cl 2p composition of
the TiDMF gel under UV illumination.
adjustments of the experiment.
Considering the stoichiometry of the different components,
5
XPS results indicate an excess of Ca and Ob (0.23 and 0.08) that
could be linked to the adsorption of some organic residue on the surface, resulting from the degradation of methanoate, N,N-dimethyformamide or DMACl under electron and X-ray irradiation.
10
Using the same methodology, the following composition can be proposed at the end of the experiment, i.e. after 34h of UV illumination:
TiO1.59(HCOO)0.61 + 0.08 DMACl + 0.07 DMA + 0.23 Ob +
0.08 Ca + 0.27 Cl- (4)
15
In this case, the amount of methanoate is decreased by a third when compared to the beginning of the experiment, and the ratio of this methanoate in a bidentate conformation decreases to 22%. The quantity of DMACl also decreases, whereas an increase in the intensity of the Nb 1s peak attributed to dimethylamine is
20
observed. An excess of Ob 1s, Ca 1s and Cl 2p is measured when
compared to the determined amounts of methanoate, DMA and DMACl species respectively.
TiDMF gel evolution under illumination
In order to get more insight into the mechanisms involved in
25
these modifications, we studied the evolution of atomic composition during the in-situ illumination experiment (figure 2). The detailed elemental evolution of each contribution is presented in the supplementary information section (figure S3). During the first steps (t < 120 min.) of illumination, a rapid increase of the Ti
30
2p3/2 and O 1s peaks is observed, which is correlated to the
decrease of the N 1s, Cl 2p and C1s contributions. Regarding the carbon, the Cp and Ca contributions are mainly affected by UV
illumination, as presented in figure S3.b. This initial rapid evolution suggests a degradation of crystallized DMACl.
35
Angular-dependant XPS analysis was conducted in order to clarify the location of DMACl and its degradation mechanism. The results, detailed in the supplementary information section (figure S4), confirm that the DMACl is not homogeneously distributed within the thickness of the TiDMF gel, but is instead
40
largely crystallized at the very surface. It also confirms that DMACl is degraded under X-ray irradiation, generating
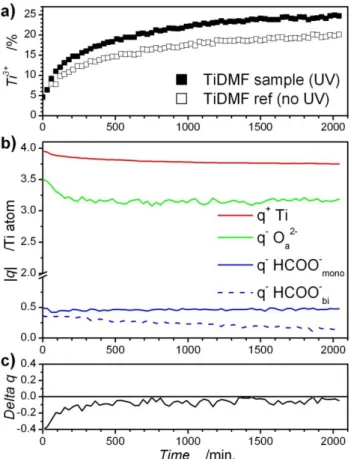
Fig. 3 Time evolution under UV of: a) percentage of Ti3+; b) charges
carried by Ti cations, O2-, HCOO- monodentate and bidentate (the charges
45
are normalized for 1 Ti cation); and c) charge balance between cationic and anionic species.
dimethylamine and HCl as dissociation products.
During UV illumination, the sample presents a blue coloration confirming that the photosensitivity of the gel is related to the
50
solid nanometric part of the gel and does not involve DMF, which is evacuated under vacuum. The evolution of the percentage of reduced Ti3+ titanium in relation to the illumination time is presented in figure 3.a. By way of comparison, the evolution of the Ti3+ percentage for a sample measured according to the same
55
protocol, but without UV illumination, is also presented. With regards to the sample exposed to UV, up to 25% of Ti4+ is reduced to Ti3+ after 34h of irradiation, whereas for the reference sample the reduction reaches 20%. One could conclude that only 5% of the reduction is induced by UV illumination, but in fact the
60
mechanism seems to be more complex: for a sample subjected to UV for 34h, but not exposed to the X-rays or electrons of the neutralizer, XPS measurement conducted just after the illumination indicates that 15% of the titanium was photoreduced. It should be noted that the Ti3+ formation under the influence of a
65
high vacuum can be excluded, since the ratio remains close to 5% for an area of the sample that is not exposed to UV, X-rays or electrons.
From the composition of the TiDMF gel, the charge balance in the inorganic part can be assessed. To this effect, an average
70
positive charge is calculated for one Ti cation in function of the ratio x of Ti3+ according to:
6 | Journal Name, [year], [vol], 00–00 This journal is © The Royal Society of Chemistry [year]
The negative charges of titanium cation ligands are calculated considering a charge of -2 for the Oa 1s atoms and -1 for
methanoates. The partial charges attributed to oxygen, methanoate and titanium (normalized for one Ti atom), as well as the charge balance between cationic and anionic species, are
5
represented in figures 3.b and 3.c. During the first 120 minutes of UV illumination, a rapid decrease of the charge related to Oa 1s is
observed. After this period, this charge stays almost constant at -3.16 q per Ti atom, which corresponds to 1.58 oxo type atoms coordinating the titanium. The overall number of methanoate
10
species coordinating titanium continuously decreases over time. Aside from the first 120 minutes of illumination, the charge balance between Ti cations and their ligands is quite good and the average difference between negative and positive charges is less than 2%.
15
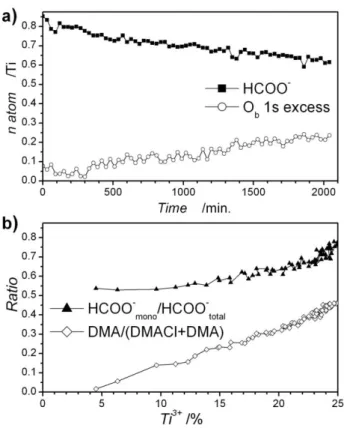
Upon illumination, the other species present in the gel are affected and the evolution of these peaks can be monitored in order to obtain further information about the photochemical mechanism. As presented in figure 4.a, the number of methanoates coordinating the titanium cation decreases with UV
20
illumination time, suggesting that methanoate species are involved in the TiDMF gel photoreduction process. According to Dielbold, oxygen atoms that are formed during the decomposition of methanoates are inserted into the lattice via reaction with Ti3+.42 The other fragments, such as CO, would desorb. By
25
analogy with studies conducted on TiO2 crystalline surfaces, a
mechanism including several steps can be proposed for TiDMF gel:
Firstly, there is a change of the HCOO- conformation from bidentate to monodentate around the Ti3+ site, assisted by
30
photogenerated holes:
Os-CH-Os- + h+ → HCOOs- +
□
Os+ (6)In this equation Os and Os+ stand for O atoms at the surface of
the Ti-O-Ti network, and a positively charged oxygen vacancy, respectively. From XPS experiments, the ratio of monodentate
35
methanoate to overall methanoate is calculated according to Oc
1s/Cb 1s. Its evolution versus the percentage of Ti3+ formed is
plotted in figure 4.b. It appears that if the overall methanoate decreases, the proportion of monodentate methanoate increases from 0.5 to 0.8, approximately, according to the mechanism of
40
equation 6.
Secondly, we observe a dissociative reaction of monodentate methanoate into surface hydroxyls and CO, which is desorbed under vacuum:
HCOOs- → COg + OHs- (7)
45
As observed in figure 4.a, the number of oxygen Ob 1s in
excess, i.e. that which cannot be attributed to Ti-O-C atoms of HCOOs coordinating titanium, is increasing. These atoms can be
attributed to the OHs groups coordinating titanium, and this
would confirm that the methanoate species are being substituted
50
by hydroxo groups at the surface of the inorganic part of the TiDMF gel, as previously observed by EPR.[28] Furthermore, the
rates of HCOO- decrease and of excess Ob increase are really
close (-9.4 10-5 HCOO-.min-1 and 9.7 10-5 Ob.min-1 ; Fig. 5.a), in
agreement with the mechanism described in equation 7.
55
Fig. 4 a) Evolution of the quantity of HCOO- and of Ob 1s in excess in the
TiDMF gel with the UV illumination time; b) Ratio of amine-type nitrogen over overall nitrogen, and ratio of monodentate type methanoate
versus the percentage of reduced titanium.
60
Thirdly, even though the role of dimethylammonium chloride is not clear at this point in our study, we infer that it dissociates in dimethylamine and hydrochloride, according to the mechanism of equation 2. The released chlorides interact with the solid part of the gel, probably with the vacant sites generated according to eq.
65
6, as already evidenced by theoretical and experimental studies on TiO2 surfaces.
43
Indeed, whereas 90% of the dimethylamine is evacuated under vacuum, only 60% of the initial quantity of Cl
-measured by XPS is missing at the end of the reaction. Furthermore, the ratio of N 1s attributed to dimethylamine
70
compared to the overall N 1s content is calculated according to (Nb/(Na + Nb)), and is reported in figure 4.b. It appears that the
ratio of DMA type nitrogen increases linearly with the photoreduction of titanium, thus supporting the hypothesis of dimethylammonium chloride deprotonation. Nevertheless the
75
linear evolution has to be interpreted with caution as dimethylamine is removed from the surface due to the ultra-high vacuum, and thus only part of this product is taken into account during the measurement.
To summarize, the proposed UV light absorption mechanism
80
of the TiDMF gel implies the generation of an electron-hole pair. Initially, it is mainly the methanoate species that coordinate titanium cations, and the remnant organic part is essentially constituted of DMACl. Under UV illumination, the hole is involved in the mechanism that changes the organic ligands,
85
inducing several modifications. One such modification is that the methanoate species change their coordination from bidentate to monodentate, leaving oxygen vacancies at the surface of the inorganic part of the gel. Also, part of the methanoate is
Journal Name
Cite this: DOI: 10.1039/c0xx00000x
www.rsc.org/xxxxxx
Dynamic Article Links
►
ARTICLE TYPE
This journal is © The Royal Society of Chemistry [year] [journal], [year], [vol], 00–00 | 7
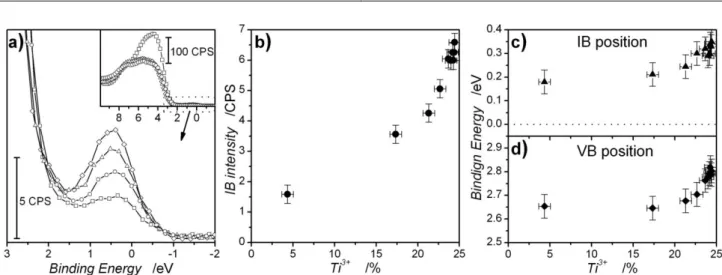
Fig. 5 a) Evolution of the valence band with illumination time (inset), including a zoom of the region between the Fermi level and the valence band (□:
before illumination; ○: 360 min; ∆:1440 min; ◇: 2520 min UV illumination); b) Intermediate Ti 3d band intensity; c) Position versus the amount of Ti3+
formed in the gel; and d) Valence band position.
decomposed and removed under vacuum, inducing changes in the
5
coordination species of the titanium cation, and these methanoate species are substituted by hydroxo groups.28 At the same time, a dissociation of dimethylammonium chloride occurs as the chlorides are required to stabilize the photogenerated vacancies at the surface of the inorganic part of the TiDMF gel, and the
10
resulting dimethylamine molecules are evacuated under vacuum. Lastly, it can also be noted that the photogenerated electron is promoted to the empty 3d orbital of Ti4+, which is then reduced to Ti3+, and since the hole is involved in the oxidation of
methanoate, the electron can be stabilized on this orbital and does
15
not recombine.
Intermediate band generation under UV illumination
These phenomena are associated with the appearance of an intermediate band located between the Fermi level (0eV binding energy) and the top of the valence band that can be observed by
20
XPS measurements (figure 5.a). The intensity of the IB increases depending on the UV illumination time and thus the amount of photoreduced titanium (figure 5.b). Initially, when only 5% of Ti3+ is formed, the band is located at 0.2(1) eV below the Fermi level. When the Ti3+ ratio increases, the position of the IB
25
increases to 0.4(1) eV as presented in figure 5.c. A similar observation can be made for the top of the valence band position, determined by the intercept with 0 of the linear part of the VB from figure 5.a. At first, the valence band is located at 2.6(1) eV below the Fermi level, and then this value increases to 2.8(1) eV.
30
The measured position of the IB from the top of the VB is close to the Fermi level and almost constant displaying an average value of 2.45(5) eV. This intermediate state can be attributed to a splitting of the titanium 3d orbitals of the TiDMF gel. As for the TiO2 crystalline structure, the bottom of the CB of the TiDMF gel
35
is presumably mainly constituted of these Ti 3d orbitals. The nanometric dimension of the inorganic part of the gel, coupled with the anionic substitution on the TiO framework,25 allow for
the stabilization of a distorted octahedral environment around the Ti cations and due to Jahn-Teller effect, allow a splitting of the
40
T2g orbital. Furthermore, the crystal field is extremely sensitive to
the configuration of ligands and the splitting changes when the oxygen atoms are substituted by chlorine atom. Such a splitting of the T2g orbitals was already observed by EPR experiment.28
Based on these evidences and due to the partial filling of these
45
intermediate states by one d electron of Ti3+ (3d1 configuration) the Fermi level should lie in this intermediate band.
Light absorption properties of TiDMF gel
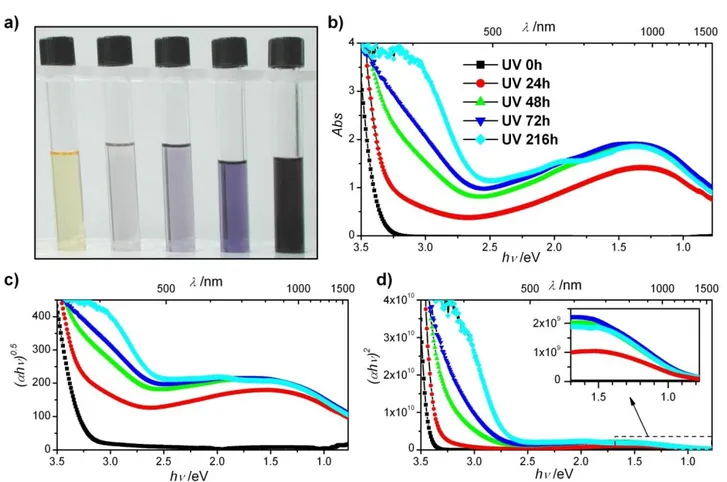
Under atmospheric pressure, similarly to the solid part of the gel under vacuum, TiDMF gel becomes dark blue upon UV
50
illumination, as illustrated in figure 6.a. Such a dark blue colour was already observed in the case of Titanium bronzes44 or Titanium sub-oxides,45 with low content of Ti3+ (< 5%). The UV-visible absorption spectra for a thin layer of TiDMF gel irradiated under UV for different periods of time are grouped together in
55
figure 6.b. Without UV illumination, the spectrum of a gel is characteristic of a semiconductor material with an absorption threshold of around 3.29(5) eV. This value is consistent with the results obtained for TiO2 nanoparticles.46 After illumination of
the gel, an absorption band appears at a lower energy, centered
60
around approximately 1.3 eV. This band reaches a maximum after 48 hours of illumination and is quite intense: between 90 (at 2.5 eV) and 99% (at 1.3 eV) of the light in the visible domain is absorbed. The absorption at high energy is also modified and the absorption threshold is red-shifted towards a lower energy when
65
the illumination time increases. The shape of the absorption spectra at high energy is more complex than that of the non-irradiated TiDMF gel, and seems to be composed of several distinct absorption processes that should reflect the position of the IB measured by XPS. In order to clarify these absorption
70
Journal Name
Cite this: DOI: 10.1039/c0xx00000x
www.rsc.org/xxxxxx
Dynamic Article Links
►
ARTICLE TYPE
This journal is © The Royal Society of Chemistry [year] [journal], [year], [vol], 00–00 | 8
Fig. 6 a) Blue coloration of the TiDMF gel exposed to increasing UV periods (from left to right); b) UV-visible spectra of TiDMF gel exposed to different
illumination times; c) and d) Corresponding Tauc plot for TiDMF gel with n=0.5 (c), and n=2 (d).
Table 2. Values of the different gaps determined from the Tauc plots.
UV time (h) VB to CB (eV) VB to IB (eV) IB to CB (eV)
0 3.29(5) - - 24 3.29 2.58(5) 0.84(5) 48 3.29 2.52(5) 0.84(5) 72 3.29 2.53(5) 0.83(5) 216 3.29 2.59(5) 0.86(5) (αhν)n = a(hν-Eg) (8) 5
Where a, α and Eg are a proportionality coefficient, the
absorption coefficient of the TiDMF gel for each wavelength, and the gap of the gel, respectively. The coefficient n is 2 for an authorized direct transition, and 0.5 for an authorized indirect transition. By plotting (αhν)n
= f(hν), the band gap, Eg, can be
10
placed at the intercept of the linear part of the curve with y=0. The plots obtained for the direct and indirect transitions are presented in figures 6.c and 6.d. In order to identify the different transitions, the spectra are subtracted from the contribution of the non-irradiated TiDMF gel in order to remove the absorption
15
associated with the transition from the VB to the CB band. The absorption at low energy is fitted by Gaussian peaks and is also removed from the spectra in order to retain only the second
absorption threshold, corresponding to the transition between the electronic states at the top of the VB and IB (details of the
20
processes involved can be found in the supplementary information section). The data are treated according to the Tauc formula for an indirect transition (n=0.5). It should be noted that the treatment with n=2 results in small linear domains, and the obtained values present a high discrepancy. Using the same
25
method, the energy of the transition between the IB and the lowest energy states of the CB can be determined to be in the low energy absorption band. In this case, the Tauc model for a direct transition should be used since the values established with n=0.5 are negatives. The energies ascertained for these two transitions
30
are shown in table 2.
The energies of the transition attributed to absorption between the VB and the IB are fairly constant, with an average value of 2.55 eV which is close to the value of 2.45 eV determined by XPS experiments. The results for the IB to CB transition are
35
almost constant, at 0.84(5) eV. The sum of these two intermediate transitions is equal to 3.39 eV, which is slightly above the value determined for the gap of the non-irradiated TiDMF gel. This difference can be explained by the fact that the Tauc model is usually valid for isotropic materials, whereas in this instance, the
This journal is © The Royal Society of Chemistry [year] Journal Name, [year], [vol], 00–00 | 9
Fig. 7 Proposed band structure for the TiDMF gel after appearance of the
intermediate band under UV illumination.
layered and polymeric nature of the TiDMF gel can induce anisotropy.46
5
Using the data obtained from XPS and UV-visible
spectroscopy, a schematic electronic band structure can be proposed in order to clarify the position of the intermediate band in the TiDMF gel, as illustrated in figure 7.
Conclusions
10
We synthesized a new hybrid organic-inorganic material based on titanium oxide units, using a low temperature sol gel process. XPS characterization of the solid part under in situ UV illumination, allows us to study the photochemical modifications induced on the different parts of the gel. The UV light induces a
15
photoreduction of Ti4+ to Ti3+ in large quantities (up to 25% of Ti3+ formed), along with a blue coloration of the gel. This process
is also accompanied by changes on the organic part of the gel: the methanoate species in the coordination of Ti cations change from a bidentate to monodentate conformation, and some of them are
20
substituted with hydroxyl groups. Concurrently, the –NH2 +
of DMACl are converted into –NH, in order to deliver the chloride atoms that are required to stabilize these changes. These two phenomena allow for the stabilization of the photogenerated electron on the titanium 3d orbitals. XPS spectra are quite
25
sensitive to the local distortion and intermediate electronic states appear in the gap just below the Fermi level of the material. This band is believed to result from the large splitting between the T2g
orbitals that can be obtained by way of the nanodimensions of the inorganic part of the gel and oxygen substitution by chlorine
30
atom. The position of this partially filled intermediate band located at 2.5 eV above the VB, was determined by XPS and UV visible experiments.
The presence of this band induces strong visible light absorption of the TiDMF gel. The analysis of the UV-visible
35
absorption spectra allows us to measure the energy of the different transitions provided by this intermediate band. The results concerning the determined position are in good agreement with those obtained by XPS experiments, and allow us to build a complete energy diagram for the TiDMF gel.
40
This new hybrid TiDMF gel heralds a new class of material that can be used in intermediate band solar cells. Among its
advantages are that it exhibits the intermediate band at room temperature, and that its one-step preparation by a sol gel process is compatible with low-cost deposition technologies such as
45
printing or spin coating.
Acknowledgements
T. C. is indebted to the CNRS and the region Pays de la Loire for is grant. Dr N. Dupré is thanked most gratefully for the 1H solid
state NMR experiments. This project was funded by the ANR
50
through the OxTiMIB program.
Notes and references
a Institut des Matériaux Jean Rouxel (IMN) Université de Nantes/CNRS,
2 rue de la Houssinière, 44322 Nantes, France. Fax: +33(0)2 40 37 39 95; Tel: +33 (0)2 40 37 39 39;
55
E-mail: mireille.richard@cnrs-imn.fr
b Institut de Chimie et Procédés pour l’Energie, l’Environnement et la
Santé (ICPEES) Université de Strasbourg/CNRS, 25 rue Becquerel, 67087 Strasbourg, France. Fax: +33 (0)3 68 85 27 61; Tel: +33 (0)3 68 85 27 37;
60
E-mail: cottineau@unistra.fr
c Nanobiotix,
60 rue de Wattignies, B, 75012 Paris, France.
† Electronic Supplementary Information (ESI) available: 1H solid state 65
NMR spectra of TiDMF gel: evolution of C 1s, O 1s and N 1s XPS components under UV illumination; angle resolved XPS spectra; model for the UV-visible spectra treatment. See DOI: 10.1039/b000000x/ 1 N. S. Lewis, G. Crabtree, in Basic research Needs for solar
utilization, Office of Science, U. S. Department of Energy,
Washington, DC, 2005.
2 N. S. Lewis, Science, 2007, 315, 798.
3 W. Shockley and H. J. Queisser, J. Appl. Phys. 1961, 32, 510. 4 B. S. Richards, Sol. Energy Mater. Sol. Cells, 2006, 90, 1189. 5 H.-Q. Wang, M. Batenschuk, A. Osvet, L. Pinna and C. J. Brabec,
Adv. Mat. 2011, 23, 2675.
6 S. J. Kim, W. J. Kim, A. N. Cartwright and P. N. Prasad, Appl. Phys.
Lett. 2008, 92, 191107.
7 H. Cotal, C. Fetzer, J. Boisvert, G. Kinsey, R. King, P. Hebert, H. Yoon and N. Karam, Energy Environ. Sci. 2009, 2, 174.
8 NREL website, Best Research-Cell Efficiencies Chart (rev. august- 2013).
9 A. Luque and A. Marti, Adv. Mat. 2010, 22, 160. 10 A. Luque and A. Marti, Phys. Rev. Lett. 1997, 78, 5014.
11 A. Luque, A. Marti, C. R. Stanley, N. Lopez, L. Cuadra, D. Zhou and A. Mc-Kee, J. Appl. Phys. 2004, 96, 903.
12 A. Marti, E. Antolin, C. R. Stanley, C. D. Farmer, N. Lopez, P. Diaz, E. Canovas, P. G. Linares and A. Luque, Phys. Rev. Lett. 2006, 97, 247701.
13 A. Luque, A. Marti and C. R. Stanley, Nat. Photonics, 2012, 6, 146. 14 H. Pan, B. H. Gu, G. Eres and Z. Y. Zhang, J. Chem. Phys. 2010,
132, 104501.
15 N. Lopez, L. A. Reichertz, K. M. Yu, K. Campman and W. Walukiewicz, Phys. Rev. Lett. 2011, 106, 028701.
16 R. W. Peng, M. Mazzer, K. W. J. Barnham, Appl. Phys. Lett. 2003,
83, 770.
17 F. Wu. H. Lan, Z. Zhang, and P. Cui, J. Chem. Phys. 2012, 137, 104702.
18 J. Burschka, N. Pellet, S.-J. Moon, R. Humphry-Baker, P. Gao, M. K. Nazeeruddin and M. Grätzel, Nature, 2013, 499, 316.
19 A. Fujishima, X. Zhang and D. A. Tryk, Surf. Sci. Rep. 2008, 63, 515.
20 X. Chen, C. Li, M. Grätzel, R. Kostecki and S. S. Mao, Chem. Soc.
10 | Journal Name, [year], [vol], 00–00 This journal is © The Royal Society of Chemistry [year] 21 A. Heller, Acc. Chem. Res. 1995, 28, 503.
22 A. Fujishima and K. Honda, Nature, 1972, 238, 37. 23 B. O’Regan and M. Graëtzel, Nature, 1991, 353, 737.
24 T. L. Thompson and J. T. Jr. Yates, Chem. Rev. 2006, 106, 4428. 25 T. Cottineau, M. Richard-Plouet, A. Rouet, E. Puzenat, H. Sutrisno,
Y. Piffard, P-E. Petit and L. Brohan, Chem. Mater., 2008, 20, 1421. 26 B. Pattier, M. Henderson, G. Brotons and A. Gibaud, J. Phys. Chem.
B, 2010, 114, 5227.
27 T. Cottineau, M. Richard-Plouet, J-Y. Mevellec and L. Brohan, J.
Phys. Chem. C, 2011, 115, 12269.
28 T. Cottineau, L. Brohan, M. Pregelj, P. Cevc, M. Richard-Plouet and, D. Arčon, Adv. Func. Mat. 2008, 18, 2602.
29 B. Pattier, M. Henderson, A. Pöppl, A. Kassiba and A. Gibaud, J.
Phys. Chem. B, 2010, 114, 4424.
30 N. Fairley, Copyright© 2005 Casa Software Ltd.
31 R. Hesse, T. Chassé, P. Streubel and R. Szargan, Surf. Inter. Anal. 2004, 36, 1373.
32 H. Terisse, A. F. Bando, T. Cottineau, L. Brohan and M. Richard-Plouet, J. Sol-Gel Sci. Technol. 2013, 67, 288.
33 S. Liu, C. Wang, H. Zhai and D. Li, J. Mol. Struct. 2003, 654, 215. 34 R. S. Brown, A. J. Bennet and H. Slebocka-Tilk, Acc. Chem. Res.
1992, 25, 481.
35 A. N. Shultz, W. Jang, W. M. Hetherington III, D. R. Baer, L. Q. Wang and M. H. Engelhard, Surf. Sci., 1995, 339, 114; F. Guillemot, M. C. Porté, C. Labrugère and C. Baquey, J. Coll. & Interf. Sci. 2002, 255, 75.
36 J. F. Moulder, W. F. Stickle, P. E. Sobol and K. D. Bomben in
Handbook of X-ray Photoelectron Spectroscopy, Perkin-Elmer Corp.:
Eden-Prairie MN, 1992.
37 L. Q. Wang, K. F. Ferris, A. N. Shultz, D. R. Baer and M. H. Engelhard, Surf. Sci. 1997, 380, 352; M. R. Alexander, G. Beamson, C. J. Blomfield, G. Leggett and T. M. Duc, J. Electr. Spectr.
Rel.Phen. 2001, 121, 19.
38 J. C. Yu, L. Z. Zhang, Z. Zheng and J. C. Zhao, Chem. Mater. 2003,
15, 2280; Y. F. Gao, Y. Masuda and K. Koumoto, Langmuir, 2004, 20, 3188.
39 B. J. Meenan, J. A. Hewitt and N. M. D. Brown, Surf. Inter. Anal. 1992, 18, 187.
40 D. Briggs and J. T. Grant, in Surface analysis by Auger and X-ray
photoelectron Spectroscopy, IM publication, Chichester, 2003.
41 I. V. Chernyshova, K. Hanumantha Rao, A. Vidyadhar and A. V. Shchukarev, Langmuir, 2000, 16, 8071; A. Vidyadhar, K. H. Rao, I. V. Chernyshova and K. S. E. Forssberg, J. Coll. & Interf. Sci., 2002,
256, 59; A. Vidyadhar, K. H. Rao and I. V. Chernyshova, Coll. &
Surf. A, 2003, 214, 127.
42 U. Diebold, Surf. Sci. Rep. 2003, 48, 53.
43 D. Vogtenhuber, R. Poducky, J. Redinger, E.L.D. Hebenstreit and U. Diebold, Phys. Rev. B 2002, 65, 125411.
44 L. Brohan, R.Marchand, M. Tournoux, J. Solid State Chem., 1988,
72, 145.
45 S. Andersson, A. Magneli, Naturwiss 1956, 43, 495.
46 S. Monticone, R. Tufeu, A. V. Kanaev, E. Scolan and C. Sanchez,
Appl. Surf. Sci. 2000, 162, 565.
47 J. I. Pankove in Absorption in opt. proc. semiconductors, Prentice-Hall, Englewood Cliffs, NJ, 1971.