Wear mechanisms of WC–Co cutting tools from high-speed tribological tests
T. Kagnaya
a,b, C. Boher
a,∗, L. Lambert
b, M. Lazard
b, T. Cutard
aaUniversity of Toulouse, Mines Albi, CROMeP, F-81013 Albi cedex, France
bHigh Institute of Engineering Design (ERMeP) GIP-InSIC, 27 rue d’Hellieule, F-88100 Saint Dié des Vosges, France
Keywords: Cemented carbide Dry friction High sliding speed Wear
Temperature
a b s t r a c t
In machining processes, surface roughness and dimensional accuracy of machined parts depend on tool wear. Cemented carbide based cutting tools remain widely used in machining processes for their wear resistance. The aim of this paper is to study wear mechanisms of a WC–Co cutting tool grade under tri-bological conditions. Dry friction experiments are carried out on a high-speed pin-on-disc tribometer considering WC–Co pins against steel discs made of an AISI 1045 grade. Furthermore, two type-K ther-mocouples are embedded in WC–Co pins in order to estimate the contact temperature during sliding tests. A large sliding speed range is considered: from 60 up to 600 m/min. Results deal with wear rate versus tribological conditions, evolution of friction coefficient and temperature versus sliding speed and evolution of wear mechanisms. WC–Co tribological pins exhibit different wear mechanisms: abrasion, adhesion, transgranular WC micro-cracking and WC/WC debonding. Circulation of debris in the friction contact depends on sliding speed and on test duration. The evolution of surface temperature versus fric-tion coefficient is studied too. Furthermore, a particular attenfric-tion is paid on the relafric-tionship between the thermal energy in the pin and the mechanical energy in the contact. The thermal energy is calculated from the temperature values of K-thermocouples and the mechanical energy dissipated in the pin is calculated from friction coefficient evolutions. Relationships are established through modelling approaches.
1. Introduction
WC–Co cemented carbides are extensively used as cutting tools in machining processes for their excellent wear resistance. In machining process, cutting tools are generally subjected to severe mechanical and thermal conditions. Such conditions influence con-siderably cutting tool wear. The study of the cutting tool wear still remains a challenge in cutting process because it depends on the temperature level and on friction conditions at tool/chip and tool/workpiece interfaces. During machining process, conditions at these interfaces are not fully understood. Several studies[1–4]were performed in laboratory tribological conditions (pin/disc friction conditions) to fully understand wear mechanisms at tool/chip and tool/workpiece interfaces. To study wear of machining tools, Yang [1,2]developed a moving pin technique for pin-on-disc wear test-ing ustest-ing the whole disc surface area. Ustest-ing three different disc steel grades, he showed that the wear coefficient obtained with the moving pin tribometer is more consistent than the one obtained by classic friction test (stationary pin test) for the same friction con-ditions. The highest wear rates obtained in the case of the moving
∗ Corresponding author. Tel.: +33 5 63 49 31 69; fax: +33 5 63 49 32 42. E-mail addresses:tchadja.kagnaya@enstimac.fr(T. Kagnaya),
christine.boher@entsimac.fr(C. Boher),Laurence.lambert@insic.fr(L. Lambert), Myriam.lazard@insic.fr(M. Lazard),Thierry.cutard@enstimac.fr(T. Cutard).
pin are explained because the pin always slides on a new surface. Moreover, mechanical characteristics of the disc remain constant. In addition, the comparison of the wear coefficient between tri-bological pins and insert tips used in turning operation showed a difference of one order of magnitude. It is suggested that the high turning temperature at the tool–chip interface may have lowered the hardness of the work material during the turning operation to give the lower wear coefficient values. To take into account the temperature effect in tribological tests, Yang[3]investigated wear coefficient of tungsten carbide on a high temperature pin-on-disc tribometer. To simulate the turning operation, the vertical align-ment of the pin is modified to achieve different contact surfaces.
Whatever test temperatures, the pin wear coefficient is always more important than insert tips. For high temperature friction tests, they observed that the most involved wear mechanism is adhesive wear without any deep grooves and with the presence of debris. At room temperature abrasive wear is predominant. This observa-tion showed that the temperature plays an important role in wear mechanisms. Jianxin et al.[5]studied friction and wear behavior of WC tools with a PVD ZrN coating in sliding wear (20–100 N and 0.2–1 m/s) and in machining processes. With the sliding wear tests they showed that the coated carbides offer the best abrasive resis-tance and the same conclusion is obtained for cutting operations.
Therefore, some authors have used tribological tests to measure wear coefficient and to understand wear mechanisms of carbide tools.
Fig. 1. (a) Global view of the high-speed tribometer; (b) tribological pin in contact with the disc; (c) pin design and thermocouples location.
Fig. 2. Microstructure of the WC–Co grade and WC grain size.
Nevertheless, machining processes have some differences with tests of sliding wear (contact area, chip formation, chip plas-tic deformation, chip geometry, heat generated during cutting, temperature level, etc.). Indeed, pin-on-disc friction tests can be viewed as the continuous friction between flank-face and work-piece. This comparison is less convincing for the instantaneous friction between rake face and chip during cutting process. On the other hand, during cutting processes, the generated microchips can be embedded between surfaces in friction and can play a part as debris like in tribological tests. Moreover, the temperature of the interface is a parameter that affects the mechanical and thermo-physical properties of cemented carbides[6,7]. The aim of this paper is to study the relationship between the temperature generated by friction and wear of WC–Co tool grade. The tribological tests are performed with a pin-on-disc tribometer at a very high sliding speed (10 m/s). The study focuses on SEM analysis of worn sur-faces of the pins, calculations of wear parameters and temperature measurements. An analysis of the temperature evolutions versus friction coefficient and wear mechanisms at different conditions are investigated.
2. Experiments and materials
2.1. High-speed tribometer
Friction tests are carried out with a very high-speed pin-on-disc tribometer in dry conditions. The disc is 170 mm in diameter and 10 mm in thickness. The disc has a continuous rotating movement and the rotating speed can vary from 30 to 3000 rpm. Linear slid-ing speed depends on radius of the wear track and can range from 0.05 to 30 m/s (Fig. 1a). The pin has a cylindrical shape (diameter 10 mm) with a truncated conic and with a flat circular surface of 2 mm in diameter (contact surface). Before any test, the pin and the disc are cleaned using dry air and the pin is cleaned in an ultrasonic tank using acetone and ethanol. The normal loading is carried out by dead weights. The tangential force (friction) is measured using a strain gauge located in the friction plane. Two type-K thermocou-ples are embedded in the pin to measure the temperature evolution during friction. The thermocouple holes are 0.6 mm in diameter and the thermocouple diameter is 0.5 mm. The first (TC1) and the sec-ond (TC2) thermocouples are embedded respectively at 1 mm and
at 3 mm from the contact surface of the pin (Fig. 1b and c). The dis-tance between the two thermocouples is always 2 mm. To be sure that the thermocouples are well embedded, a silver glue is used.
The temperatures (TC1 and TC2) of the pin and the friction forces are directly recorded during the test with a software developed on LABVIEW. The data sampling frequency for temperatures and for friction forces is 10 Hz.
2.2. Materials
The disc steel grade is AISI 1045. It is a medium carbon content steel with a perlito-ferritic microstructure. The cemented carbide pin is composed of tungsten carbide grains and of a cobalt binder (WC–6.5 wt.% Co grade G1 K20). The grain shape is polygonal and their largest size is in the range of 350 nm to 2 !m (Fig. 2). The WC–Co hardness is 1550 HV10and the density is 14.90 g/cm3. 2.3. Set-up conditions
Several friction tests are carried out under various sliding speeds to reproduce wear mechanisms as observed at the surface of machining tools. In comparison of tribological machining wear mechanisms, criterion that are considered deal with similarities between microstructural evolutions of the contact surfaces. The frame of the tribometer is able to bear very high-speed tests but it is designed for normal loadings less than 100 N. For this rea-son, the used normal load is preferentially 60 N. For one sliding speed and different durations, tests are performed to measure the evolution of the pin wear. The test conditions are listed in Table 1.
From the experimental values (friction force, pin height loss and thermocouple temperatures), four physical quantities are deter-mined to compare and explain our results. They deal with the pin wear volume, the pin wear rate, the mechanical cumulated energy
Table 1
Test conditions.
Load, 60 N
Sliding speed (m/min) 60 100 300 400 600 Test durations (min) 120 15 15 5, 15, 60 17, 27, 60, 120
dissipated by friction in the contact and the heat energy cumulated in the pin.
The pin wear volume (WV) is calculated from the diameter devi-ation of the unworn (D1) and worn (D2) surface (Eq.(1)). The wear volume (WR) is obtained considering Eq.(2).
WV =24!(D2− D1)(D12+ D22+ D1D2) (1)
WR =WVF
NL (2)
where WV (mm3) is the pin wear volume, WR (mm3/(N m)) the pin
wear rate, D1and D2(mm) respectively the mean value of an initial
diameter and of a final diameter of the pin contact surface, FN(N)
is a normal load, and L (m) is the sliding distance.
The mechanical cumulated energy dissipated by friction in the contact (EMC) (Eq.(3)) is directly calculated from the friction curve
versus test duration (cumulative energy). The energy dissipated in the contact is the work of the friction force. For each time interval "t, the dissipated energy "E can be calculated with Eq.(3). Con-sidering the mean value of the friction coefficient and assuming a constant sliding speed and normal load, Eq.(4)can be used: "E = FNV
!
"t 0 #(t) dt = F NV ¯#i"t (3) EMC="
"E = n"
i=0 FNV ¯#i"t (4)where EMC(J) is a mechanical cumulated energy dissipated by
fric-tion in the contact, V (m/s) is linear sliding speed, "t is increment of time (s), n is total number of data measures (tf/"t), tfis friction
test duration (s), FNis friction force, and ¯#iis the mean value of
Coulomb friction coefficient during the time interval "t.
The mechanical cumulated energy dissipated by friction only in the pin (EMP) is a fraction of the mechanical cumulated energy
dissipated by friction in the contact (EMC) (Eq.(5)). It depends on
the partition coefficient (ˇ) calculated with the Peclet number. The partition coefficient is expressed versus linear sliding speed (V) in Eq.(6)(Appendix A).
EMP= ˇEMC (5)
ˇ = 1.66V− 0.385 (6)
The heat energy cumulated in the pin (ETP) measured from the
deviation of the two temperatures (TC1 and TC2) is given in Eq. (7), considering a unidirectional thermal conduction with spherical coordinates (Appendix B). ETP= S"h$p n
"
i=0 "Ti"t (7)where ETP (J) is the heat energy cumulated in the pin (J), $p
(W/(m◦C)) the thermal conductivity of the pin, S the considered
sur-face (m2), "h (m) the distance between the two thermocouples, and
"T(t) = TC1(t) − TC2(t) (◦C) is the deviation between temperature of
TC1 and TC2.
2.4. Analyses
Optical microscopy, and scanning electronic microscopy (SEM) and energy dispersive spectrometry (EDS) are used to analyze WC–Co pin surfaces and pin cross-sections. For the last ones, the surface cut is made in a direction parallel to the friction direction (AA′orientation) or perpendicular to the friction direction (BB′
ori-entation). The topography of the wear surface of the pins is carried out with a confocal microscope.
Fig. 3. Friction coefficient versus sliding speed (normal load: 60 N).
3. Results and discussion
3.1. Evolution of the friction coefficient
For each test, a mean value of friction coefficient is calculated from the friction coefficient curve. For a normal load of 60 N, the mean friction coefficient versus sliding speed is plotted inFig. 3. The friction coefficient decreases when the speed increases (0.63–0.4). Two phenomena can be considered to explain this linear decrease: (i) the debris circulation into the contact and (ii) the increase of the contact surface temperature. In the first case, debris circula-tion induces that more the sliding speed is high more the pin is worn. The WC–Co particles are smashed to powder in the contact and participate to the friction as a third-body. The pin wear will be discussed in the next subsection. Furthermore, the increase of the contact temperature leads to damage the mechanical properties of the two antagonists, particularly the disc ones.
The dependence between the evolution of the friction and the thermocouple temperature one is also very high (Fig. 4). If the temperature level is directly dependent on the mechanical energy dissipated in the contact (thus on the product between contact pressure and sliding speed), the temperature evolutions are result-ing from the friction and consequently from the circulation of debris in the contact. In this approach, the influence of the pin height loss is not taken into account even if it could influence the measured tem-peratures. Considering that in our tests, the maximum pin height loss is equal to 0.13 mm after 1 h of test, and considering the quasi-steady state of the temperature evolution, it could be assumed that the level of the temperature is slightly influenced by this parameter.
Fig. 4. Mean friction coefficient versus mean temperature of thermocouple TC1
Fig. 5. Pin wear volume (WV) versus mechanical energy given in the contact (sliding
distance × normal load) (normal load: 60 N).
3.2. Evolution of the pin wear volume
For the different sliding speeds and test durations, the plot of the wear volume of WC–Co pins versus the mechanical energy into the contact (sliding distance × normal load) is considered as linear and verifies the Archard law (Fig. 5). The pin wear rate (WR) is equal to 2.44E− 7 (mm3/(N m)).
The plot of the wear volume of WC–Co pins versus the mechan-ical energy dissipated in the pin (EMP) is also considered as linear
(Fig. 6). In this case, the curve slope is equal to 4.16E− 6 (mm3/(N m)).
Even if the partition coefficient (ˇ) is not a constant value, the same trend is obtained with the mechanical energy dissipated by friction only on the contact (EMP).
For the pin, whatever the different sliding speeds for a nor-mal loading of 60 N, the curve trends are linear. It means that the kinetic of pin debris generation is constant with a wear rate of 2.44E− 7 (mm3/(N m)). If the kinetic is the same, the linear trends
can also indicate that the mechanisms of wear loss can be con-sidered as being the same. Several authors[8]already studied the linear dependence between dissipated energy and wear loss.
3.3. Pin wear mechanisms
3.3.1. Macroscopic scale considering friction and thermocouple temperature evolutions
The evolutions of the friction coefficient and of the thermocou-ple temperatures are given for a 600 m/min sliding speed, a normal load of 60 N and a test duration of 1 h (Figs. 7 and 8).
These figures show that similarities exist between temperature and friction coefficient evolutions versus time. The friction curve
Fig. 6. Pin wear volume (WV) versus mechanical energy dissipated by friction in the
pin (EMP) (normal load: 60 N).
Fig. 7. Friction coefficient evolution versus time (V = 600 m/min; normal load: 60 N).
presents several stages with more or less large fluctuations. The fric-tion coefficient as well as the thermocouple temperatures reaches a steady state after a short-term period (200 s). Decrease of the fric-tion coefficient during this stage (stage 1) is related to a mechanical accommodation between the antagonists and to a “polishing pro-cess” of the WC–Co pin surface. At high sliding speed, during the first moments of friction, shocks between asperities of the antag-onists induce sparks and an increase of the mean temperature[9]. During tests, sparks were clearly observed at the pin incoming. For a speed of 600 m/min, the temperature of the first thermocouple TC1 is higher than 300◦C after 3 s of friction and reach 400◦C after
25 s (Fig. 8). The very fast increase of temperature during this stage results from the break of initial asperities at the first time of the friction between the two antagonists. After this stage, the friction coefficient is constant as well as the mean temperature (stage 2). Observing such a steady state means that the wear mechanism of the pin is constant during the test duration and that the boundary conditions in terms of heat convection exchanges around the pin are quite a constant.
Curves are generally composed of regular fluctuations with a frequency less than 1 Hz (Figs. 7 and 8). They probably result from the tribometer frame vibrations and of large random fluctuations due to the debris evolution in the contact.
Large variations of the friction coefficient and of the tempera-ture are noticed after stage 2 (other tests confirm these evolutions). Authors[10]previously observed such a phenomenon. The very hard WC debris contributes as a third-body in the friction contact to form deep scratches parallel to the friction direction at the pin contact surface (Fig. 9). And circulation of hard particles into the contact could explain these large variations of the friction
Fig. 9. Pin surface topography (V = 600 m/min; P = 60 N; t = 60 min).
cient evolution. It is assumed that circulating debris are essentially made of WC–Co because steel ones (iron debris) are preferentially transferred at the pin surface.
3.3.2. Microscopic scale considering SEM observations and EDS analyses
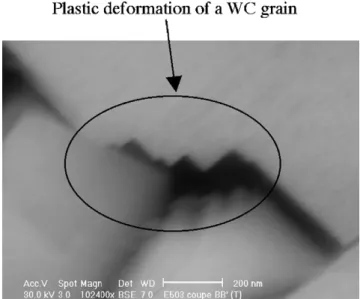
SEM observations of the pin deal with contact surface exam-inations and with cross-section ones. The wear modes observed are micro-plastic deformation and micro-cracks initiation of WC grains. Compared to the WC phase, the binder phase is very soft. Under high shear stress levels, the cobalt binder phase can flow at the microscopic scale and induces direct contacts between WC grains. As seen inFig. 10, the polygonal grain shape induces stress concentration and micro-cracks initiation[11,12]. The weak tough-ness of WC (about 10 MPa√m) could explain the fast propagation of the cracks through the grains. Plastic deformation of WC grains is also observed (Fig. 11). In addition, under huge local shear stresses, WC fragments are removed from the matrix and act as abrasive debris in the contact to contribute to the scratches forma-tion. Grains fragmentation and grains debonding are observed in Fig. 12.
For 600 m/min, abrasive scratches and iron oxide transfer are observed at the pin contact surfaces (Fig. 13). The scratches are generated by the debris flow through the friction contact. Oxygen is always detected in the iron-rich transfer made of iron oxide. Thus, disc wear is involved in transfer debris at the pin surface. The trans-fer layer thickness is generally very low (2–3 !m) (Fig. 14) even if in some cross-sections the thickness could reach 10 !m. The transfer is essentially composed of iron oxide (Fig. 14). Below 600 m/min, no macroscopic transfer is observed at the pin contact surface. Further-more, a lot of small iron oxide transfer areas are dispersed through
Fig. 10. SEM micrograph of the pin cross-section (AA′orientation) (600 m/min –60 N–1 h). Observation of WC micro-cracks due to shear stresses.
Fig. 11. SEM micrograph of the pin cross-section (600 m/min–60 N–2 h).
Observa-tion of WC plastic deformaObserva-tion due to shear stresses and to the polygonal shape of WC grains.
Fig. 12. SEM micrograph of the pin cross-section (600 m/min–60 N–17 min).
Obser-vation of WC debonding and of WC fragmentation.
Fig. 13. SEM micrograph of the pin contact surface (600 m/min–60 N–27 min).
Fig. 14. SEM micrograph of the pin cross-section (600 m/min–60 N–1 h). Observation of the thickness of the iron oxide transfer (EDS analysis: iron oxide).
Fig. 15. SEM micrographs of the pin contact surface (600 m/min–60 N–1 h): (a) global view, (b) point A and (c) point B.
the material (Fig. 15, points C and D), at the spaces between WC grains (grain boundaries, triple points, etc.).
Finally, the macroscopic layers generated by transfer mecha-nisms of the iron disc are essentially detected for test durations higher than 17 min. Therefore, it can be concluded that occurrence of transfer mechanisms take place at the same time that the large fluctuations and the low increase of values on the friction curves (after the stage 2) and on the thermocouple ones (Figs. 7 and 8). Therefore, adhesion could be a wear mechanism that induces more energy dissipation than abrasion or groove formation.
3.4. Consideration of energies dissipated in pin wear
The wear mechanisms of pins are depending on the energy dis-sipated in the contact by friction (EMC). The temperature increase
in the pin is directly linked to the large part of mechanical energy dissipated in the contact. We make assumption that the whole dis-sipated energy in the pin (EMP) is transformed in heat, leading to an
increase of the thermocouple temperature. So, energy consumed for plastic deformation of the sub-contact layers and energy of the secondary processes (e.g. acoustic emission, oxidation, failure, etc.) are neglected.
In this subsection, we are studying both the level of the dis-sipated power and of the disdis-sipated energy, leading to pin wear mechanisms. As previously written, two energy and power quanti-ties can be calculated from measurements: the mechanical energy dissipated in the contact (EMC) by measuring the friction coefficient
(Eq.(4)) and the thermal energy dissipated in the pin (ETP) (Eq.(7))
by measuring the temperature deviation between the two thermo-couples TC1 and TC2. From EMCand using the partition coefficient,
the mechanical energy dissipated in the pin (EMP) is calculated
(Eq.(5)). Powers corresponding to these energies are considered as being equal to the ratio “dissipated energy/total test duration” (e.g. PTP= Power and ETP= Energy). The power values are
instanta-neous quantities and not cumulated ones. In power values, the test duration is not taken into account.
For very high sliding speeds (≥300 m/min), the thermal power dissipated (PTP) in the pin and the thermocouple temperature (TC1
measured after 15 min of test duration) are slightly speed depend-ing (Figs. 16 and 17). For low sliding speeds (<300 m/min), the thermal power dissipated in the pin and the thermocouple temper-atures are strongly speed depending. These two levels of thermal power dissipated in the pin must be related to the debris circu-lation in the tribo-contact. For PTPhigh levels, scratches and iron
transfer at the pin contact surface are observed after a short time test (15 min). Temperatures are also very high. For PTP low levels,
even after 2 h of test, no scratches and no transfer at the pin contact surface are observed and the temperature remains low. Only the contact surface of the pin is polished.
The thermal energy dissipated in the pin (ETP) plotted versus
the mechanical one (EMP) has a linear dependence with a slope
coefficient equal to 1.13 (Fig. 18). That means that 88.5% of EMPis
Fig. 17. Mean temperature of the TC1 thermocouple versus sliding speed (FN= 60 N; time = 15 min).
Fig. 18. Mechanical energy dissipated in the pin versus thermal energy dissipated
in the pin.
transformed into a thermal energy. The last 11.5% of this energy are lost in convection and wear phenomena.
4. Conclusions
Friction and wear of a WC–Co cemented carbide are studied on a very high sliding-speed tribometer. Tests have been carried out with a constant normal load and various sliding speeds and test durations. Two thermocouples have been embedded in the pin to quantify the thermal cumulated energy dissipated in the pin. Wear parameters and temperature measurements have been performed to better understand the wear mechanisms of the WC–Co pins.
The friction coefficient decreases when the sliding speed and the pin temperature increase. The friction coefficient and the temper-ature curves always have the same evolution versus test duration. The wear volume of the pin is directly depending on the mechan-ical energy dissipated in the pin. At low sliding speeds, the wear mechanisms of the pin deal with plastic deformation and micro-cracking of WC grains, fragmentation and debonding of WC grains and polishing of the pin contact surface. At high sliding speeds, a supplementary wear mechanism is observed. It deals with transfer of iron oxide. When iron transfer appears, the friction coefficient and temperature curves versus test duration are very chaotic. The thermal power dissipated in the pin depends on the sliding speed. 88.5% of the mechanical energy dissipated in the pin are trans-formed into thermal energy. The last percents of this energy are lost in convection and wear phenomena. It seems that adhesion (iron transfer) plays an important part in this energy because fluc-tuations of friction coefficient and temperature, versus time, are very high when adhesion appears.
Appendix A
To determine the part of the dissipated energy in the pin, it is supposed that all the mechanical energy dissipated in the contact is converted into heat. The generated heat is distributed between the pin and the disc. The calculation of dissipated energy in the pin (EMP) is based on the determination of a heat partition coefficient
(ˇ) and total dissipated energy (EMC). This coefficient is related to
experimental conditions. For high-speed sliding tests, it depends on the dimensionless thermal number Pe (Peclet number) and can be determined following Eq.(A1).
ˇ = $p
$p+
#
$d√! Pe/2$
and Pe =Vd
˛p (A1)
where V (m/s) is the sliding speed, ˛p(m2/s) the thermal diffusivity
of the pin (˛p= $p/%pcp), $p(W/(m◦C)) the thermal conductivity of
the pin and $d(W/(m◦C)) the thermal conductivity of the disc.
Appendix B
The thermal energy dissipated in the pin (ETP) is calculated using
Eq.(7). It is based on some assumptions. Numerical simulation investigations performed to determine pin contact surface temper-ature[13]showed that isothermal surfaces have a spherical form (due to the conical shape of the pin). We consider that for long test times, the temperature reaches a steady state. In this case, heat con-duction is the principal heat transfer mode. Considering a hollow sphere, if a flux is applied on the interior surface of the sphere and if it is considered that, there is not loss of energy, the same quan-tity of flux is fully transmitted to the outside surface of the sphere (Fig. B1). On the one hand, we consider that the angle between points of thermocouples implantation is very small. In this way, it is supposed that points of measurement are located on a same radius. Based on these assumptions, the heat flux density can be calculated using Eq.(B1). On the other hand, it is considered that the heat flux density calculated using Eq.(B1)is applied on the sur-face (S) of the spherical cap passing by thermocouple TC1. So the total thermal energy dissipated in the pin (ETP) during the test is
calculated using the following equation(B2). ϕi TP= $p "h"Ti (B1) ETP= S"h$p n
"
i=0 "Ti"t (B2) S = 2!r2(1 − cos ') (B3)where ' is the half angle and r (m) is the radius of the sphere passing by thermocouple TC1.
References
[1] L.J. Yang, Pin-on-disc wear testing of tungsten carbide with a new moving pin technique, Wear 225–229 (1999) 557–562.
[2] L.J. Yang, Determination of the wear coefficient of tungsten carbide by a turning operation, Wear 250 (2001) 366–375.
[3] L.J. Yang, Wear coefficient of tungsten carbide against hot-work tool steel disc with two different pin settings, Wear 257 (2004) 481–495.
[4] F. Zemzemi, J. Rech, W. Bensalem, P. Kapsa, A. Dogui, Analyse du frottement aux interfaces pièce-outil-copeau au cours de l’usinage d’un acier 42CrMo4, in: 18ème Congrès Franc¸ais de Mécanique, Grenoble, August 27–31, 2007. [5] D. Jianxin, L. Jianhua, Z. Jinlong, S. Wenlong, N. Ming, Friction and wear behaviors
of the PVD ZrN coated carbide in sliding wear tests and in machining processes, Wear 264 (2008) 298–307.
[6] W. Acchar, U.U. Gomes, W.A. Kaysser, J. Goring, Strength degradation of a tungsten carbide–cobalt composite at elevated temperatures, Materials Char-acterization 43 (1999) 27–32.
[7] G. Östberg, K. Buss, M. Christensen, S. Norgren, H.-O. Andrén, D. Mari, G. Wahnström, I. Reineck, Effect of TaC on plastic deformation of WC–Co and
Ti(C,N)–WC–Co, International Journal of Refractory Metals & Hard Materials 24 (2006) 145–154.
[8] M.Z. Huq, J.P. Celis, Expressing wear rate in sliding contacts based on dissipated energy, Wear 252 (2002) 375–383.
[9] J.R. Gomes, O.M. Silva, C.M. Silva, L.C. Pardini, R.F. Silva, The effect of sliding speed and temperature on the tribological behaviour of carbon–carbon composites, Wear 249 (2001) 240–245.
[10] J.-Y. Paris, L. Vincent, J. Denape, High-speed tribological behaviour of a carbon/silicon-carbide composite, Composites Science and Technology 61 (2001) 417–423.
[11] J. Pirso, S. Letunovit, M. Viljus, Friction and wear behaviour of cemented car-bides, Wear 257 (2004) 257–265.
[12] J. Pirso, M. Viljus, S. Letunovit, Friction and dry sliding wear behaviour of cer-mets, Wear 260 (2006) 815–824.
[13] T. Kagnaya, C. Boher, L. Lambert, M. Lazard, T. Cutard, Friction at high sliding speed of WC/Co pin versus steel disc: estimation of the con-tact temperature, in: ACE-X 2008 Conference, Barcelona, Spain, July 14–15, 2008.