Fumonisin toxicity in ducks and turkeys
Texte intégral
Figure
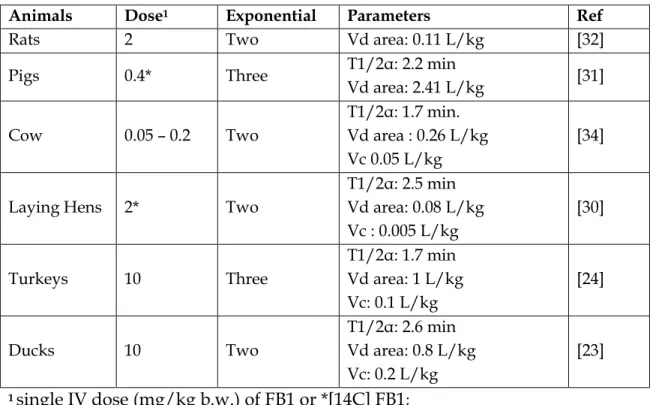
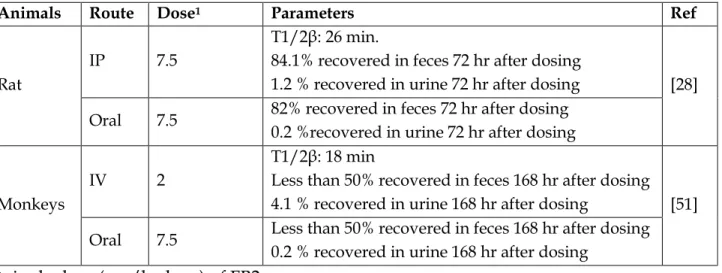
![Table 6: Residual of [14C-FB1]](https://thumb-eu.123doks.com/thumbv2/123doknet/3551796.104044/31.893.102.827.145.663/table-residual-of-c-fb.webp)

![Table 14: FDA-recommended maximum levels for FBs in human foods [160]](https://thumb-eu.123doks.com/thumbv2/123doknet/3551796.104044/64.893.109.817.741.1067/table-fda-recommended-maximum-levels-fbs-human-foods.webp)
![Figure 3: Diagram of sphingolipids biosynthesis [179-180-181-182]](https://thumb-eu.123doks.com/thumbv2/123doknet/3551796.104044/68.893.106.820.96.775/figure-diagram-of-sphingolipids-biosynthesis.webp)
![Figure 4: Role of sphingolipids in inflammatory responses [179-187-196]](https://thumb-eu.123doks.com/thumbv2/123doknet/3551796.104044/70.893.106.797.626.1087/figure-role-sphingolipids-inflammatory-responses.webp)
Documents relatifs
study showed an increased risk of current asthma among irritant users even for a low number of products weekly used, whereas previous studies reported association only for
ised on higher levels in the breast tissues adjacent to the tumor compared to tumor specimens when considering either score or staining area whereas AdipoR2, leptin and COX-2 were
Taking pesticide emissions and their toxicity impacts on environment and human health into account in Life Cycle Assessment ( LCA) studies is important in
Seed Germination and Longevity: An Integrative View Based on vps29 Proteomics and Metabolomics Previous studies demonstrated that vacuolar sorting receptor (VSR) proteins are
Whereas the published applications in the field of toxicology still remain proof-of-concept studies, due to the complexity and multifactorial origin of toxicity, the
Whereas human studies keep reporting evidence that acetaldehyde accumulation prevents alcohol drinking and alcoholism, animal studies support a rewarding rather than
This study used a sample of middle aged and old European, whereas previous pan- European studies focusing on socioeconomic differences in alcohol consumption frequently used
We conclude that despite encouraging data from previous microarray studies assessing non-neural tissues, the lack of a convergent set of differentially expressed genes associated
