O
pen
A
rchive
T
OULOUSE
A
rchive
O
uverte (
OATAO
)
OATAO is an open access repository that collects the work of Toulouse researchers and
makes it freely available over the web where possible.
This is an author-deposited version published in :
http://oatao.univ-toulouse.fr/
Eprints ID : 14083
To link to this article : doi:
10.1016/j.surfcoat.2013.06.014
URL :
http://dx.doi.org/10.1016/j.surfcoat.2013.06.014
To cite this version : Aviziotis, Ioannis G. and Cheimarios, Nikolaos
and Vahlas, Constantin and Boudouvis, Andreas G. Experimental and
computational investigation of chemical vapor deposition of Cu from
Cu amidinate. (2013) Surface and Coatings Technology, vol. 230. pp.
273-278. ISSN 0257-8972
Any correspondance concerning this service should be sent to the repository
administrator:
staff-oatao@listes-diff.inp-toulouse.fr
Experimental and computational investigation of chemical vapor
deposition of Cu from Cu amidinate
Ioannis G. Aviziotis
a, Nikolaos Cheimarios
a, Constantin Vahlas
b, Andreas G. Boudouvis
a,⁎
aSchool of Chemical Engineering, National Technical University of Athens, Zografou Campus, Athens 15780, Greece bUniversité de Toulouse, CIRIMAT, 4, allée Emile Monso, BP-44362, 31030 Toulouse Cedex 4, France
a b s t r a c t
Keywords: Copper deposition Copper amidinate Arrhenius Langmuir–Hinshelwood Incubation Ansys/FluentExperiments and computations are performed for the Cu MOCVD from copper(I) N,N′-di-isopropylacetamidinate [Cu(iPr–Me–amd)]
2or [Cu(amd)]2where amd = CH(CH3)2NC(CH3)NCH(CH3)2. The a priori choice of this pre-cursor is dictated mainly by its oxygen and halogen–free ligands allowing co-deposition with oxophilic elements such as Al and by its ability to provide conformal Cu films in atomic layer deposition processes. The nucleation delay and the deposition rate as a function of deposition temperature and the evolution of the deposition rate along the radius of the substrate holder are experimentally determined with depositions performed at 1333 Pa in a vertical, warm wall, MOCVD reactor. With the aim to propose a kinetic scenario for Cu deposition, based on recently published experimental results for the decomposition of [Cu(amd)]2, a predictive 3D model of the process is built, based on the mass, momentum, energy and species transport equations. In agreement with the previously mentioned experimental results, it is demonstrated that a single surface reaction is responsible for the deposition of Cu. Two surface kinetics expressions are implemented depending on the deposition regime; a simple Arrhenius type expression in the reaction limited regime and a Langmuir–Hinshelwood type expression prevailing in the transport limited regime which takes into account the inhibition effects. The two different kinet-ics designate a modification in the surface reaction mechanism. The results show good agreement between ex-periments and computations. Complementary computations are performed, in order to compare the deposition rates of the Cu films deposited via the [Cu(amd)]2and the (hfac)Cu(VTMS) and Cu(hfac)2so as to determine rel-ative advantages and disadvantages of Cu MOCVD from [Cu(amd)]2.
1. Introduction
Cu deposition from the gas phase often results in a nodular, loose microstructure which can be driven towards either thin films or nanoparticles, depending on the targeted application (often low elec-trical resistivity[1]and anti-bacterial properties[2], but also ductility, high thermal conductivity and strong resistance to electromigration). Metalorganic chemical vapor deposition (MOCVD) and atomic layer deposition (ALD) are often used for the processing of Cu films, be-cause they ensure film growth on complex surfaces with tunable mi-crostructure and deposition rate.
There are numerous precursors for the MOCVD of Cu but, to the best of the authors' knowledge not many satisfy specifications including low deposition temperature, oxygen and halogen–free ligands allowing codeposition with oxophilic elements such as Al, and ability to provide conformal Cu films. Relatively air-stable copper(I) amidinates were suc-cessfully studied as oxygen-free molecular compounds in ALD, aiming at the preparation of pure copper films. Based on the works of Lim et al.
[3,4]and Li et al.[5], we recently reported the results on the MOCVD
of copper(I) N,N′-diisopropylacetamidinate [Cu(i
Pr–Me–amd)]2 or
[Cu(amd)]2(amd = CH(CH3)2NC(CH3)NCH(CH3)2)[6–8], a Cu(I)
pre-cursor. Pure copper films were obtained in the temperature range 200 °C–350 °C at a total pressure of 1333 Pa, under high hydrogen/ precursor molar ratio. The process is characterized by a kinetically controlled regime below 240 °C with a predominant surface reaction between molecular hydrogen and the entire precursor molecule, followed by a diffusion limited regime for depositions in the temperature range 240 °C–350 °C. By using [Cu(amd)]2 and
dimethylethyl amine alane, we deposited Al–Cu films by sequential deposition followed by post deposition annealing[9,10]. Despite these experimental results there are still no investigations of the surface kinetics prevailing in the MOCVD of Cu from [Cu(amd)]2.
The present work aims at further consolidating the deposition of Cu by investigating the process through computational analysis and by comparing theoretical predictions with experimental results. The article is presented as follows. First, the experimental protocol involving MOCVD of Cu films is presented in detail, followed by the computational aspects of the present work. Then the experimental and theoretical results are presented and discussed. Finally, computa-tions for the deposition rates of two other precursors are presented and compared with [Cu(amd)]2, prior to providing concluding remarks.
⁎ Corresponding author. Tel.: +30 2107723241; fax: +30 2107723155. E-mail address:boudouvi@chemeng.ntua.gr(A.G. Boudouvis).
2. Experiments
Growth experiments of Cu films are performed in a vertical, cylindri-cal, stagnant flow, warm wall, stainless steel MOCVD reactor which has been described in detail in[11,12]. 5 × 10 × 1 mm3304 L stainless
steel coupons are used as substrates. They are polished with SiC disks to 4000 grit, cleaned in a supersonic bath with acetone and ethanol for 5 min and dried in Ar flow followed by residence in a furnace at 50 °C for 20 min. They are weighted in view of determining the deposi-tion rate based on mass gained during the experiment and immediately loaded in the reactor. In each experiment five substrates are placed at different radial positions on a 58 mm diameter susceptor heated by a resistance coil gyred just below the surface and positioned below a shower plate. Prior deposition, organic pollutants adsorbed on the sur-face of the substrates are being removed by a (Ar-10% H2) RF plasma
pretreatment[13]. The pretreatment conditions are: Ar-10% H2flow
rate of 100 standard cubic centimeters per minute (sccm), pressure of 293 Pa, substrate temperature in the range of 200 °C–350 °C depending on the experiment, emitted and reflected power of 80 and 30 W, re-spectively, and duration of 30 min.
[Cu(amd)]2, is synthesized by NanoMePS1by appropriately adapting
the protocol reported in[4]and is purified by vacuum sublimation at 100 °C before use. Despite its relatively light and air stability, [Cu(amd)]2is distributed in sealed ampoules and is manipulated in
glove box, to avoid gradual degradation and darkening that ambient air can cause, over a period of days[14]. It is loaded in an innovative compact sublimator (useful space is 2.6 cm3
), built from VCR fittings and schematically illustrated inFig. 1. The thermal regulation of this sublimator is convenient, resulting in reduced risk of side condensa-tion of the sublimed precursor. Its reduced dimensions allow intro-ducing it with its upper and lower isolation valves in a glove box, for air free precursor loading.
Pure nitrogen (99.998%) and a mixture of argon/hydrogen (10% hydrogen, Air Products) are fed through computer-driven mass flow controllers (MKS). Experiments are performed in fixed conditions, namely total pressure Ptot= 1333 Pa, precursor sublimation
temper-ature Tprec= 95 °C, and dilution N2(QN2,dilution), N2flow through the
precursor (QN2,prec) and Ar/H2(QAr/H2) flow rates equal to 50, 50, and
225 sccm, respectively. The adopted value of Tprecwas the one used in
the ALD experiments in[14]and corresponds to a saturated vapor pressure Psatof [Cu(amd)]2of 0.733 Pa[7]. Considering the relation
proposed by Hersee and Ballingal[15]these conditions yield a maxi-mum flow rate Qprecof [Cu(amd)]2, and a molar fraction in the input
gas equal to 2.7 × 10− 2 sccm and to 10− 4, respectively. The latter
value is relatively low compared with those typically used in CVD protocols, namely 10− 3to 10− 2. It could be increased by decreasing
Ptotor by increasing Tprec. However, the adopted value of the former
is technologically feasible without oversizing the vacuum equipment. Alternatively, the increase of Tprecfrom 95 °C to 110 °C results in a
fourfold increase of Psat. In this case we experienced precursor
de-composition in the sublimator and in the tubing between the sublimator and the reactor.
Fourteen independent experiments are performed at different temperatures, Ts,in the range 200 °C–350 °C. The deposition time
is 4 h in all experiments plus the time required for the nucleation to take place in each Ts. The nucleation delay corresponds to the
change of the color of the substrate's surface from gray metallic to red. It is evaluated by visual observation of the illuminated substrate surface through two windows mounted at the deposition chamber. Such observation does not provide precise determination of the nu-cleation delay. However, it does not lead to strongly erroneous deter-mination in view of the observed time scale. It is worth mentioning that these results are underexploited in the present work. Still,
they are useful in the detailed investigation of the surface reaction mechanism.
The deposition rate is evaluated directly by weight difference of the substrates before and after deposition. Three independent weight measurements are carried out for each substrate before and after the experiment, and an average value is calculated. The maximum devia-tion from this average value is estimated by the difference between the minimum measured value before the experiment and the maxi-mum measured value after the experiment, while the minimaxi-mum devi-ation is obtained by the difference between the minimum measured value after the deposition and the maximum measured weight before the deposition.
3. Computations
Aiming at understanding the mechanisms of Cu films growth, a predictive three-dimensional (3D) model of the MOCVD reactor is built, based on the governing equations describing the transport phe-nomena and chemical reactions inside the reactor: the continuity, the momentum, the energy and the species transport equation is the set of equations which, augmented with realistic boundary conditions, is discretized in 3D and solved with Ansys/Fluent[16,17]. This set of equation is described in detail in[16]and is omitted for the sake of brevity.
The properties of the individual species and of the mixture are com-puted as in[16]. The Lennard-Jones (LJ) parameters, namely σ and ε, are the parameters of the LJ potential and are needed for the estimation of the properties in the gas phase of the CVD reactor. σ is the measure of the size of the molecules and ε/k is a measure of how strongly the mol-ecules attract each other. For the unknown species, namely [Cu(amd)]2 1www.nanomeps.fr
Fig. 1. Schematic of the compact sublimator used for the generation of vapors of [Cu(amd)]2.
and H(amd), their values are calculated with group contribution methods [18] and for [Cu(amd)]2 are: σ = 10.8525Å and ε/k =
423.2 K and for H(amd): σ = 9.4874Å and ε/k = 534.8 K.
Concerning the boundary conditions, for the velocity: at the inlet of the reactor a constant mass inflow rate of 7.473 × 10− 6kg/s is imposed,
calculated from the total sccm of the mixture (seeSection 2). No-slip condition is imposed at all the walls of the reactor. At the outlet, a stan-dard outflow boundary condition[19]is used. For the temperature: the values are set as provided by the experimental determination by using a thermocouple positioned just below the surface of the susceptor. For the species: the mass fractions of the species entering the reactor are
y½Cu amdð Þ2¼ 0:001016, yH2 ¼ 0:004107 and yN2¼ 0:2556; the rest is
Ar. The flux of all species at the reactor walls is zero with an exception on the substrate where the surface reactions (deposition) take place. An overall mass balance correction[19]is imposed at the outlet. The op-erating pressure of the reactor is 1333 Pa. Mesh dependency study is performed in order for our results to be mesh independent.
3.1. Surface reaction kinetics
Experiments[20]in sub-atmospheric operating pressure, with the presence of H2, have shown that the most probable global surface
re-action is,
Cu amdð Þ
½ 2 gð Þþ H2 gð Þ→2Cuð Þs þ 2H amdð Þð Þg: ðS1Þ
In our computations, two different reaction expressions for the ki-netics are used, depending on the regime of deposition. In the reac-tion limited regime an Arrhenius type expression is implemented of the form, r ¼ k0exp − Ea RT C½Cu amdð Þ 2CH2: ð1Þ
The activation energy, Eais calculated from the slope of the
depo-sition curve in the reaction limited regime in the Arrhenius plot (see
Fig. 4inSection 4); its value comes out 66 kJ/mol. Based on the values
of the experimental deposition rates along the wafer for each temper-ature, k0was fitted to k0= 1.33 × 10¹⁰s− 1[kmol/m2s]. C½Cu amdð Þ2and
CH2 are the concentrations, in kmol/cm
3, of the precursor and of the
H2, respectively, in the gas phase of the CVD reactor, right above the
substrate's surface or, in computational terms, they are the concen-trations of the species in the face of the boundary cell of the discretized substrate's surface.
Beside the Arrhenius type expression, a Langmuir–Hinshelwood (hereafter denoted by LH) type kinetic expression is used in the diffu-sion limited regime. The choice of the LH expresdiffu-sion is based on the work of Wang et al.[21]. In their work, they derive an expression for the deposition of Cu from Cu(hfac)2based on experimental
mea-surements of the deposition rate in various operating conditions. Fol-lowing their assumptions, we use a LH expression for the deposition of Cu from [Cu(amd)]2which reads,
r ¼ k1kdC½Cu amdð Þ2CH2 2k1C½Cu amdð Þ 2þ k2CH amdð Þ ! þ kdCH2 ð2Þ
and takes into account the inhibition effects from H(amd). kd=
k0exp(−Ea/RT), k1= 0.07 [m/s] and k2= 0.01 [m/s] are fitted to
the experimental deposition rate profiles along the substrate's surface in the diffusion-limited regime.
4. Results and discussion
4.1. Films morphology and incubation time
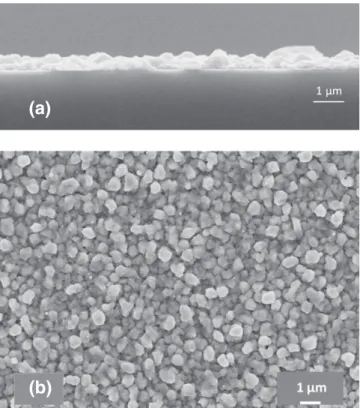
Fig. 2presents a surface and a cross sectional scanning electron
mi-croscopy micrographs of a Cu film deposited at 280 °C. Films present a smooth and uniform nodular morphology; a Volmer–Webber growth mechanism characteristic. The grain size is approximately 0.8 μm; it increases from 0.15 μm to 1 μm when deposition temperature is in-creased from 200 °C to 320 °C[7].
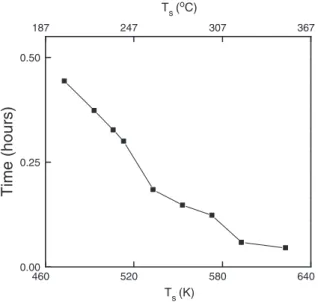
A sharp color transition from gray to red allows determination of the nucleation delay (incubation time).Fig. 3shows the evolution of the nucleation delay as a function of the processing temperature. A significant nucleation delay is observed for low deposition tempera-ture, which attains 27 min at 200 °C. It decreases almost linearly to 3 min at 350 °C and is stabilized at this value for higher deposition temperature. This behavior is attributed either to the difference in the sticking coefficients on the substrate and on the film nuclei which are already present on the surface, or to the desorption of the adsorbents[22]. The observed continuous decrease of the nucleation delay with the increase of the deposition temperature in low to mod-erate temperature range followed by stabilization at high deposition temperature was also observed in the case of CVD of Si[23].
An investigation of the nucleation delay as a function of the nature of the substrate and of the deposition temperature, in a Cu MOCVD process from (Cu(hfac)(VTMOS)), was reported by Hogn and Jeng
[24]. For a deposition temperature of 200 °C in the presence of H2,
the nucleation delay is 4.3 min and 88 min on Pt and TiN/Si sub-strates, respectively, to be compared with 27 min on plasma cleaned stainless steel substrates, reported here.
The nucleation delay relates to the efficiency of the surface functions and consequently the applied pretreatments and, more general, to the mechanisms which control nucleation and growth phenomena in CVD processes. Investigating these mechanisms is far beyond the scope
(b)
(a)
Fig. 2. (a) A surface and (b) a cross sectional scanning electron microscopy micro-graphs of a Cu film deposited at 280 °C.
of the present work, since the objective here is to precisely define depo-sition rates. Still, in a more applied frame, such an investigation could provide insight into the improvement of the microstructure of Cu films and on the deposition selectivity with regard to the nature of the underlying surface.
4.2. Surface reaction kinetics
Fig. 4shows the so-called Arrhenius plot – the deposition rate vs.
inverse substrate temperature diagram – constructed from the exper-imental measurements along with the computational predictions. The latter are obtained with the implementation of the Arrhenius type and the LH type expressions in all the regimes of deposition. The black solid squares are the experimental data obtained from the weight difference (seeSection 2) of the substrate located at a distance of 24 mm from the center of the susceptor's surface. The dashed curve corresponds to the computational results obtained from the
LH type expression (Eq.(2)and the solid curve represents the com-putational results from the Arrhenius type expression (Eq.(1).
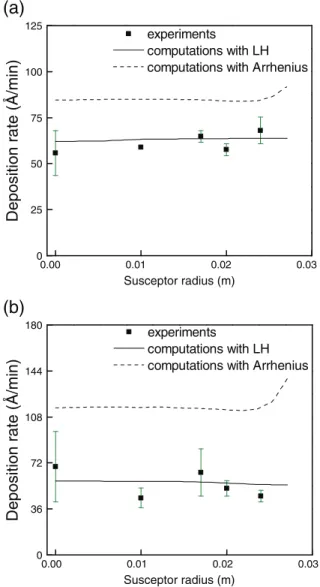
The agreement between experimental and predicted deposition rates is satisfactory at the temperature range of the reaction limited re-gime by implementing the Arrhenius type expression. InFig. 5the com-puted deposition rates along the susceptor's radius are compared with the experimental measurements for Ts= 473 Κ (first black square in
the Arrhenius plot ofFig. 4) and Ts= 493 K (second black square in
the Arrhenius plot ofFig. 4). The computed deposition rate inFig. 5a is lower compared to the experimental measurements. This can be attrib-uted to the overestimation of the incubation time (ca. 30 min) for this particular Tswhere the surface reaction rate is low. This may be the
rea-son for the first point in the Arrhenius plot to be at higher position com-pared to the others in the reaction limited regime. As Tsincreases, the
reaction rate increases and the error in the measurement of the incuba-tion time decreases. For Ts= 493 K the incubation time is
approximate-ly 20 min. The computed deposition rate in this case is in satisfactory agreement with the experiments in both the Arrhenius plot and along the susceptor's surface (seeFig. 5b). Notice that at the two particular temperature values (Ts= 473 K and Ts= 493 K), which are in the
re-action limited regime, the LH type expression fails to provide satisfacto-ry computational predictions. 460 520 580 640 0.00 0.25 0.50
Time (hours)
Ts (K) 187 247 307 367 Ts (oC)Fig. 3. Nucleation delay as a function of temperature.
0.0016 0.0018 0.0020 0.0022 2.80 3.28 3.76 4.24 4.72 5.20 experiments computations with LH computations with Arrhenius
1/Ts (1/K)
623 567 511 460
Ts (K)
Ln[deposition rate (Å/min)]
Fig. 4. Deposition rate of Cu films as a function of substrate's temperature, Ts;
experi-mental measurements and computational results are shown.
0.00 0.01 0.02 0.03 0 22 44 66 88 110
experiments
computations with LH
computations with Arrhenius
Deposition rate (Å/min)
Susceptor radius (m)
(a)
0.00 0.01 0.02 0.03 0 22 44 66 88 110experiments
computations with LH
computations with Arrhenius
Deposition rate (Å/min)
Susceptor radius (m)
(b)
Fig. 5. Deposition rate along the susceptor's radius for (a) Ts= 473 K and (b) Ts= 493 K
of the reaction-limited regime; experimental measurements and computational results are shown.
Based on the experimental data and the Arrhenius plot (seeFig. 4), in the high temperature region (240 °C–350 °C) a saturation of the measured deposition rate occurs. For that, we assume that this region corresponds to the diffusion limited regime. In the diffusion limited regime, as it can be seen inFig. 4of the Arrhenius plot, the Arrhenius type expression fails to predict the experimental results since it can-not capture the decrement of the deposition rate. Several reasons for the decrement of the deposition rate in the diffusion regime have been reported. Most common is the activation of volumetric re-actions in the gas phase of the reactor due to the high temperatures [11]which causes the depletion of the reactants in the gas phase. Other possible reasons are the etching of the surface from a secondary material[25], increased desorption rate of the precursor[25]and in-hibitions effects[21,26].
In the present case there are no volumetric reactions[20]. Still, to check the possibility of the activation of volumetric reactions in the dif-fusion limited regime due to the high temperatures, a fictitious but real-istic volumetric reaction was added in our model with the Arrhenius type expression which caused depletion of the precursor. Even if the de-position rate decreased, our results were far from the experimental measurements (not shown here). The etching of the surface has not been reported in the experiments. From mass spectroscopy experi-ments[20]there are no indications for increased desorption rate of [Cu(amd)]2.
In the diffusion limited regime, it is valid to assume that the mass fraction of the precursor approaches zero, since the surface reaction is very fast (high consumption rate of [Cu(amd)]2)[17]. Nevertheless,
ad-ditional computations with setting the mass fraction of [Cu(amd)]2to
zero on the substrate's surface and computing the deposition rate from the diffusion of [Cu(amd)]2to the substrate's surface[11]does
not fit the experimental data. The latter approach for the calculation of the deposition rate, does not take into account the diffusion of sec-ondary reactants — in our case the diffusion of H2from the bulk phase
of the CVD reactor to the substrate's surface. In order to include the ef-fect of H2diffusion on the calculation of the deposition rate, the method
proposed by Ulacia et al.[27]is implemented. Still, the predicted depo-sition rates were far from the experimental values.
The latter analysis shows that a sub-process is performed that “blocks” the consumption of [Cu(amd)]2in the diffusion limited
re-gime, leading to mass fractions of [Cu(amd)]2far from zero. In the
present work, this sub-process is assumed to be the inhibition effect from H(amd) — which the simple Arrhenius type expression neglects. Based on the work of Wang et al.[21], a LH expression (see Eq.(2)) with fitted parameters to our experimental data is used in our com-putations and takes into account this effect.Fig. 6a and b show the de-position rate along the susceptor's radius for two different Tsin the
diffusion limited regime with the Arrhenius and the LH expressions along with the experimental measurements. The LH kinetics pro-posed in this work predict the experimental results satisfactorily un-like the Arrhenius kinetics which, as Tsincreases, predict increment of
the deposition rate.
Additional computational results (not shown here) are obtained for a temperature value in the transition regime, namely Ts= 513 K. The
results show that the predictions by the Arrhenius and the LH expres-sions are very close to each other and to the deposition rate measured in the experiments; this is also indicated by the closeness of the corre-sponding points inFig. 4.
4.3. Comparison of [Cu(amd)]2with Cupraselect and Cu(hfac)2
Complementary computations are performed in order to roughly and qualitatively compare Cu CVD from [Cu(amd)]2to Cu CVD from two
well-known precursors, namely Cupraselect [(hfac)Cu(VTMS)][28]and copper (II) hexafluoroacetylacetonate Cu(hfac)2[21,26]. The operating
conditions used for all the three precursors are the same. The kinetics ex-pression for (hfac)Cu(VTMS) is an Arrhenius type exex-pression[28]and
for the Cu(hfac)2is a LH type expression[21,26]. The LJ parameters
need-ed for the computations are found from previous work[29]. The compar-ison concerns the deposition rates and the thickness uniformity of the resulting films. Two uniformity norms are examined. The first norm measures uniformity in terms of the maximum and minimum deposition rates along the wafer's radius. The second norm concerns the area (length) of the film over which the uniformity is 98% and higher (as mea-sured by the first norm). Both norms that are used in the analysis are de-fined in[30]. In all the cases, the simulated operating conditions are the same as in the case of [Cu(amd)]2.
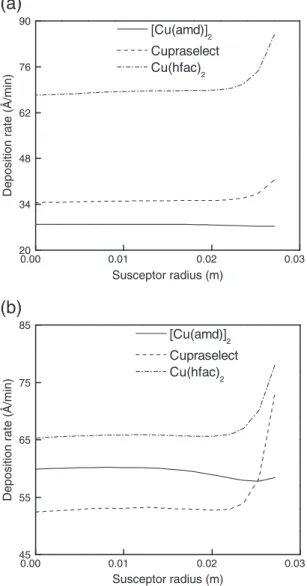
Fig. 7shows the deposition rate in the reaction (Ts= 473 K —Fig. 7a)
and the diffusion (Ts= 593 K —Fig. 7b) limited regimes. In the reaction
limited regime, the deposition rates obtained by using the two other pre-cursors are higher than the one of [Cu(amd)]2. However, the thickness
uniformity for the films processed obtained from [Cu(amd)]2appears
higher, especially at the edge of the substrate. This is confirmed by the numerical results reported inTable 1. It is also worth noting that in the diffusion limited regime the deposition rate of the films obtained by [Cu(amd)]2is higher than the one of Cupraselect but lower than the
one of Cu(hfac)2.
Still, the uniformity favors the use of [Cu(amd)]2even if the length
of the film obtained with 98% uniformity is a little smaller compared to the other precursors (seeTable 1).
0.00 0.01 0.02 0.03 0 25 50 75 100 125
experiments
computations with LH
computations with Arrhenius
Susceptor radius (m)
(a)
0.00 0.01 0.02 0.03 0 36 72 108 144 180experiments
computations with LH
computations with Arrhenius
Deposition rate (Å/min)
Deposition rate (Å/min)
Susceptor radius (m)
(b)
Fig. 6. Deposition rate along the susceptor's radius for (a) Ts= 553 K and (b) Ts= 623 K
of the diffusion-limited regime; experimental measurements and computational results are shown.
5. Conclusions
This work proposes a mechanistic investigation of the MOCVD of Cu from [Cu(amd)]2, a promising precursor for the processing of pure and
alloyed Cu films at low temperature. Cu CVD from [Cu(amd)]2is
investi-gated by means of experimental and computational analysis. Two surface reaction kinetics are proposed depending on the regime of deposition. The use of an Arrhenius expression for the deposition in the reaction lim-ited regime yields satisfactory agreement between experimental mea-surements and computational predictions but fails to predict the deposition rate in the diffusion limited regime. A Langmuir–Hinshelwood expression, which takes into account inhibition effects from H(amd), is used in the diffusion limited regime and it proves successful in reconciling
measurements with predictions. Complementary computations for the comparison of [Cu(amd)]2with two well-known precursors for Cu
depo-sition, namely cupraselect and Cu(hfac)2, show that [Cu(amd)]2favors
the deposition of uniform films compared to the other two precursors. Acknowledgments
We are indebted to Dr. Lyacine Aloui for the help with the experi-mental part. This work was supported by the General Secretariat for Research and Technology of Greece, by the French Ministry of Foreign Affairs through the Program for “Greece–France cooperation in Research and Technology” (contract 15207XG, 2006-08) and by the Erasmus Program for university students and staff mobility. The support of the Agence Nationale de la Recherche in France, through contract NT05-3_41834, and of the European Commission through the network of excellence NMP3-CT-2005-500140 are also acknowledged. References
[1] A. Yabuki, S. Tanaka, Mater. Res. Bull. 47 (2012) 4107–4111.
[2] J. Díaz-Visurraga, C. Daza, C. Pozo, A. Becerra, C.v. Plessing, A. García, Int. J. Nanomedicine 7 (2012) 3597–3612.
[3] B.S. Lim, A. Rahtu, R.G. Gordon, Nat. Mater. 2 (2003) 749–754.
[4] B.S. Lim, A. Rahtu, J.S. Park, R.G. Gordon, Inorg. Chem. 42 (2003) 7951–7958.
[5] Z. Li, A. Rahtu, R.G. Gordon, J. Electrochem. Soc. 153 (2006) C787–C794.
[6] V.V. Krisuyk, L. Aloui, N. Prud'homme, B. Sarapata, F. Senocq, D. Samélor, C. Vahlas, ECS Trans. 25 (2009) 581–586.
[7] V.V. Krisyuk, L. Aloui, N. Prud'homme, S. Sysoev, F. Senocq, D. Samélor, C. Vahlas, Electrochem. Solid St. 14 (2011) D26–D29.
[8] A. Tzortzinis, N. Cheimarios, T.C. Xenidou, A.G. Boudouvis, F. Senocq, B. Sarapata, L. Aloui, C. Vahlas, Proceedings of the 7th Panhellenic Congres on, Chemical Engineering, 2009.
[9] Th. Duguet, F. Senocq, L. Aloui, F. Haidara, D. Samélor, D. Mangelinck, C. Vahlas, Surf. Interface Anal. 44 (2012) 1162–1165.
[10] L. Aloui, Th. Duguet, F. Haidara, M.-C. Record, D. Samélor, F. Senocq, D. Mangelinck, C. Vahlas, Appl. Surf. Sci. 258 (2012) 6425–6430.
[11] T.C. Xenidou, A.G. Boudouvis, N.C. Markatos, D. Samélor, F. Senocq, N. PrudHomme, C. Vahlas, Surf. Coat. Technol. 201 (2007) 8868–8872.
[12] T.C. Xenidou, N. Prud'homme, C. Vahlas, N.C. Markatos, A.G. Boudouvis, J. Electrochem. Soc. 157 (2010) D633–D641.
[13] N. Korner, E. Beck, A. Dommann, N. Onda, J. Ramm, Surf. Coat. Technol. 76–77 (1995) 731–737.
[14] Z. Li, S.T. Barry, R.G. Gordon, Inorg. Chem. 44 (2005) 1728–1735.
[15] S.D. Hersee, J.M. Ballingall, J. Vac. Sci. Technol. A8 (1990) 800–804.
[16] N. Cheimarios, G. Kokkoris, A.G. Boudouvis, Chem. Eng. Sci. 65 (2010) 5018–5028.
[17] W.M. Deen, Analysis of Transport Phenomena, Oxford University Press, Oxford, 1998.
[18] R.C. Reid, J.M. Prausnitz, T.K. Sherwood, The Properties of Gases and Liquids, third edition McGRAW-HILL, New York, 1977.
[19] Ansys/Fluent v12.1sp1. Documentation, ANSYS Inc., 2009
[20] A. Turgambaeva, N. Prud'homme, V. Krisyuk, C. Vahlas, J. Nanosci. Nanotechnol. 11 (2011) 8198–8201.
[21] J. Wang, R.B. Little, W.G. Lai, G.L. Griffin, Thin Solid Films 262 (1995) 31–38.
[22] Y. Kajikawa, T. Tsuchiya, S. Noda, H. Komiyama, Chem. Vap. Depos. 10 (2004) 128–133.
[23] Y. Kajikawa, S. Noda, Appl. Surf. Sci. 245 (2005) 281–289.
[24] L.S. Hong, M.G. Jeng, Appl. Surf. Sci. 161 (2000) 149–154.
[25] K.L. Choy, Prog. Mater. Sci. 48 (2003) 57–170.
[26] D.-H. Kim, R.H. Wentorf, W.N. Gill, J. Electrochem. Soc. 140 (1993) 3267–3272.
[27] J.I. Ulacia, S. Howell, H. Korner, Ch. Werner, Appl. Surf. Sci. 38 (1989) 370–385.
[28] W.Y. Chung, D.H. Kim, Y.S. Cho, J. Cryst. Growth 180 (1997) 691–697.
[29] H. Wolf, J. Rober, S. Riedel, R. Streiter, T. Gessner, Microelectron. Eng. 45 (1999) 15–27.
[30] N. Cheimarios, E.D. Koronaki, A.G. Boudouvis, Chem. Eng. J. 181–182 (2012) 516–523. 0.00 0.01 0.02 0.03 20 34 48 62 76 90
(a)
Susceptor radius (m)[Cu(amd)]
2Cupraselect
Cu(hfac)
2 0.00 0.01 0.02 0.03 45 55 65 75 85(b)
Deposition rate (Å/min)
Deposition rate (Å/min)
Susceptor radius (m)
[Cu(amd)]
2Cupraselect
Cu(hfac)
2Fig. 7. Comparison among computed deposition rates obtained with three different precursors for (a) Ts= 473 K in the reaction-limited regime and (b) Ts= 593 K.
Table 1
Computed uniformity of Cu film from the three precursors.
473 K 593 K
Uniformity 98% uniformity Uniformity 98% uniformity [Cu(amd)]2 97.5% 25 cm 96% 20 cm
Cupraselect 83% 20 cm 72% 22.5 cm Cu(hfac)2 78% 17 cm 84% 22.5 cm
![Fig. 1. Schematic of the compact sublimator used for the generation of vapors of [Cu(amd)] 2.](https://thumb-eu.123doks.com/thumbv2/123doknet/3548606.103914/3.892.470.813.115.590/fig-schematic-compact-sublimator-used-generation-vapors-cu.webp)