UNIVERSITÉ DE LILLE
FACULTE DE MÉDECINE HENRI WAREMBOURG
Année : 2019T H È S E P O U R L E D I P L O M E D ' É T A T D E D O C T E U R E N M É D E C I N E
Impact de l’immunothérapie anti-PD-1 sur l’homéostasie et le profil
métabolique des cellules immunitaires de patients atteints d’un
mélanome métastatique : étude translationnelle prospective
Présentée et soutenue publiquement le 18 décembre 2019 à 18 heures
Au Pôle Recherche
par Marie LAMIAUX
_______________
JURY
Président :
Monsieur le Professeur Laurent MORTIER
Assesseurs :
Madame le Professeur Delphine STAUMONT-SALLÉ
Monsieur le Professeur Philippe MARCHETTI
Madame le Docteur Paola CORAZAO-ROZAS
Directeur de thèse :
Madame le Professeur Nadira DELHEM
Travail du Laboratoire d’
Immunorégulation des Cancers
Viro-induits (IRCV), équipe 6, UMR 8161, Institut de Biologie de Lille,
coordonné par le Professeur Nadira Delhem
Avertissement
La Faculté n'entend donner aucune approbation aux opinions émises dans les thèses : celles-ci sont propres à leurs auteurs.
1
T
2
TABLE DES MATIÈRES ... 1
ABRÉVIATIONS ... 4
RÉSUMÉ ... 6
INTRODUCTION ... 8
I] Mélanome : épidémiologie ... 9
II] Traitements actuels du mélanome ... 9
III] Immunothérapies anti-immune checkpoints ... 11
A) L’anti-CTLA-4 ... 11
B) Les anti-PD-1 ... 13
IV] Résistance aux immunothérapies anti-PD-1 ... 14
V] Impact de PD-1 sur le métabolisme et sur la fonction lymphocytaire T ... 18
VI] Rôle de la reprogrammation métabolique sur les populations immunitaires ... 22
VII] Le métabolisme : potentiel biomarqueur et voie thérapeutique en Oncologie ... 24
ARTICLE ... 26
Study design and patients ... 30
Flow Cytometry Assays ... 30
Seahorse Metabolic Assays ... 32
DAS-ELISA ... 32
Purification of RNA using Trizol reagent ... Erreur ! Signet non défini. Reverse transcriptase ... Erreur ! Signet non défini. Real time quantitative polymerase chain reaction (q-PCR) ... Erreur ! Signet non défini. Statistical analysis ... 33
3
Patient characteristics... 34
Biological characteristics ... 34
Early modification of immune monitoring following the introduction of anti-PD-1 immunotherapy ... 35
Modification of the metabolic profile of immune populations under anti-PD-1 immunotherapy ... 37
OCR/ECAR ratio correlates with anti-tumor response ... 39
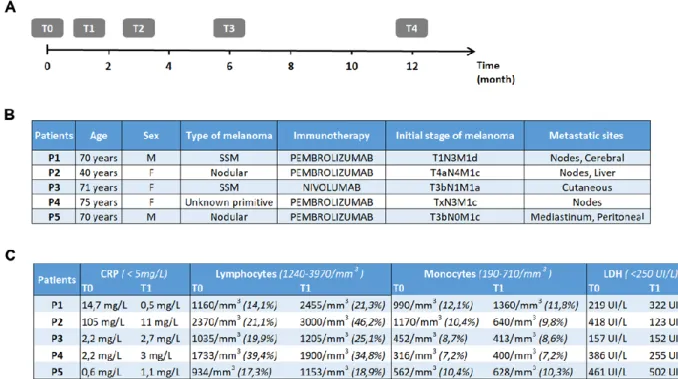
Figure 1: Study procedure timeline and clinicobiological features. ... 44
Figure 2: Immune and cytokine profile ... 45
Figure 3: Analysis of the metabolic changes of immune populations ... 46
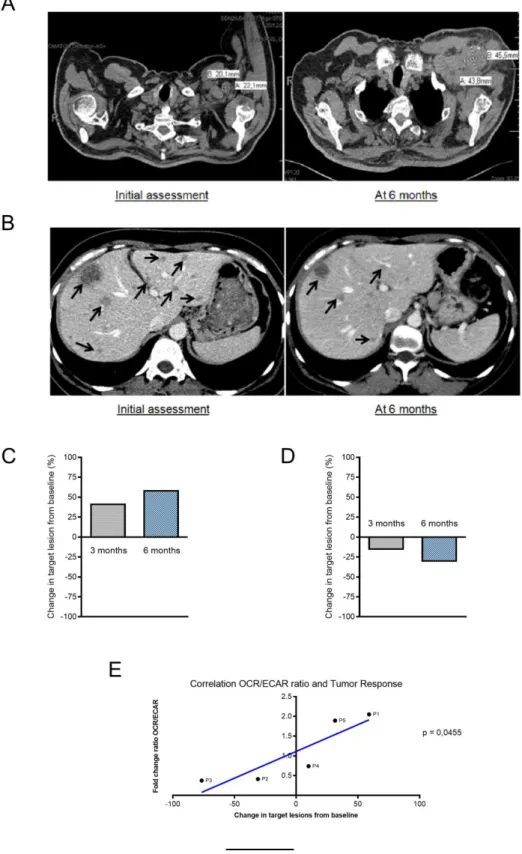
Figure 4: Analysis of the correlation between the evolution of the tumor response and the metabolic modifications. ... 47
Supplementary Figures. ... 48
DISCUSSION ... 54
CONCLUSION ... 62
PERSPECTIVES ... 64
I] L’immunométabolisme : nouvelle cible thérapeutique anti-cancéreuse ... 65
II] Impact des associations ou des traitements séquentiels utilisés dans le mélanome ... 66
BIBLIOGRAPHIE ... 69
ANNEXES ... 79
Annexe 1 : Classification du mélanome par l’AJCC, 8ème édition ... 80
Annexe 2 : Amendement au projet MELBASE validé par le CPP ... 81
4
A
5 AJCC: American Joint Committee on Cancer
Akt/PKB: Protein Kinase B
AMM : Autorisation de Mise sur le Marché AMPK: AMP-activated protein Kinase ATP: Adénosine TriPhosphate
BRAF: B isoform Rapidly Accelered fibrosarcoma CD: Cluster of Differenciation
CHRU : Centre Hospitalier Régional Universitaire CMH : Complexe Majeur d’Histocomptabilité CPA : Cellule Présentatrice d’Antigène CRP : C-Reactive Protein
CT- scan: Computerized Tomography - scan
CTLA-4: Cytotoxic T-Lymphocyte-Associated protein 4
DAS-ELISA: Double Antibody Sandwich Enzyme- Linked Immunosorbent Assay
DNA: DeoxyriboNucleic Acid
ECAR: Extracellular Acidification Rate
FCCP: Carbonyl Cyanide-4- Phenylhydrazone FOXP3: FOrkhead boX P3
GAPDH : D-Glyceraldehyde-3-Phosphate Deshydrogenase
GLUT-1 : Transporteur de glucose de classe 1 HIF1α : Hypoxia-Inducible Factor 1- Alpha IL : Interleukine
IFNγ : Interferon Gamma
LAG3 : Lymphocyte-Activation Gene 3 LDH: Lactate deshydrogenase
MAP Kinases: Mitogen Activated Protein Kinases MDSCs: Myeloid-Derived Suppressor Cells
MEK: Mitogen-activated Extracellular signal regulated Kinase
MRI: Magnetic Resonance Imaging
mTORC1: mammalian Target Of Rapamycin Complex 1 Myc: Myelocytomatosis virus oncogene
NK: Natural Killer
PBMCs: Peripheral Blood Mononuclear Cells PBS: Phosphate Buffered Salin
PD-1: Programmed cell Death 1
PD-L1/2: Programmed Death-Ligand ½ PGC-1α: Peroxisome proliferator activated receptor Gamma Coactivator -1 Alpha PI3K: PhosphoInositide 3- Kinase OCR: Oxygen Consumption Rate OXPHOS: PHOSphorylation OXydative
q-PCR: quantitative Polymerase Chain Reaction RECIST: Response Evaluation Criteria In Solid Tumors RNA: RiboNucleic Acid
RPM: Revolutions Per Minute RT: Room Temperature
SSM: Superficial Spreading Melanoma TCR: T Cell Receptor
TGFβ: Transforming Growth Factor Beta TILs: Tumor-Infiltrating Lymphocytes
TIM3: T-cell Immunoglobulin and Mucin-domain
containing-3
TNFα: Tumor Necrosis Factor Alpha
Tregs: lymphocytes T régulateurs
6
R
7
Contexte : Depuis 2011, le traitement du mélanome métastatique a connu une
révolution avec l’instauration des anti-immune checkpoints. Malheureusement, 60 à 70% des patients montrent une résistance innée ou acquise sous anti-PD-1. Aucun biomarqueur prédictif n’existe à ce jour pour déterminer de manière précoce la réponse au traitement. Or, de nouvelles données montrent un lien entre les modifications métaboliques et l’acquisition des fonctions des cellules immunitaires et pourraient être utilisées comme potentiel biomarqueur de la réponse anti-tumorale.
Méthodes : Il s’agit d’une étude prospective et translationnelle menée dans le
service de Dermatologie du CHRU de Lille dirigé par le Professeur Mortier. Les analyses ont été réalisées au sein de l’UMR 8161 – Mechanisms of Tumorigenesis
and Targeted Therapies à l’Institut de Biologie de Lille dirigé par le Professeur
Delhem en collaboration avec l’équipe du Professeur Marchetti au sein de l’UMR-S-1172 au Centre de Recherche Jean-Pierre Aubert. Etaient inclus, tous les patients porteurs d’un mélanome avancé, traités par immunothérapie anti-PD-1. Des prélèvements sanguins étaient réalisés avant traitement et à 3 semaines d’une première cure. La réponse tumorale était évaluée à 3 et 6 mois de l’immunothérapie.
Résultats : De mars 2018 à mars 2019, cinq patients ont été inclus. Il semblerait que
les patients ayant une réponse ou une stabilité de la maladie à 6 mois de l’immunothérapie anti-PD-1 présentent une augmentation de fréquence lymphocytaire dès la première cure. Nous avons mis en évidence à 3 semaines de l’anti-PD-1, une élévation précoce de la capacité de réserve respiratoire chez les patients présentant une réponse à l’immunothérapie tandis que les patients non-répondeurs ou en stabilité de la maladie ne présentent pas de modifications. De façon très intéressante, nous avons également identifié des modifications précoces du ratio OCR/ECAR dès un cycle d’anti-PD-1, à partir des PBMCs des patients et qui sont corrélées de manière linéaire et significative à la réponse tumorale à 6 mois (p= 0,045).
Conclusion : L’évaluation du ratio OCR/ECAR à partir des PBMCs de patients
pourrait facilement être réalisée en pratique clinique et être utilisée comme potentiel marqueur de réponse précoce aux anti-PD-1. En cas de validation de ces données, cela permettrait une adaptation thérapeutique rapide chez les patients non-répondeurs et ainsi augmenter les chances de survie. Il s’agirait d’une aide dans l’évaluation de nouveaux protocoles thérapeutiques, comme les combinaisons ou traitements séquentiels dans le mélanome, voire s’appliquer à d’autres types de cancers traités par anti-PD-1.
8
I
9
I] Mélanome : épidémiologie
Le mélanome est un cancer développé à partir des mélanocytes et se localise en majorité sur la peau, mais peut également atteindre les muqueuses. Sur le plan épidémiologique, plusieurs facteurs de risque individuel ont été identifiés tels que l’exposition solaire ou à des sources artificielles d’ultraviolet (UV), le nombre de naevi, le phototype et les facteurs génétiques (1). Le mélanome est un problème de santé publique avec 287 723 nouveaux cas chaque année dans le monde causant 60 712 décès selon l’analyse statistique globale des cancers en 2018 (2). En France, l’Institut National de Veille Sanitaire estime la prévalence du mélanome, en 2018, à 15 513 nouveaux cas et 1 975 décès par an (3). L’incidence du mélanome a nettement augmenté entre 1990 et 2018 en France, elle a été multipliée par un facteur 5 chez l’homme et par un facteur 3 chez la femme, cette augmentation concerne surtout les mélanomes de faible épaisseur (3). Avant l’ère des nouveaux traitements, son pronostic au stade avancé, correspondant au stade non résécable (IIIC/IIID) et au stade métastatique (IV) selon la classification de l’American Joint
Committee on Cancer (AJCC) 8ème édition (Annexe 1), était redoutable avec une survie globale estimée à 15% à 5 ans (4).
II] Traitements actuels du mélanome
Depuis 2011, la prise en charge thérapeutique du mélanome avancé a connu une véritable révolution avec la mise en évidence de mutations activatrices du gène B
isoform Rapidly Accelered Fibrosarcoma (BRAF) présentes dans plus de 50% des
mélanomes cutanés et ayant permis le développement des thérapies ciblées. BRAF est une kinase qui fait partie de la voie de signalisation des Mitogen Activated Protein
10
Kinases (MAPKinases) et joue un rôle dans la différenciation, la prolifération et la
survie cellulaire. En cas de mutation, cette voie est alors constitutivement active et devient un support de la tumorigenèse. Il existe 3 molécules ciblant spécifiquement la mutation BRAFV600 qui sont le dabrafénib, le vémurafénib et l’encorafénib. Du fait de la survenue inéluctable d’une résistance acquise après quelques mois de monothérapie ciblée, il a été développé secondairement les anti-MEK
(Mitogen-activated Extracellular signal regulated Kinase) ciblant la kinase MEK en aval de RAF
avec 3 molécules : le tramétinib, le cobimétinib et le binimétinib, actuellement administrés en combinaison aux anti-RAF.
En parallèle, les immunothérapies ont été développées et ne ciblent pas cette fois la cellule tumorale mais visent plutôt l’activation du système immunitaire du patient. Il s’agit d’anticorps monoclonaux dont le but est de bloquer les points de contrôle immunitaires ou « immune checkpoints ». Deux molécules d’immunothérapie ont obtenu une indication dans le mélanome avancé qui sont l’anti-Checkpoint cytotoxic
T lymphocyte associated antigen 4 (CTLA-4) et les anti-Programmed cell death 1 (PD-1).
Récemment, il a été développé dans le mélanome une nouvelle immunothérapie spécifique qui est la virothérapie oncolytique. Il s'agit d'injecter un virus oncolytique le laherparepvec talimogène (T-VEC), virus de l’herpès simplex de type 1 génétiquement modifié dont la caractéristique est de se répliquer sélectivement dans les cellules tumorales entraînant une lyse tumorale avec libération d’antigènes tumoraux (5,6). De plus, ce virus a la capacité d'exprimer le GM-CSF permettant en parallèle une stimulation de la réponse immunitaire (5,6). Ce traitement est actuellement en cours d'étude en association avec les inhibiteurs d'immune checkpoints anti-CTLA-4 et anti-PD-1.
11
III] Immunothérapies anti-immune checkpoints
A) L’anti-CTLA-4
Le mélanome est, en effet, un des principaux cancers où l’impact du système immunitaire est majeur après les cancers viro-induits. Il a été rapporté effectivement plusieurs cas de régressions spontanées de mélanomes pouvant dans certains cas s’accompagner de manifestations auto-immunes comme par exemple le vitiligo. Les points de contrôle immunitaire sont des voies inhibitrices physiologiques du système immunitaire et sont indispensables pour le maintien de la tolérance du soi, en limitant la réponse immunitaire effectrice, dans le but de minimiser les dommages collatéraux aux tissus et ainsi sauvegarder l’homéostasie immunitaire. Cette homéostasie est un équilibre complexe entre les signaux activateurs et les signaux inhibiteurs reçus par les lymphocytes, en cas de déséquilibre vers l’activation le risque est l’apparition de maladies auto-immunes alors qu’un déséquilibre vers l’inhibition favorisera le développement d’infections ou de cancers. Il a d’ailleurs été montré que les cellules cancéreuses pouvaient utiliser ces voies de contrôle immunitaire dans le but de freiner la réponse immune anti-tumorale et ainsi échapper à l’immunosurveillance.
L’ipilimumab est un anticorps monoclonal ciblant le récepteur CTLA-4, c’est la première immunothérapie à obtenir une Autorisation de Mise sur le Marché (AMM) dans le mélanome métastatique en 2011. Le CTLA-4 est un récepteur exprimé de manière transitoire lors de l’activation des lymphocytes T CD8+
cytotoxiques(Cluster
of Differenciation) mais également des T CD4+ auxiliaires. L’activation lymphocytaire
est effective après réception de trois signaux, le premier étant la reconnaissance de l’antigène au sein du complexe majeur d’histocomptabilité (CMH) exposé par la cellule présentatrice d’antigène (CPA) au T Cell Receptor (TCR) à la surface du
12
lymphocyte, le second signal est la synapse entre les ligands CD80/CD86 exprimés par la CPA et le CD28 présenté par le lymphocyte, enfin le dernier signal est celui des cytokines en particulier l’Interleukine 2 (IL-2). Le signal de co-stimulation via le CD28 entraîne l’augmentation de l’expression du CTLA-4 permettant un équilibre entre les signaux activateurs et inhibiteurs. En effet, les ligands du CTLA-4 sont les mêmes que pour le CD28, c’est-à-dire le CD80 et le CD86 exprimés à la surface des CPA. Cependant, l’affinité du CTLA-4 pour le CD80/CD86 est 500 à 2 500 fois plus élevée que celle du CD28 favorisant le signal inhibiteur au dépend du signal de co-stimulation et modulant ainsi de manière précoce l’activation lymphocytaire au sein des organes lymphoïdes secondaires (7,8). Dans le cadre du cancer, l'équilibre entre les signaux de co-stimulation et les signaux de co-inhibition peut être altéré en faveur des signaux inhibiteurs via le signal par le CTLA-4 des lymphocytes T. Il a été montré que ce signal entraînait une diminution de sécrétion d’IL-2, un défaut d'expression du récepteur à l'IL-2 mais également un blocage lors de la phase de division cellulaire en phase G1/S caractérisant l’état d'anergie (9). Ces voies physiologiques d'inhibition de la réponse immunitaire sont donc utilisées par les cellules tumorales afin d'échapper au système immunitaire et constituent un des mécanismes d'échappement. Par ailleurs, les lymphocytes T régulateurs (Tregs) ont une expression constitutive du récepteur CTLA-4 qui joue également un rôle majeur dans la régulation des fonctions immunosuppressives (7). Ainsi, l’anticorps anti-CTLA-4 en bloquant la synapse entre le récepteur membranaire CTLA-4 et les ligands CD80/CD86 a pour but d’amplifier l’activation lymphocytaire et inhiber l’activité immunosuppressive des Tregs, favorisant ainsi la réponse immunitaire anti-tumorale.
Cependant, du fait d’un impact sur les phases précoces de l’activation immunitaire et donc d’une action peu spécifique, l’immunothérapie anti-CTLA-4
13
présente un mauvais profil de tolérance avec l’induction de nombreuses manifestations auto-immunes parfois sévères avec une incidence de 72% d’effets indésirables de tous grades et de 24% de grades sévères (grade ≥ 3) (10). Concernant les résultats obtenus sous ipilimumab, le taux de réponse était de 19% et le taux de survie était de 2,8 mois (11). Actuellement, dans le mélanome avancé, l’anticorps anti-CTLA-4 est proposé en première ligne en combinaison avec le nivolumab (anti-PD-1) permettant un taux de réponse plus élevé de 58% et un taux de survie de 11,5 mois (11).
B) Les anti-PD-1
A l’heure actuelle, il existe 2 anticorps monoclonaux anti-PD-1 : le nivolumab et le pembrolizumab. Ces molécules inhibent la glycoprotéine transmembranaire PD-1 exprimée à la surface de plusieurs cellules immunitaires dont les lymphocytes TCD4+/CD8+, les Tregs, les cellules dendritiques et les cellules NK (Natural Killer), son profil d’expression est donc bien plus large que celui du CTLA-4. Il s’agit d’un récepteur inhibiteur qui intervient plus tardivement, lors de la phase effectrice de la réponse immunitaire. Cette glycoprotéine interagit avec les ligands PD-L1 et PD-L2
(Programmed Death-Ligand 1/2) exprimés dans les tissus périphériques mais
également par les cellules tumorales. La liaison entre PD-1 et PD-L1 interfère sur plusieurs voies de signalisation du lymphocyte T notamment sur sa capacité à sécréter des cytokines effectrices, sa capacité de survie et son métabolisme. L’anti-PD-1 peut également favoriser la réponse immunitaire anti-tumorale en impactant la prolifération et les fonctions immunosuppressives des Tregs.
14
Il a été montré que les immunothérapies anti-PD-1 améliorent significativement la survie globale des patients avec un taux de réponse objectif de 32,9% pour le pembrolizumab (12) et de 40% pour le nivolumab (13) et une survie globale à 1 an de 72,9% pour le nivolumab (13) et de 68,4% pour le pembrolizumab (12). Ces deux molécules ont obtenu l’AMM dans le mélanome avancé depuis 2014 avec actuellement une indication en première ligne en monothérapie.
IV] Résistance aux immunothérapies anti-PD-1
Malheureusement, le taux de résistance innée aux immunothérapies anti-PD-1 est élevé et concerne 60% à 70% des patients atteints d’un mélanome métastatique (14). De plus, la proportion des patients présentant une réponse initiale aux anti-PD-1 et qui obtiennent une réponse à long terme reste faible : entre anti-PD-10 et 30% en lien avec des mécanismes de résistance acquise par les cellules tumorales (15–17). Beaucoup d’études ont été réalisées pour tenter de comprendre quels sont les marqueurs de réponse à l’immunothérapie anti-PD-1. Cependant, peu de réponses ont été apportées du fait d’une hétérogénéité génétique du mélanome mais également à cause de la complexité des interactions entre le système immunitaire et les cellules tumorales. En effet, il existe plusieurs facteurs de résistance identifiés aux anti-PD-1. Par exemple, il a été montré que les cellules cancéreuses possédaient un récepteur à l’Interferon Gamma (IFNɣ) et pouvaient donc s’adapter à la réponse immunitaire effectrice car lorsque le signal à l’IFNɣ est reçu par la cellule tumorale, cette dernière exprime PD-L1 afin de freiner le système immunitaire via la synapse inhibitrice entre PD-L1 et PD-1 à la surface des lymphocytes (Fig.A). Ce mécanisme est accessible à l’immunothérapie anti-PD-1, cependant, les cellules
15
cancéreuses ont une importante capacité d’adaptation et peuvent perdre l’expression des récepteurs à l’IFN et ainsi de PD-L1 permettant d’échapper au traitement (18).
Figure A. Mécanisme de résistance adaptatif à l’immunothérapie anti-PD-1 par perte d’expression de
PD-L1 par les cellules cancéreuses d’après l’article d’Anusha Kalbasi et al. Nature, 2019.
Plusieurs études sur le mélanome et sur d’autres types de cancer ont mis en évidence l’importance de la présence d’une forte densité de Tumor-Infiltrating
Lymphocytes/TILs CD8+ cytotoxiques et son association à une meilleure survie chez les patients (19–21). Par ailleurs, le microenvironnement tumoral a un impact majeur dans la répression de la réponse effectrice lymphocytaire notamment par la présence de populations immunosuppressives telles que les Tregs, les myeloid-derived suppressor cells (MDSCs) et les macrophages M2 qui vont émettre des signaux inhibiteurs notamment par la sécrétion de cytokines IL-10 et TGBβ (22). L’ensemble de ces signaux négatifs ainsi que l’exposition chronique et continue à des antigènes tumoraux provoquent une surexpression de récepteurs inhibiteurs en particulier PD-1
16
(22–24) mais également LAG3, CTLA-4, TIM3… sur les TILs. Ces récepteurs vont par compétition de l’ectodomaine avec le même ligand atténuer le signal des récepteurs co-activateurs. Ils vont également moduler des médiateurs intracellulaires atténuant les voies de signalisation activatrices à partir des récepteurs tels que le TCR et enfin vont induire l’expression de gènes inhibant la fonction effectrice (22). Ce phénotype cellulaire comportant donc une surexpression des récepteurs inhibiteurs, une diminution de sécrétion des cytokines effectrices (IL-2, IFNɣ) et une réduction de la fonction cytotoxique (22,23) caractérise l’état d’épuisement lymphocytaire encore appelé phénotype « exhausted ». Cet état lymphocytaire dysfonctionnel a été découvert tout d’abord dans le cadre des infections chroniques puis dans le cancer (22) où il a été montré que le nombre de récepteurs inhibiteurs était en lien avec le niveau d'épuisement des lymphocytes T (23,25). En effet, dans un modèle de cancer du colon, il a été mis en évidence que le niveau d'expression cellulaire de PD-1 des TILs CD8+ était inversement corrélé à la fonction cellulaire (26). Alors qu’il a été montré dans le mélanome, que les clones de cellules T PD-1+
correspondaient aux cellules T spécifiques de l'antigène avec une avidité et une importante réactivité fonctionnelle avec la sécrétion d'IFNγ et de Tumor Necrosis Factor Alpha (TNFα) après activation par rapport aux clones de cellules T PD-1− (27). Il semblerait que c’est plutôt le niveau d’expression élevé de PD-1 qui reflète l’état d’épuisement avancé des lymphocytes. En effet, il a été montré dans un modèle murin d’infection chronique que les lymphocytes PD-1hi
CD8+ étaient incapables de restaurer leur fonction effectrice et dans la majorité des cas rentraient en apoptose après instauration d’un anti-PD-L1 (28). Il a également été mis en évidence dans un modèle tumoral murin que les lymphocytes T CD8+PD-1hi ne répondaient pas à l’immunothérapie anti-PD-1 avec paradoxalement une augmentation du rapport
17
Treg/T CD8+ après traitement, contrairement, aux lymphocytes T CD8+PD-1lo qui étaient sensibles à l’anticorps anti-PD-1 (26), reflétant une interaction complexe entre le niveau d’expression de PD-1 et la fonctionnalité lymphocytaire T. En effet, en cas de niveau d'expression élevé et malgré le blocage de la synapse PD-1/PD-L1, les altérations métaboliques semblent dépassées et sont accompagnées d’un stress oxydatif élevé empêchant la reprise d’une activité anabolique et paralysant les fonctionnalités lymphocytaires de manière irréversible conduisant alors à une résistance aux anti-PD-1 (9). Plusieurs études ont mis en évidence des modifications transcriptionnelles et épigénétiques suggérant que le phénotype « exhausted » n'est pas simplement un état cellulaire de dysfonctionnement transitoire mais représente plutôt un état stable de différenciation lymphocytaire (29,30).Par ailleurs, Miller et son équipe ont montré qu’il existait deux sous-types différents de lymphocytes T CD8+ de phénotype « exhausted » : les « progenitor exhausted » et les « terminally exhausted » (31). Il a été montré dans des modèles murins que l’immunothérapie anti-PD-1 pouvait agir sur les lymphocytes T CD8+ au stade de « progenitor exhausted » mais pas au stade « terminally exhausted » qui est un état irréversible (Fig.B). Ainsi l’anti-PD-1 induit la prolifération et la différenciation des TILs de type « progenitor exhausted » dans le microenvironnement tumoral, conduisant à une augmentation des TILs « terminally exhausted » cytotoxiques, mais à durée de vie limitée (31). Il a été mis en évidence chez les patients atteints de mélanome avancé que la fréquence des T CD8+ de type « progenitor exhausted » est corrélée à une durée de réponse à l’immunothérapie plus longue (31).
18
Figure B. Les étapes d’acquisition du phénotype « exhausted », état réversible puis irréversible des TILs durant la tumorigenèse d’après l’article d’Andrea Schietinger et al. Cell, 2016.
V] Impact de PD-1 sur le métabolisme et sur la fonction lymphocytaire T
On sait que la différenciation des cellules T naïves en cellules T effectrices puis l’acquisition de son phénotype mémoire est corrélée à la capacité de la cellule T à reprogrammer son métabolisme afin d’assurer ses besoins énergétiques indispensables à l’acquisition de ses fonctionnalités (32,33). Les cellules T naïves/quiescentes comme les cellules T mémoires reposent principalement sur la phosphorylation oxydative (OXPHOS) qui est une voie efficace pour la production d'Adénosine TriPhosphate (ATP), en effet, 1 molécule de glucose génère 36 molécules d'ATP (32–34). Lorsqu’il existe une activation du lymphocyte T via le TCR, cela stimule plusieurs protéines telles que PI3K, Akt et mTOR permettant l’induction de l’anabolisme grâce à des facteurs de transcription comme Myc (Myelocytomatosis
virus oncogene) et HIF1 (facteur induit par l’hypoxie 1) (34). Il a été montré que
19
nécessaire à la prolifération des lymphocytes T et à la production de cytokines (35). De même, l’augmentation de la glycolyse et de l'absorption du glucose est corrélée à l’amélioration des fonctions effectrices après l'activation des cellules T (36).
L’activation lymphocytaire entraîne donc l’utilisation préférentielle de la glycolyse aérobie malgré son manque de rentabilité, 1 molécule de glucose générant 2 ATP. Cependant, elle a l’avantage de fournir une production rapide d’ATP et d’apporter les substrats nécessaires à la prolifération cellulaire assurant ainsi une multiplication rapide des lymphocytes T spécifiques aux antigènes tumoraux (32,37,38). La glycolyse est également essentielle à la production de cytokines effectrices puisqu’il a été montré que la GAPDH (D-Glyceraldehyde-3-Phosphate Deshydrogenase), une enzyme glycolytique, permettait la traduction de l’ARNm de l’IFNγ (38).
De même, le métabolisme des cellules cancéreuses se caractérise principalement par la glycolyse aérobie, cette particularité a été décrite par le Docteur Warburg qui obtient le prix Nobel en 1931 (39–41). En effet, sous l’action de proto-oncogène et/ou d’inhibition de gènes suppresseurs de tumeur, il existe une amplification du métabolisme anabolique des cellules tumorales qui vont consommer de manière accrue le glucose et la glutamine afin d’assurer leur besoin de croissance et de prolifération (40,42). Ainsi, au sein du microenvironnement tumoral, les cellules cancéreuses vont entrer en compétition avec les cellules T pour l’utilisation du glucose (34,43). Ce manque de glucose va alors altérer l’activation lymphocytaire et par conséquent diminuer leurs fonctions d'expansion, de différenciation et d'effecteur marqué par un défaut de sécrétion d’IFNɣ (44,45). Par ailleurs, la dérégulation du métabolisme des cellules tumorales crée un microenvironnement néfaste (Fig.C), caractérisé par un milieu hypoxique, acidosique et appauvri en éléments nutritifs comme le glucose, la glutamine et l'arginine, utilisés en grande quantité pour la
20
propre croissance tumorale limitant ainsi l’acquisition des fonctions lymphocytaires T qui ne peuvent plus assurer leur besoin bioénergétique (46). De plus, il a été montré que ces altérations métaboliques augmentaient l’expression de PD-1 des lymphocytes T et favorisaient leur différenciation en Tregs (38). PD-1 est donc un des marqueurs clés de l'état métabolique des cellules T reflétant indirectement leur capacité effectrice.
Figure C. La reprogrammation métabolique induite par l’activation des cellules T en périphérie et dans le microenvironnement tumoral en lien avec la réponse effectrice, d’après l’article de Kouidhi S et al.
Frontiers, 2017 (47).
Des études expérimentales ont montré que l'anti-PD-1 permettait d'augmenter les capacités glycolytiques ainsi que les fonctions effectrices des TILs (48,49). En effet, il a été montré que lorsque PD-1 se lie à son ligand PD-L1, cela entraîne des changements métaboliques au sein des TILs vers l’oxydation des acides gras au dépend de la voie de la glycolyse. Cet état métabolique est similaire à celui des
21
lymphocytes T mémoire et des Tregs immunosuppressives dont l’avantage est une élévation de la durée de vie cellulaire mais au dépend de sa fonction effectrice anti-tumorale (9).
Par ailleurs, il a également été constaté que l’immunothérapie anti-PD-1 avait une action en périphérie avec la prolifération de lymphocytes T CD8+PD-1+ dans le sang de patients atteints d'un mélanome ou d'un cancer du poumon (50,51). On ignorait encore récemment si les cellules T CD8+ en expansion provenaient de la périphérie ou étaient d’origine intra-tumoral. Cependant, l’équipe de Yost a constaté que la majorité des TILs possédait des TCR différents après traitement par anti-PD-1 par rapport à ceux retrouvés avant traitement (52), suggérant un recrutement de cellules T. Il a également été démontré qu’un nombre significatif de ces nouveaux lymphocytes spécifiques de la tumeur engagés par l’immunothérapie anti-PD-1 provenait du sang périphérique (52). Par conséquent, l’immunothérapie anti-PD-1 pourrait donc avoir un rôle de recrutement de nouvelles cellules T spécifiques de la tumeur à partir de la périphérie en plus du rôle d’amplification des TILs préexistants mais dont l’activation et l’épuisement chronique limitent significativement leur capacité de régénération (52,53). Une autre étude a identifié l'activation de clones de lymphocytes T CD8+ infiltrant la tumeur dans le sang périphérique d’un patient à la suite d'une immunothérapie anti-PD-1 (54). Yang a également montré que sur 10 clones principaux de cellules T infiltrant la tumeur, retrouvés chez des patients atteints d’un mélanome, ces derniers étaient facilement identifiables dans le sang après une immunothérapie anti-PD-1 (50). Ces données suggèrent la possibilité d’analyser les modifications induites par l’anti-PD-1 sur les cellules immunitaires indirectement à partir du sang périphérique du patient qui pourraient être le reflet des modifications en intra-tumorales.
22
VI] Rôle de la reprogrammation métabolique sur les populations immunitaires
Le récepteur PD-1 est également exprimé sur plusieurs cellules immunitaires telles que les cellules NK, NKT, les cellules B, les macrophages et certains sous-groupes de cellules dendritiques lors d’une réponse immunitaire (10). De même, il a été montré que lors de l'activation de ces différentes cellules immunitaires innées ou adaptatives, il existait également une reprogrammation métabolique, véritable support de la différenciation et de l’acquisition des fonctions cellulaires.
Tout d’abord, en ce qui concerne les macrophages, il en existe 2 types, les macrophages M1 qui sont importants pour la fonction cytotoxique, l’induction d’une réponse inflammatoire et la réponse aux dommages tissulaires. Ces macrophages consomment d’importante quantité de glucose avec libération de lactate et ont un taux de consommation d’oxygène bas en lien avec des altérations du cycle de Krebs (55–57). Il a été montré que lorsqu’on inhibait la glycolyse, cela conduisait à une diminution de la réponse inflammatoire avec une diminution de la sécrétion d’IL-1β (58). Au contraire, les macrophages M2 utilisent principalement la voie de l’OXPHOS
via la glutaminolyse pour assurer leur rôle anti-inflammatoire induisant une
suppression de la réponse immune (55,56). Ainsi, le fonctionnement métabolique médie la polarisation des macrophages ainsi que leur fonctionnalité.
Une étude récente a mis en évidence que les cellules NK issus de sang humain présentaient une augmentation de leur activité glycolytique et oxydative de manière significative après stimulation par IL-2 (59). Par ailleurs, il a été décrit que la production d'IFNγ par les cellules NK était altérée en présence d’inhibiteurs de la glycolyse (59,60). L'activation des cellules NK nécessite donc une reprogrammation métabolique médiée par mTORC1 favorisant ainsi la glycolyse, permettant d'assurer
23
la synthèse d’IFNɣ et l’expression de granzyme B nécessaire à leur fonction cytotoxique (61).
Pour les cellules dendritiques, la glycolyse est également importante lors de leur activation. En effet, elle est indispensable pour assurer la maturation, la migration et la phase de priming avec les cellules T. Il a été montré que l'inhibition de la glycolyse entraînait une réduction de l'expression des molécules de co-stimulation CD80 et CD86 des cellules dendritiques et par conséquent impactait l’activation lymphocytaire T (58). En phase de quiescence, ces cellules utilisent préférentiellement la phosphorylation oxydative pour assurer leurs besoins bioénergétiques.
Pour les Tregs, lors de l’activation immunitaire, le signal reçu via les TLR stimule la voie PI3K-Akt-Mtorc1 activant la voie de la glycolyse afin d’assurer la prolifération cellulaire (62). Cependant, il a été montré que l’induction de la glycolyse et la surexpression de Glut-1 s’accompagnaient d’une diminution de l’expression de Foxp3 (FOrkhead boX P3) et d’une altération des capacités immunosuppressives des Tregs (63). En effet, lorsqu’on inhibe la glycolyse, on restaure les fonctions immunosuppressives des Tregs (62). Par ailleurs, il a été montré que Foxp3 s’oppose à la signalisation de PI3K-Akt-mTORC1 et vise à diminuer le métabolisme anabolique en faveur du métabolisme oxydatif indispensable à l’acquisition des fonctions régulatrices des Tregs (62–64). Le métabolisme des Tregs est donc un processus dynamique régulé par différents signaux tels que le signal du TCR, les cytokines et la disponibilité des éléments nutritifs déterminant l’expansion et l’acquisition des fonctions suppressives.
24
VII] Le métabolisme : potentiel biomarqueur et voie thérapeutique en Oncologie
Il est maintenant admis que le métabolisme joue un rôle clé dans la différenciation et l’acquisition des fonctions des cellules immunitaires. Actuellement, de nombreuses équipes travaillent à l’élaboration de combinaisons alliant des médicaments ciblant le métabolisme avec des inhibiteurs de point de contrôle ou le transfert adoptif de cellules T métaboliquement pré-conditionnées afin d’avoir une action synergique dans le but d’améliorer l’efficacité thérapeutique. A l’heure actuelle, la différence de réponse à l’immunothérapie anti-PD-1 des patients atteints d’un mélanome métastatique, liée aux propriétés intrinsèques de la tumeur et à celles du système immunitaire, est encore du domaine de la recherche. Malheureusement, à ce jour, il n’existe aucun biomarqueur prédictif de la réponse à l’immunothérapie anti-PD-1 dans le mélanome. Il s'agit pourtant d'un élément crucial qui éviterait l’introduction d’une immunothérapie anti-PD-1 chez les patients non-répondeurs évitant ainsi les effets indésirables parfois sévères du traitement, permettant d’instaurer d’autres stratégies thérapeutiques et réduisant les coûts liés à la santé.
25
OBJECTIFS DE L’ÉTUDE
Il s’agit d’une étude translationnelle et prospective réalisée chez des patients atteints d’un mélanome métastatique et traités en première ligne par immunothérapie anti-PD-1 dans le service de Dermatologie du Centre Hospitalier Régional Universitaire (CHRU) de Lille du 1er mars 2018 au 1er mars 2019.
Les objectifs principaux de l’étude sont d’évaluer les modifications précoces suivant une cure d’immunothérapie anti-PD-1:
(i) Du phénotype et de la fonctionnalité des Peripheral Blood Mononuclear
Cells (PBMCs) circulants
(ii) Du métabolisme mitochondrial et énergétique des PBMCs circulants
Ces données seront corrélées à l’évolution clinique à 6 mois des patients dans le but d’identifier un ou plusieurs marqueurs prédictifs de la réponse anti-tumorale.
Les analyses ont été réalisées au sein de l’UMR 8161 – Mechanisms of
Tumorigenesis and Targeted Therapies à l’Institut de Biologie de Lille dirigé par le
Professeur Delhem en collaboration avec l’équipe du Professeur Marchetti au sein de l’UMR-S-1172 au Centre de Recherche Jean-Pierre Aubert.
26
A
27
Early Modification of the OCR/ECAR ratio under Anti-PD-1 Immunotherapy: A Potential Predictive Markers of PD-1 Response in Metastatic Melanoma M. Lamiaux(1)*, P. Corazao(1)*, O. Moralès(2,3,4), S. Magne(1), C.Milhem(2,3,4),V. Dziwniel(5), O.Ernst(6), J. Kluza(7), P. Marchetti(7), L. Mortier(1)* and N. Delhem(2,3,4)*
(1) Department of Dermatology, Claude Huriez hospital, CHU Lille, France (2) CNRS UMR 8161, IRCV laboratory, F-59000Lille, France
(3) Univ. Lille, UMR 8161 – M3T – Mechanisms of Tumorigenesis and Targeted Therapies, F-59000 Lille, France
(4) Institut Pasteur de Lille, F-59000 Lille, France
(5) Modern Languages Department, F-Villeneuve d'Ascq, France
(6) Department of Radiology, Claude Huriez hospital, CHU Lille, France
(7) Univ. Lille, Inserm, CHU Lille, UMR-S 1172 - JPArc - Centre de Recherche Jean-Pierre AUBERT Neurosciences et Cancer, F-59000 Lille, France
* Equally contributed authors
ABSTRACT
Since 2011, the treatment of metastatic melanoma has undergone a revolution with the introduction of anti-immune checkpoints. Unfortunately 60 to 70% of patients show innate or acquired resistance to anti-PD-1. At present, no predictive biomarker exists to determine the response to this treatment early.
We identified early changes in OCR / ECAR ratio of cellular metabolism, as early as one cycle of anti-PD-1, on PBMCs of patients with metastatic melanoma. At 3 weeks of anti-PD-1, we also found an early rise in reserve respiratory capacity in patients with a clinical response to 6 months of RECIST-based immunotherapy while non-patients responders or disease stability at 6 months showed no change in spare capacity. Finally, we show a significant linear correlation between OCR / ECAR ratio changes and the tumor response at 6 months (p = 0.045).
The evaluation of the OCR / ECAR ratio from PBMCs of patients could be used as a potential marker for early response to anti-PD-1 immunotherapy and can easily be performed in clinical practice. In the event of validation of these data, this would allow rapid therapeutic adaptation in non-responder patients and could increase the chances of survival by rapid therapeutic reassessment. It would also help in the evaluation of new therapeutic protocols such as combinations or
28
sequential treatments in melanoma, or even be used in the evaluation of other types of cancers treated with anti-PD-1.
INTRODUCTION
Immune checkpoint inhibitors have revolutionized the prognosis of metastatic
melanoma. Currently, anti-PD-1 immunotherapy is offered as a first line treatment, alone or in combination. Unfortunately, only 30 to 40% of patients initially respond to treatment and some develop acquired resistance (1). To date, there is no biomarker that predicts the response to PD-1 immunotherapy in melanoma. However, this is a crucial element that would avoid introducing inappropriate treatment for the patient, especially since anti-PD-1 immunotherapy sometimes presents severe toxicities. This time saving and efficiency in therapeutic care would also have positive impacts on health costs.
The anti-PD-1 immunotherapy targets the inhibitory synapse between cancer cells expressing PDL-1 and T cells expressing the co-inhibitor PD-1 receptor in order to restore an anti-tumor response. It has been shown that the differentiation of T cells and the acquisition of their effector function depend on their ability to reprogram their metabolism. Indeed, following an activating signal, the T cell will acquire anabolic metabolism to ensure cell proliferation and cytokine production through aerobic glycolysis (Warburg effect) allowing a rapid supply of ATP (2‒4). In the tumor microenvironment, effectors T cells will therefore compete with cancer cells for the same nutrient which is glucose (3,5). In addition, T cells chronically exposed to tumor antigens will overexpress PD-1 as well as other inhibitory receptors inducing an "exhausted" state (6). The PD-1 inhibitors can reverse this dysfunctional state.
29
Indeed, it has been demonstrated in experimental studies that anti-PD-1 increases the glycolytic capacities and effective functions of TILs (5,7,8). However, this effect is dependent on the level of expression of PD-1 in T cells. In case of high PD-1 expression, metabolic alterations are too pronounced and the high oxidative stress will prevent the resumption of anabolic activity and block the effective capacities of T cells even in case of PD-1 inhibition (9). PD-1 appears to be a key marker of the metabolic state of T cells and therefore reflects their functional capacity. It is also expressed on several immune cells such as natural killer cells (NK), NKT cells, B cells, macrophages and some dendritic cell subgroups during immune activation (10). An increase in glycolysis has also been demonstrated when these different types of immune cells are activated (11‒15). It is therefore a hallmark in metabolic change during immune cells activation process and a true vector of the effector immune response. Recent studies have shown a correlation between the phenotypic changes of circulating T cells and the response to anti-PD-1 immunotherapy (16). Moreover, during treatment with anti-PD-1, the tumor infiltrating lymphocytes presents other clones than those found before treatment, indicating a recruitment from peripheral blood (17). Few studies have been based on the search for predictive factors on peripheral blood mononuclear cells (PBMCs); this is an easily achievable and renewable gesture during treatment in clinical practice with simple and fast laboratory techniques. Therefore, we wanted to evaluate the early modifications of inhibitors of the PD-1 pathway on the immune and metabolic profile of PBMCs in patients with metastatic melanoma in order to detect a predictive marker of the anti-tumor response.
30
MATERIALS AND METHODS
Study design and patients
This monocentric and prospective clinical trial NCT02828202 started in March 2018 in the dermatology department of Lille University Hospital. Eligible patients were 18 years old or older, had unresectable stage III or IV melanoma treated with first-line PD-1 immunotherapy. Patients participating in the protocol gave their written permission for the use of their clinical data in this study. This study was the subject of an amendment from the Melbase project and obtained a favorable opinion from the committee for the protection of persons (Annexe 2).
Human whole blood samples were collected in 3 tubes of 8 mL containing sodium heparin in order to isolate and analyze PBMCs before initiation of treatment (T0) and then at three weeks (T1), 3 months (T2), 6 months (T3) and 1 year (T4) after the start of treatment (Fig.1A). The administrations of immunotherapy (nivolumab 3mg/kg every 2 weeks or pembrolizumab 2mg/kg every 3 weeks) as well
as clinic morphological evaluations (Computerized Tomography-scan/CT-scan and
brain Magnetic Resonance Imaging/MRI every 3 months) were carried out according
to the recommendations of the High Authority of Health.
Flow Cytometry Assays
The blood was diluted half in Phosphate Buffered Salin (PBS) without Ca2+ nor
31
lymphocyte separation medium (MSL) (Eurobio, France) by centrifugation at room temperature (RT) and without brake. The PBMC ring was then recovered and washed twice in PBS before manual cell counting on Thoma cells under an inverted microscope (Eclipse TS100, Nikon). The viability of the cells was verified by the use of Trypan blue (Gibco). The cell suspension was incubated for 10 minutes at RT, and protected from light, with human FcR Blocking Reagent (Miltenyi Biotec, France). Fresh PBMCs were then incubated for 15 minutes at RT and stained with fluorescence-conjugated antihuman monoclonal antibodies (Miltenyi Biotec, Berlin, Germany):
- T cells markers: CD3 [phycoerythrin (PE)-Vio770], CD4 [VioBlue], CD8 [VioGreen] ;
- Immune activation markers : CD25 [VioBright-FITC], CD69 [PE Vio 770], CCR7 [PE] ;
- Inducible regulatory T cells markers: CD4 [VioBlue], CD18 [FITC], CD49b [PE-Vio770].
The use of control isotypes made it possible to dispense of cellular autofluorescence. The analysis was carried out on living cells by using of a fluorescent DeoxyriboNucleic Acid (DNA): 7-aminoactinomycin D (Invitrogen, ThermoFisher Scientific, France) with the flow cytometer Canto II (BD Biosciences, France). Data acquisition was done using Diva software and these data were analyzed using the FlowJo software (BICEL Cellular Imaging Platform).
32
Seahorse Metabolic Assays
75 000 cells were seeded per well with Dulbecco's Modified Eagle Medium (DMEM) (ThermoFisher Scientific) with 20% glucose, 2 mM L-glutamine, and 1 mM sodium pyruvate then deposited in the plate (FluxPaks, Agilent Seahorse XF24 kit) previously coated at Cell-tak (Corning, USA). Two successive centrifugations were
carried out (1min, 450 Revolutions Per Minute (RPM) then reversal of the plate and
recovery 1min, at 650RPM, at RT). In vitro oxygen consumption and extracellular acidification rates were measured with the Seahorse XFe96 Analyzer. First, three basal Oxygen consumption rate (OCR) and Extracellular Acidification Rate (ECAR) measurements (3-0-3 mix-wait-measure cycle) were performed. Next, Oligomycine (Sigma Aldrich) at 1 µM was injected. Then, first injection of Carbonyl Cyanide-4- Phenylhydrazone/FCCP (Sigma Aldrich) at 0.55 μM was performed followed by a second FCCP injection at the final concentration of 1.16 µΜ. Finally, an injection
combining 100 μM rotenone and 1.0 μM antimycin A was introduced. 2
measurements were performed after each injection.
Double Antibody Sandwich Enzyme-Linked Immunosorbent Assay (DAS-ELISA)
The sandwich ELISA test was used to quantify cytokine concentrations related to the Th1 (IL-2, IFN) and immunosuppression (IL-10, TGFβ/Transforming Growth Factor Beta) response. ELISA kits for detecting each cytokine were obtained from BD (BD Pharmingen ™, USA). The assays were made in triplicate with serum sample added to each well according to the manufacturer's instructions. On each plate, an 11-point standard range by half-training of the recombinant cytokine (BD Pharmingen
33
™, USA) with a maximum concentration of 2500 μg/ml was performed. The readings
were made at 492 nm with the spectrophotometer (Multiskan EX,
ThermoLabsystems, France). Analyzes were obtained by AscentTM Software (TheroLabsystems, France) and protein concentrations were expressed in pg/mL.
Statistical analysis
We used Student’s T-Test to evaluate the correlation coefficient between the OCR/ECAR ratio of PBMCs of patients following one cycle of anti-PD-1 and the 6-month tumor response of immunotherapy according to RECIST criteria version 1.1 (Annexe 3). Statistical significance was defined as P ˂ 0.05. All analyzes were performed using Prism® (version 8.0, GraphPad Software, Inc).
34
RESULTS
Patient characteristics
Five patients were enrolled between 3/2018 and 03/2019 at the Dermatology Clinic of Lille University and Hospital Center (Fig.1B). All patients provided a written informed consent. The average age was 65.2 years and the sex ratio was 3: 2 (3 women and 2 men). Four patients had cutaneous melanoma (2 Superficial Spreading
Melanoma/SSM and 2 nodular) and for one patient the primitive was unknown. All
patients had advanced metastatic melanoma with 4 M1c or M1d stage patients. All patients received first-line immunotherapy with anti-PD-1, four patients were under pembrolizumab and one patient was under nivolumab.
Biological characteristics
For serum markers (Fig.1C), C-Reactive Protein (CRP) was elevated to 105 mg/L (standard ˂ 5 mg/L) at T0 for P2 and returned to a subnormal value at T1. There was mild initial lymphopenia in 3 patients (P1, P3, P5) with near normalization at T1. P1 and P2 had a high initial monocyte level (highest norm at 710/mm3). At T1, this rise was accentuated for P1 while the monocyte level was normalized for P2. The initial Lactate Deshydrogenase (LDH) level was high for P2, P4 and P5. This rate was normalized for P2 and P4 at T1, whereas for P1 and P5, there were increases at 3 weeks of the beginning of immunotherapy.
35
Early modification of immune monitoring following the introduction of anti-PD-1 immunotherapy
We were interested in the results of P1 and P2, which had an opposite response profile under anti-PD-1 immunotherapy, one with tumor progression (P1) and the other with a complete response (P2). Other patients had different responses under anti-PD-1: patient 4 (P4) has disease stability at 6 months; patient 3 (P3) has also a complete response while patient 5 (P5) has tumor progression at 6 months (the results are presented in the supplementary figures). When we look at the frequency of the initial lymphocyte populations we see that they represent 40% of PBMCs in P1 and are predominantly represented by CD4+ T cells (Fig.2A). At T0, P2 had a larger lymphocyte population corresponding to half of the PBMCs. In addition, the distribution of CD4+ T cells relative to CD8+ T is generally homogeneous (28.94% and 22.15% respectively) (Fig.2B). At T1, after one cycle of anti-PD-1 immunotherapy, we observed really important differences in immune population profiles between P1 and P2. Indeed, P1 showed a clear decrease of almost half of its lymphocyte population (20.5% versus 40.7%), in particular CD3+CD4+ (13.28% versus 29.75%) (Fig.2A). In contrast, P2 had a moderate rise in all its CD3+ lymphocyte populations (62.9% versus 51.5%) (Fig.2B). These data also seem to be confirmed in other patients. Indeed, P3 had a large initial proportion of lymphocytes in PBMCs unlike P4 and P5 (Supplementary Figure 5).
When we look at the activation profile of T cells, we note that P1 after a cycle of anti-PD-1 immunotherapy had a global stability of early activation markers (CD25 and CD69) and late (CCR7) compared to the time before treatment (Fig.2C), while P2 showed an elevation of the early activation marker (CD25) after one anti-PD-1 cycle with stability of the other markers (CCR7 and CD69) (Fig.2D). Thus, early
36
changes appeared from an immunotherapy course to a lymphocyte activation profile for P2 compared to P1, which did not show any changes in activation markers. According to the results of P3, P4 and P5 (Supplementary Figure 5), there were also be differences in terms of lymphocyte proportion within PBMCs and expansion capacity after a cycle of anti-PD-1. However, there is no evidence of correlation between the modification in the expression of lymphocyte activation markers and the tumor response after one cycle of immunotherapy.
In the analysis of the cytokine profile, it was noted that for P1 the serum concentration of TGFβ increased strongly by a factor of 4 after one cycle of immunotherapy (T0: 692, 69 μg/ml, T1: 3740.31 μg/ml) associated with a moderate decrease in effector cytokines INFɣ (T0: 85.36 μg/ml, T1: 73.73 μg/ml) and IL-2 (T0: 1652.10 μg/ml, T1: 1118.20 μg/ml) (Fig2.E). IL-10 was stable with a concentration of 11.04 μg/ml before and 16.46 μg/ml after treatment (Fig2.E), while P2 showed a decrease in the serum TGFβ concentration between T0 and T1 from 1544.38 μg/ml to 1077.61 μg/ml (Fig2.F). For the IFNɣ, IL-2 and IL-10 cytokines, no clear change in serum concentration was observed before and after one cycle of anti-PD-1 (Fig2.F). The secretome analyzes of the other three patients (P3, P4 and P5) failed to demonstrate a cytokine profile related to the response to anti-PD-1 immunotherapy (Supplementary Figure 6).
Changes in the frequency of lymphocyte populations and cell activation status were observed after a single course of anti-PD-1 immunotherapy for P2 with an immunostimulatory effect. However, no early modification of IFNɣ, immunostimulatory cytokine secretion was observed in this patient. For P1, the first course of immunotherapy did not seem to restore an immune response. On the contrary, P1
37
presented a decrease of lymphocyte T populations, no increase in lymphocyte activation markers and an elevation of the immunosuppressive cytokine TGFβ.
Modification of the metabolic profile of immune populations under anti-PD-1 immunotherapy
We performed a metabolic assessment on PBMCs of patients before and after a cycle of anti-PD-1 immunotherapy. We measured the OCR which is a reflection of the activity of oxidative phosphorylation as well as the ECAR representing the glycolytic flux. For P1, there was a slight improvement in the OCR response to FCCP with no change kinetic ECAR response to oligomycin between T0 and T1 (Fig.3A and B). There was a significant increase of 16.64% in basal OCR after one cycle of immunotherapy, with an average basal rate of 235,17 pmol.min-1 at T0 against 282,11 pmol.min-1 at T1 (Fig.3C). The maximum respiratory capacity for P1 showed no significant change before and after one cycle of anti-PD-1 (T0: 574,90 pmol.min-1; T1:634,62 pmol.min-1) as well as spare respiratory capacity (T0: 321,35 pmol.min-1; T1: 352,51) (Fig.3K and L). On the opposite, the basal rate of ECAR showed a significant decrease of 41.2% with an average basal rate of 58,18 mpH.min-1 at T0 against 34,21 mpH.min-1 at T1 (Fig.3D). Thus, OCR/ECAR ratio showed a significant increase with a rate twice as high between T1 and T0 suggesting a trend towards oxidative phosphorylation (Fig.3E).
On the contrary, P2 showed a marked increase of the kinetic ECAR response with a slight increase in the OCR response to FCCP at T1 compared to the T0 (Fig.3F
and G). The maximum respiratory capacity for P2 was globally stable between T0
and T1 (520,84 pmol.min-1 and 595,42 pmol.min-1 respectively) (Fig.3M), while the spare capacity showed a significant increase after one cycle of anti-PD-1 (T0: 215.88
38
pmol.min-1, T1: 569.55 pmol.min-1) (Fig.3N). There was a slight but significant decrease in the basal OCR rate of 5.73%, with an average basal rate of 274.46 pmol.min-1 at T0 against 258.73 pmol.min-1 at T1 (Fig.3H). Basal ECAR was significant increased by 56.33% with an average basal rate of 29,04 mpH.min-1 at T0 against 66,50 mpH.min-1 at T1 (Fig.3I). The OCR/ECAR ratio showed a significant decrease of 58.92% after a single immunotherapy cycle (Fig.3J). Thus, it appears that the PBMCs of P2 modified their metabolic program after a single cycle of immunotherapy in favor of glycolysis while maintaining an oxidative phosphorylation activity, which corresponds to an immune activation profile. PBMCs of P1 maintained oxidative phosphorylation as the main bioenergetic source. Immune cells did not engage the glycolysis pathway after one cycle of anti-PD-1 which corresponds to the main pathway of metabolism in case of immune activation. Thus, it appears that PBMCs of P2 had metabolic changes necessary for cell activation and effector function acquisition whereas PBMCs of P1 did not show a metabolic change following a single cycle of anti-PD-1.
The results of P2 are very interesting because they are similar to those of P3 with a decrease in the OCR/ECAR ratio and a marked increase in the spare respiratory capacity after a cycle of anti-PD-1 and which also presented a tumor response at 6 months (Supplementary Figure 7). Both P5 and P1 showed a significant increase in OCR/ECAR ratio and a decrease in spare respiratory capacity, and both showed tumor progression at 6 months of immunotherapy (Supplementary Figure 7). Finally, the profile of P4, which had disease stability at 6 months, showed a decrease in the OCR/ECAR ratio after a cycle of anti-PD-1 but kept a stable reserve respiratory capacity after immunotherapy (Supplementary Figure 7).
39
OCR/ECAR ratio correlates with anti-tumor response
A CT-scan evaluating the response under immunotherapy was performed at 3 months and 6 months after the initiation of treatment. The response was determined according to the criteria RECIST version 1.1 (Annexe 3). As early as 3 months, P1 showed tumor progression with a 40% increase in tumor volume (Fig.4C). At 6 months, tumor progression worsened with a tumor gain of 60% (Fig.4A and C), whereas for P2, there was tumor stability at 3 months with a decrease in tumor volume of 20% (Fig.4D). The evolution of P2 at 6 months was favorable with a partial response and a loss of tumor volume of 30% (Fig.4B and D). Finally, there appears to be a linear and significant correlation between OCR/ECAR changes from PBMCs after one immunotherapy cycle and the best tumor response at 6 months in our patients with metastatic melanoma (p= 0.0455) (Fig.4E). It appears that early changes in immune cell metabolism following a single cycle of anti-PD-1 immunotherapy may correlate with the anti-tumor response under immunotherapy.
DISCUSSION
We showed an early change in the frequency of peripheral lymphocyte populations after only one cycle of anti-PD-1 immunotherapy. Indeed, patients with stability or partial response under anti-PD-1 showed an increase in the frequency of CD3+ populations as well as double populations labeled CD3+CD4+ and CD3+CD8+, while the progressing patients showed a stability or decrease of CD3+ populations in one cycle of anti-PD-1 immunotherapy. It has been shown that the majority of tumor-specific TILs after anti-PD-1 treatment had unidentified TCRs before treatment,
40
suggesting that they were newly recruited and therefore detectable in peripheral blood (53). Indeed, it has also been shown in studies that anti-PD-1 may modify the peripheral blood immune populations, in particular by revitalizing the CD4+ and CD8+ T cell lymphocytes, in particular with a "memory" or "central memory" phenotype (19).
When we look at the changes in the secretome, we notice that the patients with a partial response maintained a stable serum concentration of IFNɣ whereas the concentration of TGFβ decreased after one cycle of anti-PD-1, which is rather in favor of an effector immune response. On the contrary, patients with progression or stability showed a decrease in their serum concentration of IFNɣ and a high concentration of TGFβ after one cycle of anti-PD-1 immunotherapy revealing an immunosuppressive response. One team has shown that IFNɣ can lead to the expression of several genes necessary but not sufficient for the clinical response under anti-PD-1 (20). In addition, TGFβ can be secreted by melanoma cells to escape the immune system and promote cancer progression (21). This modification does not apply to Patient 5 who, despite tumor progression, showed an increase in serum concentration of IFNɣ and an almost nil rate of TGFβ after one cycle of immunotherapy. This can be explained by the paradoxical role of IFNɣ, which is able to directly upregulate PD-L1 and PD-L2 ligands in tumor cells (22), immune cells stromal cells and even on tumor exosomes (23), thus promoting the inhibitory synapse with PD-1 expressed on T cells infiltrating the tumor resulting in a downregulation of the cytotoxic response and called feedback loop. LDH is known to be a serum marker correlated with overall patient survival but not with response to treatment (24). Other studies have shown that serum cytokine levels may correlate with responses to immune control inhibitors such as IL-8 in melanoma (25). It has also been shown that the initial levels of IFNγ, IL-6 and IL-10 are higher in
non-41
responders to nivolumab (26). However, currently, no cytokine biomarker is used and validated in routine practice to predict the response to anti-PD-1. We found no predictive markers of cytokine response to anti-PD-1 immunotherapy in our cohort, although its size is reduced, consistent with the literature results.
We have demonstrated a significant increase in reserve capacity from one anti-PD-1 immunotherapy cycle in patients with partial response to non-responder patients. The spare respiratory capacity corresponds to the difference between basal respiration rate and maximal respiration rate; it makes it possible to measure the increase in cellular respiration after contact with various inhibitors such as oligomycin and FCCP. It is a marker essential to the bioenergetic of the cell that is more sensitive than the maximum respiratory capacity to evaluate the metabolic capacity of the cell to meet additional energy needs related to different stress. It has been shown that the higher the spare capacity, the better the cell survival in hypoxia (27). It has been shown that the effector function of T cells is sustained over the long term in chronic diseases such as cancer by mitochondrial activity. It seems that it is the persistent activation of the Akt intracellular signal by the tumor microenvironment which would be responsible for the repression of OXPHOS within the T lymphocytes causing a decrease in the reserve respiratory capacity (28). Thus, the T lymphocyte is no longer able to adapt to different stresses and is no longer able to respond even after stimulation with an anti-PD-1 due to a lack of energy resources. We therefore showed that there was a significant increase in the reserve respiratory capacity of PBMCs in patients with a response to anti-PD-1 immunotherapy. Thus, it demonstrates the early ability of immune cells to respond to stimulation by the immune checkpoints inhibitor and correlated with the clinical anti-tumor response evaluated at 6 months.
42
We identified in the 5 patients an early and linear correlation between the OCR/ECAR ratio measured on the PBMCs before and after one cycle of anti-PD-1 immunotherapy and the best tumor response obtained under treatment. It has been shown during an acute infection that alterations in T cell bioenergetics occur early with reduced glucose utilization despite activation of the anabolic pathways. This metabolic dysfunction is related to the PD-1 signaling pathway (9). When antigenic stimulation becomes chronic (cancer/infection), PD-1 expression is higher on T cells associated with an established exhausted phenotype. It has been shown in this situation that inhibition of PD-1 does not restore the metabolic pathways of the cell linked to the accumulation of other factors. The cell is thus maintained in an irreversible dysfunction state (29,30). Otherwise, the Yost team found that the majority of TILs had different TCRs after anti-PD-1 treatment compared to those found before treatment suggesting T cell recruitment (31). It has also been shown that a significant number of these new tumor-specific lymphocytes engaged by anti-PD-1 immunotherapy came from peripheral blood (17,31). Therefore, anti-anti-PD-1 immunotherapy would rather have a role in recruitment of new tumor-specific T cells than a role of amplifying the effector capacity of pre-existing TILs whose activation and chronic exhaustion significantly limit their regenerative capacity. Indeed, it has been shown that the ability of anti-PD-1 immunotherapy to restore peripheral blood CD8+ T cell function to the patient's tumor burden could predict the clinical response to immunotherapy (16).
Thanks to the seahorse extracellular flux analyzer technique it is possible to measure the activity of glycolysis and oxidative phosphorylation in real time and to evaluate the bioenergetics of PBMCs before and after treatment. We have shown that the lower the OCR/ECAR ratio, the more it reflects anabolic metabolism of the