A whole-grain cereal-rich diet increases plasma betaine, and tends to
decrease total and LDL-cholesterol compared with a refined-grain diet
in healthy subjects
Alastair B. Ross*, Stephen J. Bruce, Anny Blondel-Lubrano, Sylviane Oguey-Araymon,
Maurice Beaumont, Alexandre Bourgeois, Corine Nielsen-Moennoz, Mario Vigo, Laurent-Bernard Fay,
Sunil Kochhar, Rodrigo Bibiloni, Anne-Ce´cile Pittet, Shahram Emady-Azar, Dominik Grathwohl and
Serge Rezzi
Nestle´ Research Centre, Vers chez les Blanc, 26 Lausanne 1000, Switzerland
(Received 23 July 2010 – Revised 9 November 2010 – Accepted 12 November 2010 – First published online 28 January 2011)
Abstract
Epidemiological studies have repeatedly found that whole-grain (WG) cereal foods reduce the risk of several lifestyle-related diseases, though consistent clinical outcomes and mechanisms are elusive. To compare the effects of a WG-rich diet with a matched refined-grain (RG) diet on plasma biomarkers and bowel health parameters, seventeen healthy subjects (eleven females and six males) completed an exploratory cross-over study with a 2-week intervention diet based on either WG- or RG-based foods, separated by a washout of at least 5 weeks. Both diets were the same except for the use of WG (150 g/d) or RG foods. Subjects undertook a 4 h postprandial challenge on day 8 of each intervention diet. After 2 weeks, the WG diet tended to decrease plasma total and LDL-cholesterol (both P¼ 0·09), but did not change plasma HDL-cholesterol, fasting glucose, C-reactive protein or homocysteine compared with the RG diet. Plasma betaine and alkyl-resorcinol concentrations were elevated after 1 week of the WG diet (P¼ 0·01 and P, 0·0001, respectively). Clostridium leptum populations in faeces were increased after the WG diet, along with a trend for decreased faecal water pH (P¼ 0·096) and increased stool frequency (P, 0·0001) compared with the RG diet. A short controlled intervention trial with a variety of commercially available WG-based products tended to improve biomarkers of CVD compared with a RG diet. Changes in faecal microbiota related to increased fibre fermentation and increased plasma betaine concentrations point to both fibre and phytochemical components of WG being important in mediating any potential health effects.
Key words:Whole-grain cereal diet: Plasma lipids: Biomarkers: Betaine: Alkylresorcinols: Gut microbiota
Epidemiological studies have pointed to diets rich in whole-grain (WG) cereal foods reducing the risk of many diet-related
diseases, including CVD(1,2), diabetes(3), obesity, the metabolic
syndrome(4) and some cancers(5), with similar results being
found across many populations. The mechanisms that have been proposed to underlie the reduction in disease risk revolve around the fibre and phytochemical content of WG
compared with their refined counterparts(6,7). In the published
literature, a number of interventions based on WG cereal
diets have found that WG lower plasma total and
LDL-cholesterol(8 – 11), blood pressure(12 – 14), improve insulin
parameters(15 – 17) and improve markers of bowel
func-tion(18,19). In most cases, these studies have been carried out on people already at risk of disease (e.g. overweight/obesity, hypercholesterolaemia, hyperinsulinaemia). Often these inter-vention studies have used specially prepared foods based on a
single cereal grain (e.g. rye or barley), rather than WG foods that are readily available for consumers, and endpoints
generally only span standard blood clinical chemistry
measurements. Additionally, human intervention studies
have not always found clear results from feeding WG cereals
on markers of CVD risk(20 – 22), which has led to some
discus-sion about the acute impact of a WG diet(23).
In addition to variable results from intervention studies, mechanisms of how a WG diet may improve health have also been unclear. While dietary fibre may explain many
potential benefits of WG(24), epidemiological research has
often found benefits for CVD even when correcting for fibre intake, suggesting that other components in WG may also
play a role(25). Of recent interest is the role of glycine betaine
(betaine), a methyl donor found in high concentrations in WG
wheat- and rye-based foods(26,27). Supply of a higher amount
* Corresponding author: A. B. Ross, fax þ 41 21 785 9486, email [email protected] Abbreviations: CRP, C-reactive protein; RG, refined grain; WG, whole grain.
qThe Authors 2011
British
Journal
of
of betaine may be an additional mechanism for the reduction in CVD risk due to WG intake, primarily via its role in the conversion of the cardiovascular risk factor homocysteine to
methionine(28,29).
One of the goals of dietary recommendations for WG cer-eals is to get healthy people to replace servings of refined grains (RG; cereal grains with the bran and germ removed by milling) with WG products in order to reduce the risk of
CVD(30), though few intervention studies have specifically
compared the effect of matched WG foods with RG foods in
healthy subjects(14,21). In order to better understand some of
the possible mechanisms behind the potential benefits of replacing RG with WG foods, we designed a controlled, exploratory study to compare the short-term impact of a diet rich in commercially available WG cereal products with a diet rich in RG cereal products on parameters related to cardi-ovascular and gastrointestinal health in healthy subjects.
Materials and methods Study design
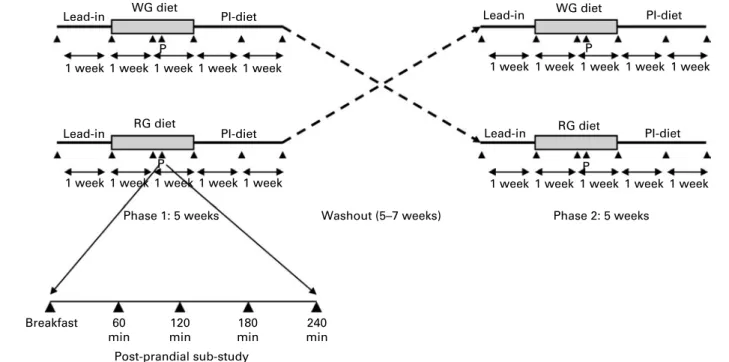
The study was designed as a cross-over trial to compare the effect of a diet rich in WG with a diet rich in RG. After a 1-week lead-in where subjects were asked not to consume any WG foods (controlled using diaries and plasma
alkylresor-cinols(31)) in order to have a similar baseline with regard to WG
intake, subjects were randomly assigned to either a WG or RG diet for 2 weeks. This diet was controlled with all foods being supplied by the study centre. After the 2-week intervention period, subjects were asked not to consume any WG foods (as for the lead-in) for 2 weeks in order to monitor how long any changes due to the intervention diet lasted (post-intervention
period). After a washout period of 5 – 7 weeks between the end of the post-intervention period and the start of the next lead-in, the subjects repeated the same protocol, but ate the other diet during the intervention period (Fig. 1). At the start of the study and at 1-week intervals during the following 5 weeks of the study, blood and 24 h urine samples were collected (total of six time points). Additionally, spot faecal collections (first stool passed during the day) were carried out at baseline and after the 2-week intervention diet period. Because changes due to the diets may not be evident in fasting plasma samples, a postprandial substudy was carried out. On day 8 of both intervention diets, subjects consumed either a WG breakfast cereal (shredded wheat) or a RG breakfast cereal (cornflakes), appropriate to the diet they were currently following. Subjects gave blood samples at 0, 60, 120, 180 and 240 min after the breakfast meal (Fig. 1). The present study was conducted according to the guidelines laid down in the Declaration of Helsinki, and all procedures involving human subjects were approved by the Ethical Committee of the Lausanne Region, Vaud Canton, Switzerland. Written informed consent was obtained from all subjects. The study was carried out from February 2008 to December 2008.
Subjects
A total of twenty-two subjects were recruited to the study. Written informed consent was obtained from each subject, and selection took place following a medical questionnaire and con-firmation of adherence to inclusion/exclusion criteria (healthy
(normal blood lipid panel, BMI 19 – 28 kg/m2, no chronic or
recent illness, no recent use of antibiotics or medication and non-smokers), between 20 and 50 years old and low habitual
WG intake (, 30 g/d, as determined by an FFQ(31))). Lead-in Lead-in WG diet RG diet PI-diet PI-diet
Phase 1: 5 weeks Washout (5–7 weeks)
Breakfast 60 min 120 min 180 min Post-prandial sub-study 240 min P P P
1 week 1 week 1 week 1 week 1 week
Lead-in WG diet PI-diet
P
1 week 1 week 1 week 1 week 1 week
1 week 1 week 1 week 1 week 1 week
Lead-in RG diet PI-diet
Phase 2: 5 weeks 1 week 1 week 1 week
1 week 1 week
Fig. 1. Study design. During the first intervention diet period, subjects ate either a diet rich in whole-grain (WG) cereals or a diet rich in refined-grain (RG) cereals. During the second intervention diet period, they ate the diet they had not eaten during the previous period. ‘PI diet’ is the 2-week post-intervention diet when sub-jects were asked not to consume any whole grains. O, Sampling points; ‘P’, when the postprandial sampling took place on day 8 of each 14 d dietary intervention.
British
Journal
of
Study foods
Foods used in the study were all commercially available from Nestle´ SA worldwide or purchased from supermarkets
(Lausanne, Switzerland and Huskvarna, Sweden). WG,
energy, protein, fat, carbohydrate and fibre content were determined from the declared ingredient and nutrient compo-sitions. The WG component of foods was assumed to have all three major anatomical fractions of the cereal grain (bran, germ and endosperm) in the same proportions found
natu-rally. Cereal foods were also analysed for alkylresorcinol(32)
and betaine(27)content.
WG and RG menus were designed to supply a similar total energy intake, using cereal-based foods as the main source of carbohydrates (Table 1). Target daily energy intake was 8·5 MJ (2032 kcal) for the RG diet and 8·8 MJ (2107 kcal) for the WG diet. Bread (WG or RG wheat depending on the diet) was sup-plied with lunch and dinner, and was used as a discretionary food to make it easier for subjects to eat more or less depend-ing on their individual energy requirements. Seven different daily menus were devised for each of the WG and RG diets, with each menu being repeated twice over the 2-week inter-vention diet period. A wide range of different WG and RG foods were used in the study to help avoid subject fatigue with the diet. It was not possible to obtain exact equivalent WG v. RG cereal foods as RG equivalents were not readily available (e.g. WG oats v. RG oats), but efforts were made to match equivalent cereals where possible. Overall, the WG diet contained 64 % WG wheat, 13 % WG oats and 9 % brown rice, with the rest from barley and rye, while the RG diet contained 66 % refined wheat, 27 % white rice and 8 % refined maize. The average prescribed daily WG intake during the WG diet was 150 g WG/d on a dry weight basis. The average prescribed total cereal intake was 277 g for the RG diet and 275 g for the WG diet (WG and RG ingredients combined, also dry weight).
During the intervention phases, meals were either eaten in a dining room at the metabolic unit of the Nestle´ Research Centre, or provided pre-packaged for preparation at home. Compliance to the lead-in and post-intervention WG-free diets, and the intervention diet was monitored using food
diaries and monitoring whether plasma alkylresorcinol
concentrations remained within the expected range for a WG-free diet. Subjects were asked to note down any possible WG foods they ate during these periods. During the interven-tion phases, subjects were also asked to note the amount of all non-water beverages consumed, as well as any extra foods eaten and physical activity. Any food, including bread, remain-ing from the intervention diet was weighed and recorded to determine exact food intake. Beverages, extra food and remaining study foods were used for the quantification of overall nutrient intake during the study.
Nutrient intake during the intervention diet periods was estimated using a nutrient composition database program (Genesis; ESHA Research, Salem, OR, USA) using data from
the Swiss nutrient composition tables. Table
1 . Sample menu* Day 1 Day 2 D ay 3 D ay 4 D ay 5 Day 6 Day 7 Breakfast Breakfast cereal† Breakfast cereal† Breakfast cereal† Breakfast cereal† Breakfast cereal† Breakfast cereal† Breakfast cereal† Banana Apple M ixed berries B anana Apple B anana Mixed berries Milk Milk Milk Milk Milk Milk Milk Snack C rackers† Crackers† Crackers† Crackers† Crackers† Crackers† Crackers† Butter B utter Butter B utter B utter Butter Butter Cheese Cheese C heese Cheese Cheese Cheese Cheese Lunch Pasta† Couscous† T ortellini† Risotto† P asta† R ice noodles† P izza† Cheese s auce Chicken Tomato sauce Mixed s alad Bolognaise sauce Sweet c hilli sauce M ixed s alad Mixed s alad Moroccan vegetables M ixed salad Beef steak P armesan cheese T hree spring rolls Bread† Bread† Bread† B read† B read† M ixed salad S tir-fried v egetables Bread† Bread† Snack C ereal bar† Cereal bar† Cereal bar† Cereal bar† Cereal b ar† Cereal b ar† Cereal b ar† Orange Orange Orange Orange Orange O range Orange Dinner Frozen meal† F rozen meal† Frozen meal† F rozen meal† Frozen meal† F rozen meal† Frozen meal† Bread† Bread† B read† B read† B read† Bread† Bread† Butter B utter Butter B utter B utter Butter Butter Snack Yoghurt Y oghurt Yoghurt Yoghurt Yoghurt Y oghurt Yoghurt Chocolate Chocolate Chocolate Chocolate Chocolate Chocolate Chocolate * Cereal-ba sed products at each occasion were e ither based on whole-grain o r refined-grain cer eal ingredients. Froze n meals contained either pasta o r rice a s their ca rbohydrate component. T h e 7 d menu w a s fed twice for e a c h intervention a rm. † Foods that were available a s e ither whole g rain or refined grain.
British
Journal
of
Nutrition
Analytical methods
Plasma. Plasma was separated from blood by centrifugation
at 1000 g for 10 min at 48C. Plasma total, HDL- and LDL-cholesterol, TAG, glucose and C-reactive protein (CRP) were analysed using enzymatic kits in an XPAND autoanalyser
(kits and instrument from Dade Behring, Du¨dningen,
Switzerland). Homocysteine was analysed by HPLC using a
kit (Bio-Rad AG, Reinach, Switzerland)(33). Betaine was
ana-lysed by isotope dilution liquid chromatography – MS/MS(27).
Alkylresorcinols were extracted by liquid – liquid extraction, purified by mixed-mode anion-exchange solid-phase extrac-tion and analysed by GC – MS according to the method of
Landberg et al.(34).
Faeces. Faecal samples were collected into Stomacher
bags (Seward Limited, Worthing, West Sussex, UK), and kept at 48C before collection by the study centre, where they were stored at 2 408C. Faecal dry weight was determined after freeze-drying for 48 h. Faecal water was produced
according to the method of Klinder et al.(35), where two
times (w/v) of distilled water (with 3 mM-sodium azide to
prevent microbial growth) was added to the sample in a Stomacher bag and mixed using a Stomacher mixer (Seward Limited) for 2 min. If homogenisation was not complete, this was performed manually, and the samples were remixed using the Stomacher mixer. A 20 ml aliquot was removed into an ultracentrifuge tube, and tubes were centrifuged at 35 000 g for 120 min at 48C. The supernatant was divided into aliquots for further analysis. Faecal water pH was deter-mined using a pH probe.
Wet faeces were divided into aliquots before processing for faecal water and frozen at 2 808C before microbial analysis by quantitative PCR. Details of this procedure and probes used are provided in the supplementary material available at http://www.journals.cambridge.org/bjn. Total bacteria, Bac-teroides, Bifidobacterium, Clostridium coccoides, Clostridium
leptum, Enterobacteria, Enterococcus and Lactobacillus
groups were quantified. These groups represent the phyla that make up the majority of the gut microbiota. During the intervention diet periods, subjects were asked each day to note down how many times they had passed stools. These data over 14 d were used to determine stool frequency (stools/d) over each dietary period.
Statistical analyses
All outcomes were analysed using ANCOVA in a mixed model setting where diet effects were examined using diet, period, baseline and other covariates as fixed effects and subject as a random effect. No carry-over effect was assumed. For the analysis of faecal bacterial counts, those below the detection
limit were set to the detection limit (106 colony-forming
units/g) for the purpose of analysis. Bacterial counts were then log-transformed and analysed using ANCOVA as above. In addition, ANOVA was used with repeated measures in order to assess the effect of diets over time.
All analyses were conducted on the seventeen completed subjects only. Furthermore, no correction of significant level
was employed to adjust for the multiple testing of data because of the exploratory nature of the hypotheses studied. Therefore, unadjusted P values are reported, and the results are considered significant if P, 0·05 (trends reported if P, 0·2).
Statistical analyses were performed using NCSS for
Windows 2007 (Kaysville, UT, USA) and SAS (version 9.1; SAS Institute, Cary, NC, USA).
Results Subjects
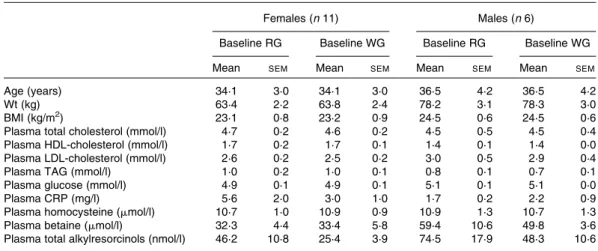
Of the twenty-two subjects recruited to the study, five subjects withdrew prematurely and seventeen subjects completed the study. One subject dropped out due to an inability to comply with the intervention diet (consumed , 50 % of their estimated daily energy requirement), one subject dropped out due to an unrelated illness and three other subjects dropped out due to unexpected travel commitments during the study. Baseline (after the lead-in period) plasma lipid, glu-cose, CRP, homocysteine, betaine and alkylresorcinol concen-trations did not differ between the two different arms of the study (Table 2).
Food intake and compliance
The average energy intake was 8·4 MJ/d (2013 kcal/d) for the WG diet and 8·6 MJ/d (2064 kcal/d) for the RG diet (Table 3). There was no difference in overall energy, protein, fat or carbohydrate intake between the two diets. However, total fibre, cereal fibre, alkylresorcinol and cereal betaine intake were higher during the WG diet (all P, 0·001). The average recorded WG intake during the WG diet was 151 g/d. No sub-jects reported eating WG foods during the lead-in or post-intervention periods, nor during the RG diet. Total plasma alkylresorcinols for all subjects were below 82 (median 24) nmol/l during the lead-in and post-intervention periods with the exception of one subject. This subject had an alkyl-resorcinol concentration of 238 nmol/l one week after the RG diet, suggesting that they had recently consumed WG wheat before the sampling. Overall, the alkylresorcinol concentrations during the lead-in and post-intervention diet periods were not significantly different from the RG diet. This indicates that all subjects successfully avoided WG wheat and rye as requested with the exception of one subject at one time point. The C17 : 0-to-C21 : 0 homologue ratio, which can distinguish
between a wheat- and a rye-based diet(36), was consistent with
the consumption of wheat-based products.
Plasma biomarkers
After 1 week, plasma TAG were higher on the WG diet com-pared with the RG diet (1·09 v. 0·89 nmol/l; P¼ 0·05). After 2 weeks on the WG diet, there was a trend for a decrease in total cholesterol by 3 % and LDL-cholesterol by 9 % compared with the RG diet (both P¼ 0·09), while there was no longer any difference between the two diets for plasma TAG. There
British
Journal
of
was no change in plasma HDL-cholesterol, glucose, CRP or homocysteine at 1 or 2 weeks after starting the WG diet, com-pared with equivalent time points for the RG diet (Table 4). Plasma betaine was elevated after 1 week of the WG diet (P¼ 0·01), and concentrations had dropped by 2 weeks, with a less marked difference between the two diets (P¼ 0·08). Mean baseline concentration of plasma alkylresorcinols, bio-markers of WG wheat and rye intake, was 46 (median 34; range 6 – 144) nmol/l, which was expected as the subjects were recruited as low-WG consumers. Plasma alkylresorcinols were increased by an average of 14·5 times after 1 week of the WG diet, remaining at approximately the same concentration after 2 weeks (both P, 0·001). During the RG diet, plasma alkylresorcinols were moderately increased to 44 – 47 nmol/l (P, 0·05 compared with after the lead-in and post-interven-tion periods), due to the high amount of refined-wheat products contained in the diet. Plasma alkylresorcinol concentrations returned to baseline values after 1 week of the post-intervention period (P. 0·6). The mean of total
alkylresorcinol concentrations during the post-intervention period was 28 (median 24; range 7 – 82) nmol/l (excluding one outlier), while the mean of total alkylresorcinol concen-trations during the RG diet was 45 (median 41; range 25 – 98) nmol/l. Alkylresorcinol concentrations returned to baseline values after 1 week of the WG-free, post-intervention diet (after lead-in, mean 23 (median 15; range 7 – 67) nmol/l; 1 week post-intervention, mean 38 (median 32; range 14 – 79) nmol/l; 2 weeks post-intervention, mean 30 (median 26; range 8 – 82) nmol/l (P, 0·01)), demonstrating that there is no clear carry-over effect on plasma alkylresorcinols 1 week after stopping eating WG.
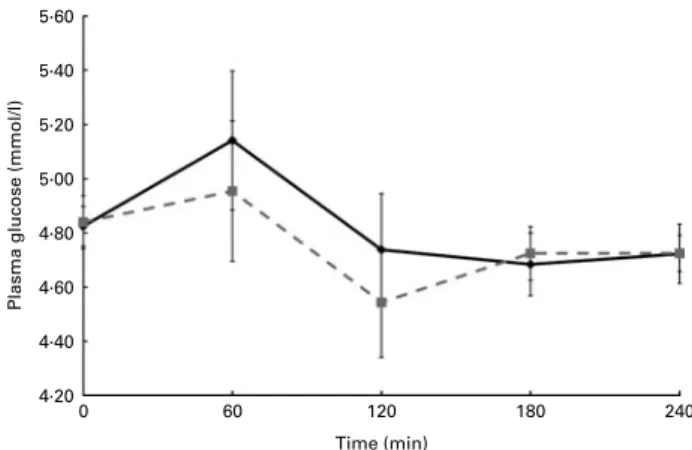
During the postprandial challenge, there were no differ-ences between the two diets for TAG or glucose (Figs. 2 and 3, respectively). After the WG breakfast, plasma betaine was elevated compared with the RG breakfast at comparative time points (Fig. 4). Betaine was increased by 18 % from base-line at 120 min after the WG meal (P, 0·01). Betaine was also increased from baseline at 60 min after the RG meal (P, 0·05),
even though the betaine concentration in maize is low(27).
Plasma alkylresorcinols increased moderately from fasting concentrations, and were always different from the same time points during the RG meal (Fig. 5). Although energy intake was similar during both diets, there was a trend for the WG diet to lead to 0·5 kg weight loss over the 2-week intervention period, compared with the RG diet (P¼ 0·19).
Faecal parameters
There was no overall change in the faecal microbiota popu-lation, with the exception of the C. leptum group, which was slightly increased after the WG diet (P¼ 0·02), and a
trend for an increase in Enterococcus spp. (P¼ 0·06)
(Table 5). Inter-subject variability was large for total bacteria and all bacterial species analysed. There was a trend for a decrease in faecal water pH on the WG cereal diet compared with the RG diet (7·14 v. 7·38; P¼ 0·063 for the difference in change from baseline), while stool frequency was increased Table 2. Baseline characteristics of subjects who completed the study
(Mean values with their standard errors)
Females (n 11) Males (n 6)
Baseline RG Baseline WG Baseline RG Baseline WG
Mean SEM Mean SEM Mean SEM Mean SEM
Age (years) 34·1 3·0 34·1 3·0 36·5 4·2 36·5 4·2
Wt (kg) 63·4 2·2 63·8 2·4 78·2 3·1 78·3 3·0
BMI (kg/m2) 23·1 0·8 23·2 0·9 24·5 0·6 24·5 0·6
Plasma total cholesterol (mmol/l) 4·7 0·2 4·6 0·2 4·5 0·5 4·5 0·4
Plasma HDL-cholesterol (mmol/l) 1·7 0·2 1·7 0·1 1·4 0·1 1·4 0·0
Plasma LDL-cholesterol (mmol/l) 2·6 0·2 2·5 0·2 3·0 0·5 2·9 0·4
Plasma TAG (mmol/l) 1·0 0·2 1·0 0·1 0·8 0·1 0·7 0·1
Plasma glucose (mmol/l) 4·9 0·1 4·9 0·1 5·1 0·1 5·1 0·0
Plasma CRP (mg/l) 5·6 2·0 3·0 1·0 1·7 0·2 2·2 0·9
Plasma homocysteine (mmol/l) 10·7 1·0 10·9 0·9 10·9 1·3 10·7 1·3
Plasma betaine (mmol/l) 32·3 4·4 33·4 5·8 59·4 10·6 49·8 3·6
Plasma total alkylresorcinols (nmol/l) 46·2 10·8 25·4 3·9 74·5 17·9 48·3 10·6
RG, refined grain; WG, whole grain; CRP, C-reactive protein.
Table 3. Actual nutrient intake during the two intervention diet periods (Mean values and standard deviations)
Refined-grain diet Whole-grain diet Mean SD Mean SD P Energy kJ 8638 881 8421 1003 0·51 kcal 2064 210 2013 240 0·51 Protein (g) 78 8 80 9 0·45 Fat (g) 65 8 68 10 0·42 Carbohydrate (g) 295 30 276 33 0·08 Total fibre (g) 19 2 32 3 ,0·001 Cereal fibre (g) 8 1 22 3 ,0·001
Total cereal intake (g) 271 38 259 34 0·34
Total whole-grain intake (g DM)
0 0 151 15 ,0·001
Alkylresorcinols (mg) 5 1 62 10 ,0·001
Betaine from cereals (mg) 119 15 231 28 ,0·001
British
Journal
of
(1·40 v. 0·96 stools/d; P, 0·0001). Two subjects noted that they had problems with constipation during the RG diet.
Discussion
WG cereals are recommended as an important part of a healthy diet, and at least three servings (48 g)/d are specifically recommended in the Dietary Guidelines for Americans 2005,
with up to 6 oz (170 g) recommended each day(30), while at
least 75 g/10 MJ are recommended for adults in Denmark(37).
In the present study, we designed a diet that used cereal grains as the main source of carbohydrates for each meal in order to see likely responses to a WG cereal diet compared with a RG diet over a relatively short time period (2 weeks). The two diets were well matched for overall energy content and macronutrient composition, and there was no difference between actual macronutrient intakes between the two diets, with the exception of fibre. The fibre content of the WG cereal diet, 34 g/d, is at the upper range of Swiss nutritional recommendations, while the RG diet (19 g/d) was the same Table 4. Plasma clinical chemistry measurements and the effect of the whole-grain (WG) diet compared with the
refined-grain (RG) diet
(Mean values with their standard errors and 95 % confidence intervals)
RG WG RG – WG*
Mean SEM Mean SEM Mean 95 % CI
Week 1
Total cholesterol (mmol/l) 4·12 0·14 4·08 0·17 0·03 20·17, 0·24
LDL-cholesterol (mmol/l) 2·39 0·14 2·25 0·15 0·15 20·13, 0·43 HDL-cholesterol (mmol/l) 1·62 0·07 1·57 0·07 0·08 20·05, 0·22 TAG (mmol/l) 0·89 0·10 1·09 0·15 20·27† 20·54, 0·00 Glucose (mmol/l) 4·87 0·07 4·83 0·10 20·03 20·24, 0·17 C-reactive protein (mg/l) 2·90 0·82 3·10 0·85 0·29 20·92, 1·49 Homocysteine (mmol/l) 8·83 0·68 8·87 0·61 20·04 20·65, 0·58 Betaine (mmol/l) 37·46 3·81 47·45 5·38 210·17‡ 217·60, 2 2·73
Total alkylresorcinols (nmol/l) 46·7 4·2 333·9 39·5 2291·6§ 2367·0, 2 216·3
Week 2
Total cholesterol (mmol/l) 4·12 0·14 3·91 0·12 0·18k 20·03, 0·38
LDL-cholesterol (mmol/l) 2·31 0·12 2·16 0·10 0·18k 20·04, 0·40 HDL-cholesterol (mmol/l) 1·62 0·10 1·59 0·07 0·07 20·06, 0·20 TAG (mmol/l) 0·97 0·10 1·00 0·12 20·09 20·28, 0·09 Glucose (mmol/l) 5·07 0·07 5·06 0·07 20·03 20·19, 0·14 C-reactive protein (mg/l) 3·01 0·90 3·38 0·92 20·01 22·00, 1·97 Homocysteine (mmol/l) 8·57 0·60 8·78 0·62 20·16 20·62, 0·29 Betaine (mmol/l) 36·72 3·47 41·74 4·49 25·07k 210·86, 0·71
Total alkylresorcinols (nmol/l) 43·5 4·2 357·4 39·7 2318·4§ 2391·7, 2 245·0
* Corrected for baseline. Statistical analyses were corrected for treatment order, age, sex, BMI and baseline concentrations. † P¼ 0·05. ‡ P¼ 0·01. § P, 0·0001. k P, 0·1. 1·30 1·20 1·10
Plasma TAG (mmol/l)
1·00 0·90 0·80 0·70 0 60 120 Time (min) 180 240
Fig. 2. Plasma TAG concentrations monitored for 240 min after a whole-grain breakfast (shredded wheat) or a refined-grain breakfast (cornflakes). The interventions were taken against a background of a diet rich in whole grains or refined grains. Values are means, with standard errors represented by ver-tical bars. , Refined-grain diet; , whole-grain diet.
5·60 5·40 5·20 5·00
Plasma glucose (mmol/l)
4·80 4·60 4·40 4·20 60 120 Time (min) 180 0 240
Fig. 3. Plasma glucose concentrations monitored for 240 min after a whole-grain breakfast (shredded wheat) or a refined-whole-grain breakfast (cornflakes). The interventions were taken against a background of a diet rich in whole grains or refined-grains. Values are means, with standard errors represented by vertical bars. , Refined-grain diet; , whole-grain diet.
British
Journal
of
as the normal intake among the French-speaking Swiss popu-lation (M. Vidal et al., unpublished results), so the RG diet cannot be defined as being especially low in fibre. The intake of other WG-related nutrients measured, betaine and alkylresorcinols, was at the upper range of estimated intakes
from cereal foods(38,39).
Some studies have found that a WG-rich diet does decrease
plasma total and LDL-cholesterol(9,11,40), and in the context of
the short duration of the intervention, a trend for a decrease in both total and LDL-cholesterol is remarkable, especially as all subjects were apparently healthy and normocholesterolaemic at baseline. The possible reason why some well-executed studies have not found an effect of WG on plasma cholesterol is the type of control used. For example, a WG diet has been
compared with a low-WG diet(21)or subjects have added WG
foods to their diet rather than replacing RG foods as
recommended(22,23). These results point to the use of a
well-defined RG control diet being important for studying the effects of a WG diet. The trend for a reduction in plasma cholesterol in the present study lends further support to the repeated findings in epidemiological studies that diets high in WG cereals compared with those low in WG cereals are
protective against CVD(2).
No differences between diets were seen for plasma TAG, glucose, CRP or homocysteine. While some studies have found an effect of WG foods on these markers such as
CRP(41), it is possible that WG foods have a limited or no
effect in subjects where the biomarkers are at normal concen-trations in healthy subjects. In the case of glucose, specific challenge tests may be needed to observe the effects on glu-cose metabolism, as for a recent study which has found that a WG-based evening meal can improve glucose metabolism
the morning afterwards(42).
Some WG cereals, notably wheat and rye, are good sources
of dietary betaine(27), and it has been suggested to be one of
the beneficial components of WG foods(28), yet apparently
little research has been done on the effect of a WG cereal-rich diet on plasma betaine concentrations. Betaine is a methyl donor that is reported to have many metabolic
func-tions(43), most notably as an osmolyte and as a donor of a
methyl group in the conversion of homocysteine to methion-ine. Betaine has been found to lower homocysteine in
humans(44), though estimated dietary betaine intake was not
associated with lower plasma homocysteine in women in an
epidemiological setting(45). Higher concentrations of plasma
betaine were associated with lower non-HDL-cholesterol,
TAG, BMI, body fat percentage, waist circumference(29) and
markers of inflammation(46), though betaine intake has not
been associated with decreased CVD(47). This highlights the
importance of distinguishing between greater betaine intake and elevated plasma betaine, as only the latter has been associated with potential benefits. Elevated plasma homocys-teine has been associated with increased CVD risk and increased markers of CVD risk (e.g. raised blood pressure
and elevated serum lipids(48,49)), and association with reduced
risk CVD has been found with WG cereal intake(2,14). The
elevation of plasma betaine after 1 week in the present study was relatively small, though none of the subjects had
noticeably low betaine concentrations at baseline
(, 18 mmol/l)(50), and the RG diet was not notably low in
betaine or free choline (the direct metabolic precursor of
betaine)(27). Additionally, plasma betaine concentrations are
regarded as being under strict metabolic control(51).
Homocys-teine concentrations were not affected during this interven-tion, though no subjects had notably elevated homocysteine concentrations (. 15 mmol/l). During the postprandial chal-lenge, plasma betaine, while being elevated compared with the RG diet at time 0, was further elevated after 120 min, suggesting a more important transient increase in plasma betaine, before plasma clearance. Betaine has previously been found to peak in plasma at 120 – 240 min post-dose
after a high betaine meal(52), and at 40 – 80 min post-dose
after feeding 1 – 6 g of pure betaine(53). The estimated dose of
betaine from the WG wheat breakfast cereal in the present
60 55 50 45 Plasma betaine ( µ mol/l) 40 35 30 0 60 120 Time (min) 180 240 y,z y,z y,z z y a a b a,b a
Fig. 4. Plasma betaine concentrations monitored for 240 min after a whole-grain breakfast (shredded wheat) or a refined-whole-grain breakfast (cornflakes). The interventions were taken against a background of a diet rich in whole grains or refined grains. Values are means, with standard errors represented by vertical bars.a,b,y,zTime points within the same diet with unlike letters
were significantly different (P, 0·05). All time points between diets were sig-nificantly different (P, 0·05). , Refined-grain diet; , whole-grain diet.
0
0 60 120
Time (min)
Total plasma alkyresorcinols (nmol/l)
180 a b b c c 240 50 100 150 200 250 300 350
Fig. 5. Plasma alkylresorcinol concentrations monitored for 240 min after a whole-grain breakfast (shredded wheat) or a refined-grain breakfast (cornflakes). The interventions were taken against a background of a diet rich in whole grains or refined grains. Values are means, with standard errors represented by vertical bars.a,b,cTime points within the same diet with unlike letters were significantly different (P, 0·05). All time points between diets were significantly different (P, 0·001). , Refined-grain diet; , whole-grain diet.
British
Journal
of
study was 53 mg, about ten times less than that used in the test
meal by Atkinson et al.(52)and 20 – 120 times less than the pure
betaine used by Schwab et al.(53), and more closely reflects the
impact of a standard breakfast serving on plasma betaine. The differences found suggest that dose and matrix may have a small impact on pharmacokinetics. After 2 weeks, there was no difference between the two diets for plasma betaine. This may in part be explained by the fact that little of the body’s betaine appears to be stored in plasma with rapid accumu-lation (up to twenty times that of plasma concentrations) in
the liver and kidneys(54,55). Previously, it has been reported
that betaine may increase plasma LDL and TAG at the same
time as decreasing plasma homocysteine(56). This is suggested
to be due to the increased supply of betaine, sparing choline for the production of VLDL particles, enabling better lipid transport from the liver and, consequently, a transient increase
in plasma lipids(57). In the present study, the increase in
betaine at 1 week was mirrored by an increase in TAG, with both dropping after 2 weeks. As there was no difference in lipid intake between the diets that would explain the TAG increase after 1 week, the possibility of a link with increased dietary betaine intake is intriguing.
Plasma alkylresorcinols have been proposed to be
bio-markers of WG wheat and rye intake(58), with several studies
now indicating a strong correlation between WG wheat and
rye intake, and their presence in the plasma(31,59). Not
surpris-ingly in the present study, plasma alkylresorcinols were con-siderably elevated compared with the RG diet. As refined
wheat still contains low concentrations of alkylresorcinols(32),
low concentrations were still present in the plasma during the non-WG and RG diet periods. Presently, there are little data on the plasma concentrations of alkylresorcinols on a low/non-WG cereal diet, and results from the present study suggest that concentrations of total alkylresorcinols below 60 nmol/l probably indicate a diet not containing WG. Additionally, they confirm that plasma alkylresorcinols are responsive to WG wheat and rye in the diet, as indicated by the sharp increase in concentration on the WG intervention diet, though the amount of alkylresorcinols consumed in this diet
is at the upper end of what would be consumed as part of a
‘normal’ diet(39).
During the postprandial study, there was a relatively small increase in plasma alkylresorcinols throughout the 240 min period measured. Only one study has looked at the pharma-cokinetics of alkylresorcinols in human subjects, after a rye
bran-based meal, and found that the Tmax occurs about
168 min(60), whereas the concentration still appears to be
increasing at 240 min in the present study. In a study on pigs habitually fed a rye bran-containing diet, plasma
alkyl-resorcinols remained elevated between 120 and 360 min(61),
and found that there was a marked difference in alkylresorci-nol pharmacokinetics for habitual feeding and an acute meal. The data collected in the present study over 240 min would suggest that pharmacokinetics for alkylresorcinols in human subjects are also different if measured against the background of a habitual diet containing WG wheat or rye.
The trend for decreasing weight on the WG diet was unex-pected, as most intervention studies addressing the question of weight loss or maintenance and WG diets have found no
effect on total weight loss(20,40,41), though epidemiological
evi-dence finds that WG intake is associated with lower BMI(62,63),
and one non-peer reviewed study has reported 0·9 – 1·4 kg weight loss on a WG diet compared with an energy-matched
RG diet over 4 – 6 weeks(64). The subjects in the present study
were all normal weight (BMI , 26 kg/m2) except for one
sub-ject who had a BMI of 29·6 kg/m2, making the trend for a
0·5 kg change in weight more remarkable.
Due to the inherently high fibre content of WG cereals com-pared with their refined counterparts, it has been hypoth-esised that WG cereals may play a role in modulating intestinal microbiota and alter intestinal transit. Some studies have found that WG wheat and/or rye diets alter faecal chem-istry, increasing SCFA concentrations and decreasing faecal
pH(18). The increase in stool frequency was expected, and
WG cereals have previously been demonstrated to be effective
for improving stool frequency in constipated subjects(65). One
study compared the effects of a WG wheat breakfast cereal with a wheat bran breakfast cereal over 3 weeks on faecal Table 5. Faecal microbiota population measurements during the two dietary interventions,
and the effect of the whole-grain (WG) diet compared with the refined-grain (RG) diet* (Mean values with their standard errors and 95 % confidence intervals; log10colony-forming units/g fresh weight)
RG WG RG – WG
Mean SE Mean SE Mean 95 % CI
Total bacteria 10·03 0·3 10·39 0·2 20·37 21·16, 0·41 Bifidobacterium 8·93 0·4 9·30 0·3 20·56 21·62, 0·49 Lactobacillus 6·82 0·2 6·66 0·1 0·01 20·45, 0·47 Enterobacteria 7·31 0·2 7·22 0·2 0·14 20·04, 0·32 Enterococcus 6·03 0·0 6·18 0·1 20·23† 20·47, 0·01 Clostridium coccoides 9·64 0·3 9·89 0·3 20·42 21·15, 0·31 Clostridium leptum 9·24 0·3 10·05 0·1 20·82‡ 21·51, 2 0·13 Bacteroides 8·43 0·3 8·72 0·3 20·31 21·38, 0·76
* Faecal samples were spot collections of the first bowel movement of the day. Statistical analyses per-formed on log-transper-formed data were corrected for baseline bacterial population counts, treatment order, age, sex and BMI.
† P¼ 0·056. ‡ P¼ 0·023.
British
Journal
of
Nutrition
microbiota populations, and found that bifidobacteria and
lactobacilli/enterococci populations increased with WG
wheat(19), and a similar study has found that WG maize
break-fast cereal increased faecal bifidobacteria populations after
3 weeks(66). In the relatively short duration of the present
study, there was only a weak effect (less than one log change) on the faecal microbiota, with a trend for an increase
in Enterococcus, as for Costabile et al.(19)and a small increase
in the C. leptum group. The C. leptum subpopulation is known to contain a number of bacterial species adapted for
utilising fibre as a substrate and producing butyrate(67).
Abnous et al.(68)found that C. leptum populations increased
in rats fed either wheat or oat bran. Vitaglione et al.(69)
recently proposed that the phenolic compounds bound in the dietary fibre complex may also modify the intestinal environment which may play a role in the gut microbiota population, and clostridia are associated with the metabolism
of phenolic compounds(70). The observed trend for a decrease
in faecal water pH with the WG diet fits with the increase in butyrate-producing bacteria. The 2-week intervention period was probably too short to see a ‘full’ effect of the two diets, and most studies focusing on faecal microbiota last for at
least 3 weeks(19). Nevertheless, the fact that small changes in
faecal microbiota (and by implication, intestinal microbiota) were already evident after 2 weeks suggests that longer-term WG-based diets could have an effect on microbiota popu-lations. Follow-up studies are required to investigate the long-term effects of a WG-rich diet on faecal microbiota populations.
The presence of many ‘trend’ results in the present study suggests that more significant results could have been obtained with a higher number of subjects. The daily amount of WG provided during the present study was high
compared with usual intakes of about 16 – 25 g/d(71,72) and
minimum recommended intakes of 48 – 75 g(30,37), but were
well tolerated by the subjects, with no complaints noted about the WG component of the diets. This may be in part due to the fact that all WG foods were commercially available and so aimed at being palatable for the consumer rather than for use in a scientific study. The use of WG-based foods as the base for the carbohydrate component of a normal diet appears to be a good strategy for increasing WG intake, and appears to provide benefits for CVD risk markers, even in healthy subjects.
Most studies on the effects of WG cereals on biomarkers of disease have focused on specific types of grains (e.g. barley
and brown rice(9,12,13), rye(8,15,16,73), oats(40,74)and wheat(11)),
while studies using a variety of grains have generally not
found differences from the control(21,22). Those studies using
a mixture of WG have attempted to replicate what could be possible with a ‘normal’ mixed diet, which has led to less con-trol of WG intake during the concon-trol group/arm. In the present study, a mixed WG diet, containing mostly wheat-based pro-ducts, found results on lowering LDL-cholesterol, a result that has been found previously for longer-term interventions
based on barley and brown rice(9), oats(40,74) and wheat(11).
It would appear then that the effect of WG cereals on lowering cholesterol does not necessarily need to be considered as
associated specifically with those cereals high in soluble fibre (oats and barley), but could be ascribed to a diet that is generally high in WG cereals. While the reductionist approach naturally leads to the testing of individual cereals and cereal fractions to elucidate the key components respon-sible for observed effects, it is also important to conduct studies on mixed diets that are more likely to reflect what could be consumed on a regular basis and are likely to be easier for long-term consumption. The present study, while providing a high amount of WG/d, does demonstrate that a diet based on mixed commercially available WG products can lead to a reduction in LDL-cholesterol over a relatively short period of time.
Conclusions
The present study found a tendency for an effect of a WG diet on plasma cholesterol, further supporting the epidemiological evidence that WG cereals decrease the risk of CVD. The find-ing that plasma betaine is also elevated due to a WG diet pre-sents new possibilities for mechanisms of how WG cereals
may have protective effects(28), and adds weight to the
hypothesis that the benefits of WG cereals are beyond being
a source of fibre in the diet(7). Future studies are needed to
confirm that these results can be repeated with lower amounts of WG and over longer time periods.
Acknowledgements
A. B. R., D. G. and M. B. designed the study. A. B.-L., S. O.-A., M. B., A. B. and A. B. R. carried out the clinical part of the study. S. J. B., C. N.-M., M. V., A. B.-L., R. B., A.-C. P. and A. B. R. carried out chemical analyses; L.-B. F., S. K. and S. R. provided resources, and S. E.-A., D. G. and A. B. R. performed statistical analyses. All authors contributed to the final revision of the manuscript. The present study received no specific grant from any funding agency in the public, commercial or not-for-profit sectors. The willing help of Fernand Beaud, colleagues from Nestle´ worldwide and the Nestle´ Research Center restaurant for supply of foods using the study, and par-ticipation of the subjects are gratefully acknowledged. All authors are employees of Nestle´ SA, a part of a food company that produces a range of WG cereal products.
References
1. McKeown NM, Meigs JB, Liu S, et al. (2002) Whole-grain intake is favorably associated with metabolic risk factors for type 2 diabetes and cardiovascular disease in the Framingham Offspring Study. Am J Clin Nutr 76, 390 – 398. 2. Mellen PB, Walsh TF & Herrington DM (2008) Whole grain
intake and cardiovascular disease: a meta-analysis. Nutr Metab Cardiovasc Dis 18, 283 – 290.
3. De Munter JSL, Hu FB, Spiegelman D, et al. (2007) Whole grain, bran, and germ intake and risk of type 2 diabetes: a prospective cohort study and systematic review. PLoS Med 4, 1385 – 1395.
4. Sahyoun NR, Jacques PF, Zhang XL, et al. (2006) Whole-grain intake is inversely associated with the metabolic
British
Journal
of
syndrome and mortality in older adults. Am J Clin Nutr 83, 124 – 131.
5. Larsson SC, Giovannucci E, Bergkvist L, et al. (2005) Whole grain consumption and risk of colorectal cancer: a popu-lation-based cohort of 60,000 women. Br J Cancer 92, 1803 – 1807.
6. Slavin JL, Jacobs D, Marquart L, et al. (2001) The role of whole grains in disease prevention. J Am Diet Assoc 101, 780 – 785.
7. Fardet A (2010) New hypotheses for the health-protective mechanisms of whole-grain cereals: what is beyond fibre? Nutr Res Rev 23, 65 – 134.
8. Leinonen KS, Poutanen KS & Mykkanen HM (2000) Rye bread decreases serum total and LDL cholesterol in men with moderately elevated serum cholesterol. J Nutr 130, 164 – 170.
9. Behall KM, Scholfield DJ & Hallfrisch J (2004) Diets contain-ing barley significantly reduce lipids in mildly hypercholes-terolemic men and women. Am J Clin Nutr 80, 1185 – 1193. 10. Lundin EA, Zhang JX, Lairon D, et al. (2004) Effects of meal frequency and high-fibre rye-bread diet on glucose and lipid metabolism and ileal excretion of energy and sterols in ileostomy subjects. Eur J Clin Nutr 58, 1410 – 1419. 11. Giacco R, Clemente G, Cipriano D, et al. (2010) Effects of the
regular consumption of wholemeal wheat foods on cardio-vascular risk factors in healthy people. Nutr Metab Cardio-vasc Dis 20, 186 – 194.
12. Behall KM, Scholfield DJ & Hallfrisch J (2006) Whole-grain diets reduce blood pressure in mildly hypercholesterolemic men and women. J Am Diet Assoc 106, 1445 – 1449. 13. Hallfrisch J, Scholfield DJ & Behall KM (2003) Blood pressure
reduced by whole grain diet containing barley or whole wheat and brown rice in moderately hypercholesterolemic men. Nutr Res 23, 1631 – 1642.
14. Tighe P, Duthie G, Vaughan N, et al. (2010) Effect of increased consumption of whole-grain foods on blood pressure and other cardiovascular risk markers in healthy middle-aged persons: a randomized controlled trial. Am J Clin Nutr 92, 733 – 740.
15. Leinonen K, Liukkonen K, Poutanen K, et al. (1999) Rye bread decreases postprandial insulin response but does not alter glucose response in healthy Finnish subjects. Eur J Clin Nutr 53, 262 – 267.
16. Juntunen KS, Laaksonen DE, Poutanen KS, et al. (2003) High-fiber rye bread and insulin secretion and sensitivity in healthy postmenopausal women. Am J Clin Nutr 77, 385 – 391.
17. Pereira MA, Jacobs J, Pins JJ, et al. (2002) Effect of whole grains on insulin sensitivity in overweight hyperinsulinemic adults. Am J Clin Nutr 75, 848 – 855.
18. McIntosh GH, Noakes M, Royle PJ, et al. (2003) Whole-grain rye and wheat foods and markers of bowel health in over-weight middle-aged men. Am J Clin Nutr 77, 967 – 974. 19. Costabile A, Klinder A, Fava F, et al. (2008) Whole-grain
wheat breakfast cereal has a prebiotic effect on the human gut microbiota: a double-blind, placebo-controlled, cross-over study. Br J Nutr 99, 110 – 120.
20. Melanson KJ, Angelopoulos TJ, Nguyen VT, et al. (2006) Consumption of whole-grain cereals during weight loss: effects on dietary quality, dietary fiber, magnesium, vitamin B-6, and obesity. J Am Diet Assoc 106, 1380 – 1388. 21. Andersson A, Tengblad S, Karlstrom B, et al. (2007)
Whole-grain foods do not affect insulin sensitivity or markers of lipid peroxidation and inflammation in healthy, moderately overweight subjects. J Nutr 137, 1401 – 1407.
22. Brownlee IA, Moore C, Chatfield M, et al. (2010) Markers of cardiovascular risk are not changed by increased whole-grain intake: the WHOLEheart study, a randomised, con-trolled dietary intervention. Br J Nutr 104, 125 – 134. 23. McKeown NM & Jacobs DR (2010) In defence of
phytochem-ical-rich dietary patterns. Br J Nutr 104, 1 – 3.
24. Slavin J (2003) Why whole grains are protective: biological mechanisms. Proc Nutr Soc 62, 129 – 134.
25. Jacobs J & Gallaher DD (2004) Whole grain intake and car-diovascular disease: a review. Curr Atheroscler Rep 6, 415 – 423.
26. Waggle DH, Lambert MA, Miller GD, et al. (1967) Extensive analyses of flours and millfeeds made from nine different wheat mixes. II. Amino acids, minerals, vitamins, and gross energy. Cereal Chem 44, 48 – 60.
27. Bruce SJ, Guy PA, Rezzi S, et al. (2010) Quantitative measure-ment of betaine and free choline in plasma, cereals and cereal products by isotope dilution LC – MS/MS. J Agric Food Chem 58, 2055 – 2061.
28. Vos E (2000) Whole grains and coronary heart disease. Am J Clin Nutr 71, 1009.
29. Konstantinova SV, Tell GS, Vollset SE, et al. (2008) Divergent associations of plasma choline and betaine with components of metabolic syndrome in middle age and elderly men and women. J Nutr 138, 914 – 920.
30. US Department of Health and Human Services & US Depart-ment of Agriculture (2005) Dietary Guidelines for Americans 2005, 6th ed. Washington, DC: US Goverment Printing Office.
31. Ross AB, Pineau N, Kochhar S, et al. (2009) Validation of a FFQ for estimating whole-grain cereal food intake. Br J Nutr 102, 1547 – 1551.
32. Ross AB & Kochhar S (2009) Rapid and sensitive analysis of alkylresorcinols from cereal grains and products using HPLC-Coularray-based electrochemical detection. J Agric Food Chem 57, 5187 – 5193.
33. Barbe´ F, Abdelmouttaleb I, Chango A, et al. (2001) Detection of moderate hyperhomocysteinemia: comparison of the Abbott fluorescence polarization immunoassay with the Bio-Rad and SBD-F high-performance liquid chromato-graphic assays. Amino Acids 20, 435 – 440.
34. Landberg R, A˚man P & Kamal-Eldin A (2009) A rapid gas chromatography – mass spectrometry method for quantifi-cation of alkylresorcinols in human plasma. Anal Biochem 385, 7 – 12.
35. Klinder A, Karlsson PC, Clune Y, et al. (2007) Fecal water as a non-invasive biomarker in nutritional intervention: com-parison of preparation methods and refinement of different endpoints. Nutr Cancer 57, 158 – 167.
36. Linko-Parvinen AM, Landberg R, Tikkanen MJ, et al. (2007) Alkylresorcinols from whole-grain wheat and rye are trans-ported in human plasma lipoproteins. J Nutr 137, 1137 – 1142.
37. Fuldkornspartnerskabet/Fødevarestyrelsen (2010) Hvor meget (fuldkorn) skal jeg have? (How much (wholegrain) should I have? http://www.fuldkorn.dk/hvad_er_fuldkorn/ hvor_meget_skal_jeg_have/
38. Slow S, Donaggio M, Cressey PJ, et al. (2005) The betaine content of New Zealand foods and estimated intake in the New Zealand diet. J Food Comp Anal 18, 473 – 485. 39. Ross AB, Becker W, Chen Y, et al. (2005) Intake of
alkyl-resorcinols from wheat and rye in the United Kingdom and Sweden. Br J Nutr 94, 496 – 499.
40. Maki KC, Beiseigel JM, Jonnalagadda SS, et al. (2010) Whole-grain ready-to-eat oat cereal, as part of a dietary program for weight loss, reduces low-density lipoprotein cholesterol in
British
Journal
of
adults with overweight and obesity more than a dietary pro-gram including low-fiber control foods. J Am Diet Assoc 110, 205 – 214.
41. Katcher HI, Legro RS, Kunselman AR, et al. (2008) The effects of a whole grain-enriched hypocaloric diet on cardi-ovascular disease risk factors in men and women with meta-bolic syndrome. Am J Clin Nutr 87, 79 – 90.
42. Priebe MG, Wang H, Weening D, et al. (2010) Factors related to colonic fermentation of nondigestible carbohydrates of a previous evening meal increase tissue glucose uptake and moderate glucose-associated inflammation. Am J Clin Nutr 91, 90 – 97.
43. Craig SA (2004) Betaine in human nutrition. Am J Clin Nutr 80, 539 – 549.
44. Olthof MR, van VT, Boelsma E, et al. (2003) Low dose betaine supplementation leads to immediate and long term lowering of plasma homocysteine in healthy men and women. J Nutr 133, 4135 – 4138.
45. Chiuve SE, Giovannucci EL, Hankinson SE, et al. (2007) The association between betaine and choline intakes and the plasma concentrations of homocysteine in women. Am J Clin Nutr 86, 1073 – 1081.
46. Detopoulou P, Panagiotakos DB, Antonopoulou S, et al. (2008) Dietary choline and betaine intakes in relation to con-centrations of inflammatory markers in healthy adults: the ATTICA study. Am J Clin Nutr 87, 424 – 430.
47. Dalmeijer GW, Olthof MR, Verhoef P, et al. (2008) Prospec-tive study on dietary intakes of folate, betaine, and choline and cardiovascular disease risk in women. Eur J Clin Nutr 62, 386 – 394.
48. McNulty H, Pentieva K, Hoey L, et al. (2008) Homocysteine, B-vitamins and CVD. Proc Nutr Soc 67, 232 – 237.
49. Refsum H, Nurk E, Smith AD, et al. (2006) The Hordaland Homocysteine Study: a community-based study of homocys-teine, its determinants, and associations with disease. J Nutr 136, 1731S – 1740S.
50. Allen RH, Stabler SP & Lindenbaum J (1993) Serum betaine, N,N-dimethylglycine and N-methylglycine levels in patients with cobalamin and folate deficiency and related inborn errors of metabolism. Metab Clin Exp 42, 1448 – 1460. 51. Ueland PM, Holm PI & Hustad S (2005) Betaine: a key
modulator of one-carbon metabolism and homocysteine status. Clin Chem Lab Med 43, 1069 – 1075.
52. Atkinson W, Elmslie J, Lever M, et al. (2008) Dietary and sup-plementary betaine: acute effects on plasma betaine and homocysteine concentrations under standard and post-methionine load conditions in healthy male subjects. Am J Clin Nutr 87, 577 – 585.
53. Schwab U, To¨rro¨nen A, Meririnne E, et al. (2006) Orally administered betaine has an acute and dose-dependent effect on serum betaine and plasma homocysteine concen-trations in healthy humans. J Nutr 136, 34 – 38.
54. Ikeda GJ, Miller E & Sapienza PP (1985) Maternal-foetal dis-tribution studies in late pregnancy. 1. Disdis-tribution of [N-methyl-14C]betaine in tissues of beagle dogs and miniature pigs. Food Chem Toxicol 23, 609 – 614.
55. Slow S, Lever M, Chambers ST, et al. (2009) Plasma depen-dent and independepen-dent accumulation of betaine in male and female rat tissues. Physiol Res 58, 403 – 410.
56. Olthof MR, van Vliet T, Verhoef P, et al. (2005) Effect of homocysteine-lowering nutrients on blood lipids: results from four randomised, placebo-controlled studies in healthy humans. PLoS Med 2, 0446 – 0456.
57. Zeisel SH (2006) Betaine supplementation and blood lipids: fact or artifact? Nutr Rev 64, 77 – 79.
58. Ross AB, Kamal-Eldin A & A˚man P (2004) Dietary alkylresor-cinols: absorption, bioactivities, and possible use as bio-markers of whole-grain wheat- and rye-rich foods. Nutr Rev 62, 81 – 95.
59. Landberg R, Kamal-Eldin A, Andersson A, et al. (2008) Alkyl-resorcinols as biomarkers of whole-grain wheat and rye intake: plasma concentration and intake estimated from diet-ary records. Am J Clin Nutr 87, 832 – 838.
60. Landberg R, Linko AM, Kamal-Eldin A, et al. (2006) Human plasma kinetics and relative bioavailability of alkylresorci-nols after intake of rye bran. J Nutr 136, 2760 – 2765. 61. Linko AM, Ross AB, Kamal-Eldin A, et al. (2006) Kinetics of
the appearance of cereal alkylresorcinols in pig plasma. Br J Nutr 95, 282 – 287.
62. Harland JI & Garton LE (2008) Whole-grain intake as a marker of healthy body weight and adiposity. Public Health Nutr 11, 554 – 563.
63. McKeown NM, Yoshida M, Shea MK, et al. (2009) Whole-grain intake and cereal fiber are associated with lower abdominal adiposity in older adults. J Nutr 139, 1950 – 1955. 64. Jacobs DR, Murtaugh MA, Pereira MA, et al. (2004) Commer-cially available whole grain foods reduce body weight com-pared to equal servings of refined grain foods. FASEB J (Abstracts 128.1).
65. Holma R, Hongisto SM, Saxelin M, et al. (2010) Constipation is relieved more by rye bread than wheat bread or laxatives without increased adverse gastrointestinal effects. J Nutr 140, 534 – 541.
66. Carvalho-Wells AL, Helmolz K, Nodet C, et al. (2010) Deter-mination of the in vivo prebiotic potential of a maize-based whole grain breakfast cereal: a human feeding study. Br J Nutr 104, 1353 – 1356.
67. Shen J, Zhang B, Wei G, et al. (2006) Molecular profiling of the Clostridium leptum subgroup in human fecal microflora by PCR-denaturing gradient gel electrophoresis and clone library analysis. Appl Environ Microbiol 72, 5232 – 5238. 68. Abnous K, Brooks SPJ, Kwan J, et al. (2009) Diets enriched in
oat bran or wheat bran temporally and differentially alter the composition of the fecal community of rats. J Nutr 139, 2024 – 2031.
69. Vitaglione P, Napolitano A & Fogliano V (2008) Cereal diet-ary fibre: a natural functional ingredient to deliver phenolic compounds into the gut. Trends Food Sci Technol 19, 451 – 463.
70. Selma MV, Espin JC & Tomas-Barberan FA (2009) Interaction between phenolics and gut microbiota: role in human health. J Agric Food Chem 57, 6485 – 6501.
71. Cleveland LE, Moshfegh AJ, Albertson AM, et al. (2000) Diet-ary intake of whole grains. J Am Coll Nutr 19, 331S – 338S. 72. Maras JE, Newby PK, Bakun PJ, et al. (2009) Whole grain
intake: The Baltimore Longitudinal Study of Aging. J Food Compost Anal 22, 53 – 58.
73. Gra˚sten SM, Juntunen KS, Poutanen KS, et al. (2000) Rye bread improves bowel function and decreases the concen-trations of some compounds that are putative colon cancer risk markers in middle-aged women and men. J Nutr 130, 2215 – 2221.
74. Pins JJ, Geleva D, Keenan JM, et al. (2002) Do whole-grain oat cereals reduce the need for antihypertensive medications and improve blood pressure control? J Fam Pract 51, 353 – 359.