THE SURFACE WATER STORAGE PROBLEM IN ARID REGIONS: A CASE STUDY OF THE GARGAR DAM, ALGERIA
H. Benfetta1*, A. Ouadja2
1
University of Mostaganem Algeria 2
Department of Hydraulic, University of Mascara, Algeria
Received: 15 April 2017 / Accepted: 24 August 2017 / Published online: 01 September 2017
ABSTRACT
Most dams lose capacity as a result of three principal phenomena: leakage, sedimentation and evaporation. The study of these phenomena is particularly important as they can also endanger the dam’s stability. Here, we examine the case of the Gargar dam in western Algeria. This dam is located in an arid zone where water resources are becoming increasingly scarce. It is situated 5 km from the city of Ghelizane and is subject to considerable water loss. It has never been filled to capacity, and is now threatened by leakages that are clearly evolving over time. This article extends our earlier studies of the dam. Our work has estimated total average losses of 25 million m3 /year for the period 1988–2015, made up of leakage (0.3 million m3 /year) and evaporation (18 million m3 /year), while dead storage accounts for 4.6 million m3 /year. However, total losses for 2004 were estimated at 113.9 million m3, which increased to the alarming value of 166.8 million m3 in 2015. We analyze variation in leakage as a function of the reservoir level, and quantify losses due to leaks, sedimentation and evaporation.
Keywords: Gargar Dam; Leakage; Sedimentation; Evaporation; Arid areas; Algeria.
Author Correspondence, e-mail: benfettahassen@yahoo.fr doi: http://dx.doi.org/10.4314/jfas.v9i3.22
1. INTRODUCTION
Annual average rainfall in Algeria is estimated at 100 billion m3. Of this, 80 billion m3 evaporates, 5 billion m3 is lost to surface runoff, 3 billion m3 seeps into the ground [1], while
ISSN 1112-9867
Available online at http://www.jfas.info
Journal of Fundamental and Applied Sciences is licensed under aCreative Commons Attribution-NonCommercial 4.0
most of the remainder (73 109 m3) pours directly into the sea. Currently, the country has more than 50 operational dams, with a capacity of 5 billion m3, providing an annual volume of 20 billion m3 of water for human consumption, industry and irrigation. Not only has drought afflicted the country for the past twenty years, but also reservoirs are subject to intense evaporation, high levels of sedimentation and leakage. Most Algerian dams have a lifespan of about thirty years. However, it is rare to abandon a dam so soon, especially when the reservoir holds water intended for human consumption or irrigation. Reservoirs and lakes in arid areas are particularly exposed to evaporation due to high air temperatures (especially in the dry season), hot sun (all year) and strong, dry winds (especially in the autumn and spring), which leads to very high annual losses. For example, annual average losses for the Bouhanifia dam (which has never reached its maximal capacity) are estimated at 50 million m3 /year for the period 1940–2016. In turn, annual losses due to sedimentation are estimated at 50 million m3 /year for the period 1986–2015 and losses due to leakage were estimated at more 40 million m3 /year for the period 1986–2015. Certain dams are particularly affected: average annual leakage from the Foum El Gherza dam is estimated at 5 million m3 /year and 11 million m3 /year from the Ouizert dam, where record losses of 23.34 million m3 were recorded for the year 1995–1996. The smaller Foum el Gherza dam (capacity 47 million m3). Commissioned in 1950, it is fed by the El Abiod river. Its location, on Maestrichian limestone results in leakage of up to 5 million m3 /year. However, here it is likely that sedimentation has helped to slow losses over time. Another example is the Hammam Grouz dam, where average leakage is around 50,000 m3 /day (i.e., ten times higher than the Foum El Gherza). This is mainly due to high levels of erosion (heavy rain, lack of vegetation, Bare relief geologically young , etc.). Leakage leads to considerable losses of valuable, scarce water. It also presents a serious threat to the stability of hydraulic structures and exacerbates the problems of sedimentation and evaporation [11]. Leakage has evolved over time. While most dams in Algeria are threatened by the phenomenon, it particularly affects those that are situated in arid and semi-arid areas where economic development is closely linked to the availability of water. Our work has estimated total average losses of 25 million m3 /year for the period 1988–2015. However, total losses in 2004 were estimated to be about 113.9 million m3, which increased to the alarming value of 166.8 million m3 in 2015. Earlier work has analyzed this variation as a function of losses due to leakage, sedimentation and evaporation [12]. The Algerian National Agency for Dams and Transfers (ANDT) currently takes daily measurements of evaporation from 39 major dams with a total capacity of 3.8 billion m3. Maximum evaporation (350 million m3) was recorded in 1992–1993 and the minimum (100 million m3) in 2001–2002.
The annual average over the period 1992–2002 was 250 million m3 (6.5% of total capacity). These data highlight a clear evaporation gradient: in the coastal zone (up to 50 km from the sea) annual evaporation is <0.5 m3 /year, compared with a band 50–150 km from the coast, where it is 0.5 – 1 m3 /year. In some cases, leakage is so substantial that a collection system has been put in place to recover water lost downstream and direct it to farmland. In recent years, the total volume lost ranges from 20–75 million m3. However, until now, no detailed analysis has been performed of the Agency’s data.
Fifty-seven major dams currently operate in coastal and central areas, while only eight are in the (arid) south. The Djorf Torba dam in southwest Algeria, illustrates the problem of evaporation. Commissioned in 1963, the dam has a capacity of 350 million m3. Between 1992 and 2002, losses due to evaporation exceeded the the quantity needed for the supply of drinking water and irrigation. They reached 90 million m³ in 1994, which represented approximately twice the total volume required for consumption. Maximum losses of 18 million m3 were recorded in 1994–1995. Since then, increasing losses have been explained by sedimentation [1] [10]. The abundance of carbonate series and karst topography throughout Northern Maghreb suggest that there is a high risk of the loss of surface water in wadi beds such as reservoirs. Although in some cases (notably the dams of Djorf Torba and Foum el Gherza), fine cracks can close over time, the phenomenon is not systematic: when the karst network consists of large conduits, sedimentation does not have a significant impact on the surface–subsurface exchange. This is the case for the Ouizert dam (in Algeria) and the El Haouareb Merguellil dam (in Tunisia), where sedimentation has reduced losses due to leakage [8] [9]. In Algeria, we have identified 25 dams where losses exceed 1 million m3 /year. In six cases, leakage exceeds 5 million m3 /year, notably including the Gargar dam (Subject of our study). This dam is extremely susceptible to leakage and a gradual reduction in its storage capacity has been observed over time. In this study, we examine the reasons and analyze the variation in losses due to leakages, sedimentation and evaporation [12].
2. DATA AND METHODS
2.1. Location and Characteristic of the Gargar Dam
With a capacity of 450 million m3, the Gargar dam is the third-largest in Algeria, after Beni Haroun (998 million m3) and Koudiat Acerdoune (650 million m3). The dam is located in Gargar (Relizane province), 5 km southwest of the village of Oued Rhiou, and 3 km upstream from the bridge on the Rhiou river (which is a tributary to the Chellif) in the Cheliff Zahrez watershed where dams are most exposed to sedimentation. The study area forms part of the
Rhiou river watershed, which covers an area of 2,900 km2. A gorge, carved into the crest of the limestone hills along the southern edge of the plain of Chellif, forms the dam site. Made of clay, the dam created a large reservoir designed to contain the highly-seasonal flow of the Rhiou river, with annual average inflow of 185 hm3 [1].
The first study in preparation for the construction of the dam was conducted in 1926, and was followed by further studies in 1929, 1932 and 1967, among others. Initially, three other sites were examined, before an embankment dam was finally built in the area of the gorge of Gargar, exploiting the geotechnical soil conditions and available materials. In 1980, the General Directorate of Water Infrastructure hired the British company WS Atkins to develop a detailed design and tender package, and carry out hydraulic tests. With respect to the spillway model, the consultants submitted a package of reports and design studies in September 1982 [15]. At the end of 1983, a contract for the construction and installation of hydromechanical and electromechanical equipment was awarded to the Hamza group, and C. Itoh & Company Ltd (Japan). In mid-1984, final plans were prepared by Hamza. In early 1985, a contract was awarded to the Portuguese engineering company Coba Consultores Para Obras Barragens E Planejamento Ltda. Work began in June 1984, and ended in October1988, while the reservoir was filled in November 1988. Provisional acceptance was given in March1989 and final acceptance in September 1990 (fig 1. 2 and 3) [15].
Fig.1. Location of the Gargar dam: Source : own elaboration
Fig.2. Overview of the Gargar dam: Source: Benfetta, 01/01/2004
Fig.3. The lake created by the Gargar dam : Source: Benfetta, 01/01/2004
The dam supplies water for the irrigation of 16,000 hectares in the Lower Cheliff plains and supplies drinking water to the city of Oran and 15 other towns and villages in the Relizane and Mostaganem provinces. According to the National Water Plan, the Lower Cheliff irrigation perimeter is 50 hm3 /year. An average of 97,000 m3 /day (35 hm3 /year) is needed to supply drinking water. During the period 1992–2004, when water was supplied to the city of Oran, the reservoir’s volume dropped by an average of 30.36 hm3 /year. Other towns and villages in the area (population 33,763 in 2003) were expected to require about 5 hm3 /year. However, water supply to the area for the period July–August 2003 was about 9.64 hm3. It is
predicted that in the near future, nine locations in Relizane province will require 400 L s (13 hm3 /year). At the same time, a water treatment plant is scheduled to come online1 [1] [10]. The climate in the watershed has two features. The upper basin is characterized by a rainy mountainous climate, with cold to relatively low temperatures and heavy snow. The lower basin is characterized by a relatively warm, dry climate with high temperature variation. Average monthly temperature in 2006 ranged from 8.40–39.84°C with an annual average of 18.2°C. Rainfall and hydrometric data were used to reconstruct a continuous series over a 19-year period (1990–2008), which found an annual average of 72.58 hm3 /year. For the period 1984–2008, sedimentation was estimated at 4.5 hm3 with an annual percentage of about 2.5% of initial capacity[1] [12]. The dam’s lifespan has been estimated at about 150 years. Vegetation includes olea, quercus ilex, pinus halepensis and olea europaea. Thuja dominates to the west of the Rhiou river, but this highly-resistant genus is subject to ongoing degradation due to human actions and forest fires (fig 4 ) [1] [12] [15].
Fig.4. Vegetation cover: source : own elaboration
2.2. Geological and Hydrogeological Context
At the dam site, the Rhiou River has cut a gorge into the limestone cliffs of the Gargar and Abbadia Djebels. This topography means that there has been longstanding interest in
1
The communities involved in this project are: Oued Djemaa, Zemmour, Beni Dergoune, Ouled Aiche, Hassi Ben Abdellah Diar, Mendes, and Oued Sidi Slema Lazreg, with a total population of 49,384 inhabitants (2003).
constructing a dam. Upstream, the valley expands around the village of El Alef to form a natural basin that is largely covered by limestone (WS Atkins 1982). The Tortonian marl is covered by a discontinuous limestone ridge of the same age. The river bed contains thick deposits of recent alluvium consisting of sand, gravel and pebbles, together with silt and clay. Excavation of the dam site found that the alluvium extends to −115 m, −42 m at the coast and −38 m along the axis of the dam’s river channel. There is evidence of large variations in the river level in the geological past. Karst features, although small, are frequently found on both the right and left banks of the river. Excavation of the spillway found funnel structures and underground channels filled with silt or clay as a result of dissolution. The upper area of the dam has extensive recent terraces of clay and silt. The mountainous slopes and ridges overlooking the gorge are smooth, showing that they were levelled by sediment transport when the sea level was much higher than the present day [13] [15]. Lugeon tests carried out before the start of the project showed a mean (range) permeability of 2 (1–15) Lugeon close to the surface and 10 (1–15) Lugeon at depth. During implementation of the project and the injection of water, the mean (range) permeability down to the marl clay (passing through the limestone, sandy marl and conglomerate) was 51 (1–580) Lugeon. Tests carried out on the marl clay after clearing the river bed of alluvium gave a mean permeability of about 1 Lugeon, which led to a decision not to inject any water [13] [15].
The reservoir basin is mostly composed of relatively impermeable marls, which form a natural curtain that prevents percolation losses. Limestone outcrops are found over a considerable distance on both sides of the dam’s supports. Many Lugeon limestone tests were carried out, and all found low numbers (maximum 15) despite fractures, faults and micro karst features in some areas. This impermeability and the length of flow paths suggest low seepage losses [1]. Although the groundwater level is lower, it barely rises above the level of the river. A certain volume of water was absorbed into the soil during the establishment of the new groundwater regime. While there are no geologic structures that could cause large-scale leaks, several minor karst features characterized by secondary porosity are observed, which are probably close to vertical cracks. It was therefore considered prudent to extend the grout curtain to approximately 150 m on each wing to help to locate any other karst areas that could potentially cause leakage. The grout curtain was continuous in order to limit permeability to below 5 Lugeon. The risk of leakage through the karst is also present in areas below the dam’s wings. However, early surveys suggested that the extension of the injection program to more than 150 m beyond the dam was unwarranted, unless exceptional features appeared during the injection. It was thought that if percolation areas subsequently developed along
pathways in downstream areas, additional injections could be needed (fig 5, 6 and 7) [13] [15].
Fig.5. Geology of the site of Gargar dam: source: own elaboration
Fig.7. Leaks in the banks of the Gargar dam (Source: Benfetta 2008)
2.3. Data Included
Leakage volume; reservoir level; sedimentation and evaporation levels. Data were provided by the ANDT for the period 1988–2015. Photographs were obtained during the authors’ visit to the dam in May, 2011. The study consisted of two parts: (1) the analysis of hydraulic problems (leakage, evaporation, sedimentation); and (2) the quantification of losses [2] [6].
3. RESULTS AND DISCUSSION 3.1. Losses due to leakage
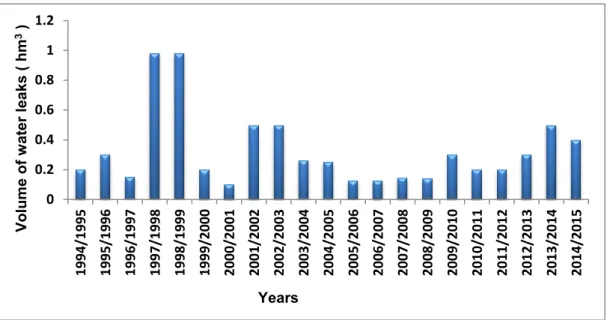
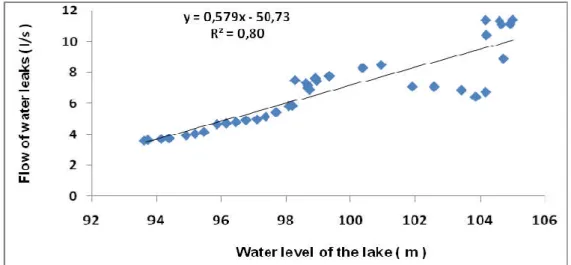
The first analysis concerned the volume of leakage through a study of variations overtime and as a function of the reservoir level. Figure 8 shows leakage estimated by the ANDT for the period 1994–2015 and highlights significant variation. Average annual loss is 0.3 hm3 /year. The problem is ongoing, and changes from one year to another. Figure 9 shows variation in leakage as a function of the reservoir level, and highlights the close correlation (R2 = 0.98). The second part of the study analyzed leakage flow rates (l/s) for 2004–2008 (fig 10, 11 and 12) and as a function of the reservoir level (fig 13). Figures 10 and 11 show data for the hydrological years 2005–2006; figures 10, 11 and 12 are discussed in more detail below.
Fig.8. Leakage (hm
Fig.9. Leakage (hm3) as a function of the reservoir level (m):
Figure 10 shows that the flow rate through the left bank exceeded 4.3 l/s in February 2004, reaching 5.98 l/s in May 2004. The flow rate subsequently fell, due to the reduction in the volume of water in the reservoir, reaching 0.81 l/s in January 2006. Figure 11 shows th flow rate through the right bank exceeded 4.6 l/s in February 2004, reaching 5.98 l/s in May 2004. Like the left bank, the reduction in the volume of water in the reservoir led to a significant fall in the flow rate, reaching 2.25 l/s in November 20
leakage flow rates. This follows trends for each bank. A minimum value 8.5 l/s was recorded in February 2004, reaching 12 l/s in May 2004. Like the two banks, levels subsequently fell due to falling water levels in the reservoir,
0 0.2 0.4 0.6 0.8 1 1.2 1994/1995 1995/1996 1996/1997 1997/1998 1998/1999 Volume of w ater le aks ( hm 3)
y = 0.0105x
0 0.05 0.1 0.15 0.2 0.25 0.3 92 94 Volume of w ater le aks ( hm 3)Leakage (hm3) 1994–2015: Source: own elaboration
) as a function of the reservoir level (m): Source: own elaboration
that the flow rate through the left bank exceeded 4.3 l/s in February 2004, reaching 5.98 l/s in May 2004. The flow rate subsequently fell, due to the reduction in the volume of water in the reservoir, reaching 0.81 l/s in January 2006. Figure 11 shows th flow rate through the right bank exceeded 4.6 l/s in February 2004, reaching 5.98 l/s in May 2004. Like the left bank, the reduction in the volume of water in the reservoir led to a significant fall in the flow rate, reaching 2.25 l/s in November 2006. Figure 12 shows total leakage flow rates. This follows trends for each bank. A minimum value 8.5 l/s was recorded in February 2004, reaching 12 l/s in May 2004. Like the two banks, levels subsequently fell due to falling water levels in the reservoir, reaching 2.18 l/s in January 2008
1998/1999 1999/2000 2000/2001 2001/2002 2002/2003 2003/2004 2004/2005 2005/2006 2006/2007 2007/2008 2008/2009 2009/2010 2010/2011 2011/2012
Years
y = 0.0105x - 0.845
R² = 0.9855
96 98 100 102 104
water level of the lake (m)
Source: own elaboration
Source: own elaboration
that the flow rate through the left bank exceeded 4.3 l/s in February 2004, reaching 5.98 l/s in May 2004. The flow rate subsequently fell, due to the reduction in the volume of water in the reservoir, reaching 0.81 l/s in January 2006. Figure 11 shows that the flow rate through the right bank exceeded 4.6 l/s in February 2004, reaching 5.98 l/s in May 2004. Like the left bank, the reduction in the volume of water in the reservoir led to a 06. Figure 12 shows total leakage flow rates. This follows trends for each bank. A minimum value 8.5 l/s was recorded in February 2004, reaching 12 l/s in May 2004. Like the two banks, levels subsequently fell
reaching 2.18 l/s in January 2008.
2011/2012 2012/2013 2013/2014 2014/2015
Fig.10. Left bank leakage flow rate (litres/ second) 2004
Fig.11. Right bank leakage flow rate(litres/ second) 2004
Fig.12. Total leakage flow rate (litres/ second) 2004
0 1 2 3 4 5 03/08/2004 03/08/2005 w ater leak s (l / s) 0 2 4 6 8 10 12 16/02/2004 16/02/2005 T ot al leak age (l/s)
eft bank leakage flow rate (litres/ second) 2004–2008: elaboration
Right bank leakage flow rate(litres/ second) 2004–2008: Source: Own elaboration
Total leakage flow rate (litres/ second) 2004–2008: Source: Own elaboration
03/08/2005 03/08/2006 03/08/2007 Dates 16/02/2005 16/02/2006 16/02/2007 16/02/2008 Dates Gallery RG Gallery RD 2008: source: own
Source: Own elaboration
Source: Own elaboration
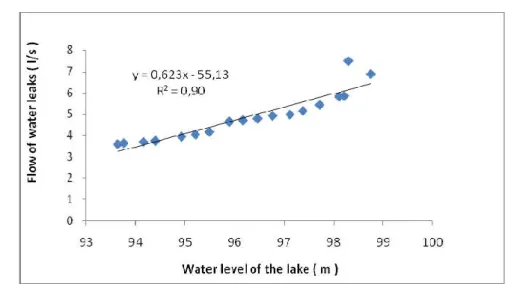
Figure 13 shows variation in flow rate as a function of the reservoir level for all hydrological years. Flow increases linearly with the water level. The two highest correlation c
(0.80 and 0.90) were calculated for the hydrological years 2004
and 15). Figure 13 shows that flow rates increase consistently up to a reservoir level of 98 m, beyond which there is a more rapid increase. This could b
m, flow is governed by Darcy’s law and depends on the permeability of the massif. Above 98 m, underground flows no longer follow this law and instead pass through highly permeable layers or faults. This increase was pa
2005 and 2005–2006. Increasing hydrostatic pressure, due to the progressive increase in the reservoir level resulted in a notable decrease in load. This resulted in the deterioration of the rock massif at the dam site, which translated into significant cracks
Fig.13. Leakage (litres/ second) as a function of reservoir level (metres):
Fig.14. Leakage (litres/ second) as a function of reservoir level (m) 2004
y = 0,548x
R² = 0,80
0 2 4 6 8 10 12 90w
at
er lea
ks (
l/
s)
Figure 13 shows variation in flow rate as a function of the reservoir level for all hydrological years. Flow increases linearly with the water level. The two highest correlation c
(0.80 and 0.90) were calculated for the hydrological years 2004–2005 and 2005
and 15). Figure 13 shows that flow rates increase consistently up to a reservoir level of 98 m, beyond which there is a more rapid increase. This could be explained by the fact that up to 98 m, flow is governed by Darcy’s law and depends on the permeability of the massif. Above 98 m, underground flows no longer follow this law and instead pass through highly permeable layers or faults. This increase was particularly remarkable for the hydrological years 2004
2006. Increasing hydrostatic pressure, due to the progressive increase in the reservoir level resulted in a notable decrease in load. This resulted in the deterioration of the
at the dam site, which translated into significant cracks [3] [4] [5]
Leakage (litres/ second) as a function of reservoir level (metres): elaboration
Leakage (litres/ second) as a function of reservoir level (m) 2004– elaboration
y = 0,548x - 47,88
R² = 0,80
92 94 96 98 100 102 104
water level of the lake (m)
Figure 13 shows variation in flow rate as a function of the reservoir level for all hydrological years. Flow increases linearly with the water level. The two highest correlation coefficients 2005 and 2005–2006 (fig 14 and 15). Figure 13 shows that flow rates increase consistently up to a reservoir level of 98 m, e explained by the fact that up to 98 m, flow is governed by Darcy’s law and depends on the permeability of the massif. Above 98 m, underground flows no longer follow this law and instead pass through highly permeable hydrological years 2004– 2006. Increasing hydrostatic pressure, due to the progressive increase in the reservoir level resulted in a notable decrease in load. This resulted in the deterioration of the
[3] [4] [5].
Leakage (litres/ second) as a function of reservoir level (metres): source: Own
–2005: source: own
Fig.15. Leakage (litres/ second) as a function of reservoir level (m) 2005
Figure 16 shows the variation of the volume of the reservoir from 2004
volume falls to drought conditions. Furthermore, Figure 17 shows how leakage falls as a function of the reservoir’s volume and shows that low rates are closely correl
Fig.16. Reservoir volume (hm
Fig.17. Leakage (litres/ second) as a function of reservoir volume (hm Leakage (litres/ second) as a function of reservoir level (m) 2005–
elaboration
Figure 16 shows the variation of the volume of the reservoir from 2004–
volume falls to drought conditions. Furthermore, Figure 17 shows how leakage falls as a volume and shows that low rates are closely correl
Reservoir volume (hm3) 2004–2008: Source: Own elaboration
Leakage (litres/ second) as a function of reservoir volume (hm3 elaboration
–2006: source: own
–2008. Overall, the volume falls to drought conditions. Furthermore, Figure 17 shows how leakage falls as a volume and shows that low rates are closely correlated (R2 = 0.72).
Source: Own elaboration
3
Figure 7 shows leakages. The upstream body of water at the foot of the dam is separated from the basin by a batardeau. Although leaks are observed in the joints of the injection and drainage galleries of both banks, they are much more significant in right
the right bank is in contact with the reservoir, while the left bank is in contact with the body of water located upstream of the dam. Leakage in the two galleries increases as a function of rises in the reservoir level and decreases
leaks are sealed by the adhesion of molten limestone. The initial design of the dam did not include any devices to measure such leakage. These leakages are also due to the presence of a strong hydraulic gradient. However, the increase of this rate in time and for the same water level of the lake indicates deterioration of the rock mass forming the support of the dam. The rate of leakages was almost on the increase in time and especially when the water level reservoir is above the coast 98 m. This could be explained by the fact that the increased hydrostatic pressure resulted in a deterioration of the bedrock by the appearance of large cracks. It’s due to the degraded state of the geological layers. Th
the flow rate at the exit points of galleries in the right and left bank. Additional test points would enhance the reliability of measures and make it possible to differentiate leaks in the various galleries (injection, drai
of cracks, which can expand if the reservoir level rises (due to increased water pressure) 3.2.Losses due to Evaporation
The analyses presented here are based on operational data provided by period 1989–2015 (ANDT 1988
These range from 5–32.2 hm
shows evaporation as a percentage of total water losses. Total lo /year, with an annual average of 26.50 hm
evaporation (R2 = 1).
Fig.18. Evaporation at the Gargar dam: source: Benfetta 2008
Figure 7 shows leakages. The upstream body of water at the foot of the dam is separated from the basin by a batardeau. Although leaks are observed in the joints of the injection and drainage galleries of both banks, they are much more significant in right bank. This is because the right bank is in contact with the reservoir, while the left bank is in contact with the body of water located upstream of the dam. Leakage in the two galleries increases as a function of rises in the reservoir level and decreases due to sealing after a long period
leaks are sealed by the adhesion of molten limestone. The initial design of the dam did not include any devices to measure such leakage. These leakages are also due to the presence of a dient. However, the increase of this rate in time and for the same water level of the lake indicates deterioration of the rock mass forming the support of the dam. The rate of leakages was almost on the increase in time and especially when the water level reservoir is above the coast 98 m. This could be explained by the fact that the increased hydrostatic pressure resulted in a deterioration of the bedrock by the appearance of large cracks. It’s due to the degraded state of the geological layers. The current solution is to record the flow rate at the exit points of galleries in the right and left bank. Additional test points would enhance the reliability of measures and make it possible to differentiate leaks in the various galleries (injection, drainage and access). It is also important to observe the progress of cracks, which can expand if the reservoir level rises (due to increased water pressure)
osses due to Evaporation
The analyses presented here are based on operational data provided by
ANDT 1988–2015b). Figures 18 and 19 show losses due to evaporation. 32.2 hm3 /year, with an annual average of 21.6 hm
shows evaporation as a percentage of total water losses. Total losses range from 9.9
/year, with an annual average of 26.50 hm3 /year and there is a very close correlation with
Evaporation at the Gargar dam: source: Benfetta 2008
Figure 7 shows leakages. The upstream body of water at the foot of the dam is separated from the basin by a batardeau. Although leaks are observed in the joints of the injection and bank. This is because the right bank is in contact with the reservoir, while the left bank is in contact with the body of water located upstream of the dam. Leakage in the two galleries increases as a function of due to sealing after a long period [3] [14]. Some leaks are sealed by the adhesion of molten limestone. The initial design of the dam did not include any devices to measure such leakage. These leakages are also due to the presence of a dient. However, the increase of this rate in time and for the same water level of the lake indicates deterioration of the rock mass forming the support of the dam. The rate of leakages was almost on the increase in time and especially when the water level in the reservoir is above the coast 98 m. This could be explained by the fact that the increased hydrostatic pressure resulted in a deterioration of the bedrock by the appearance of large e current solution is to record the flow rate at the exit points of galleries in the right and left bank. Additional test points would enhance the reliability of measures and make it possible to differentiate leaks in the nage and access). It is also important to observe the progress of cracks, which can expand if the reservoir level rises (due to increased water pressure) [3].
The analyses presented here are based on operational data provided by the ADNT for the Figures 18 and 19 show losses due to evaporation. /year, with an annual average of 21.6 hm3 /year. Figure 20 sses range from 9.9–37.1 hm3 /year and there is a very close correlation with
Fig.19. Evaporation (hm
Fig.20. Evaporation (hm3)
3.3. Losses due to sedimentation
From 1988–2008, sedimentation volume was 112.5 hm
4.6 hm3. In 2008, sediment represented approximately 25% (112.5 hm capacity. In 2015, this volume was estimated to be 144.7 hm
Education launched a study in June 2003 to evaluate the storage capacity
sedimentation at the dam consisting of bathymetric and topographic surveys. Depth profiles were established at 50-metre intervals in the area 1, 000 meters from the dam, and at intervals of 100 m beyond this limit. The bathymetric survey, cove
Evaporation (hm3)1989–2015: Source: Own elaboration
) as a function of total losses(hm3): Source: own elaboration
osses due to sedimentation
2008, sedimentation volume was 112.5 hm3, with a forecast annual average . In 2008, sediment represented approximately 25% (112.5 hm3) of the dam’s initial capacity. In 2015, this volume was estimated to be 144.7 hm3 [10]). The Algerian Office of Education launched a study in June 2003 to evaluate the storage capacity
sedimentation at the dam consisting of bathymetric and topographic surveys. Depth profiles metre intervals in the area 1, 000 meters from the dam, and at intervals of 100 m beyond this limit. The bathymetric survey, covering a total area of 1, 319 hectares
: Source: Own elaboration
ource: own elaboration
, with a forecast annual average of ) of the dam’s initial ). The Algerian Office of Education launched a study in June 2003 to evaluate the storage capacity and monitor sedimentation at the dam consisting of bathymetric and topographic surveys. Depth profiles metre intervals in the area 1, 000 meters from the dam, and at intervals ring a total area of 1, 319 hectares
was carried out between 20 January and 10 February, 2004. Taking its initial capacity as a reference, the reservoir had lost about 91.72 hm3 of its capacity by March 2004 (approximately 20.4%). This corresponds to an average loss of about 6,114,600 m3 year. Its current volume is about 358.28 hm3 [3].
4. TOTAL LOSSES
Not only have losses increased over time, the problem is ongoing, and the situation is deteriorating. Taking 2015 as a baseline, estimated losses are as follows (excluding losses from the bottom outlet):
Lv = Iv + Ev + Dv Lv: volume of losses.
Dv: Dead volume (4.6 hm3 /year).
Iv: Infiltrated (leakage) volume (0.3 hm3 /year). Ev: Evaporated volume (21.6 hm3 /year).
Based on data from the bathymetric survey conducted in 2004, the dam has lost 92 million m3 of water over a period of 15 years. This is due to excessive sedimentation, leakage (annual average 0.3 hm3) and evaporation (annual average 21.6 hm3). Total losses for 2004 are estimated at 113.9 hm3, which represents about 25.31% of total capacity (fig 21, 22 and 23). Taking 2015 as the baseline, current losses are estimated as:
- Average inter-annual leakage of 0.5 hm3. - Average inter-annual evaporation of 21.6 hm3. - Estimated sedimentation of 144.7 hm3.
Fig.21. Sources of water loss 1998
Fig.23. Total water losses (%) 1998
113.9
Fig.22. Total water losses(hm
Sources of water loss 1998–2004: source: own elaboration
Total water losses (%) 1998–2004: source: own elaboration
450
Initial capacity (hm3) total losses (hm3)
Total water losses(hm3)1998–2004: source: own elaboration source: own elaboration
source: own elaboration
Initial capacity (hm3) total losses (hm3)
This makes a total loss of 166.8 hm
26). The most important factors are leakage and sedimentation, which has reduced capacity to a remarkable extent. These problems must be addressed as a priority.
Fig.24. Percentage water losses by sector 1988
Fig.25. Total water losses
Fig.26. Total water losses (%) 1988 32.15%
166.8
a total loss of 166.8 hm3, representing about 37% of total capacity (fig 24, 25 and 26). The most important factors are leakage and sedimentation, which has reduced capacity to a remarkable extent. These problems must be addressed as a priority.
Percentage water losses by sector 1988–2015: source: own elaboration
Total water losses (hm3)1988–2015: source: Own elaboration
Total water losses (%) 1988–2015: source: own elaboration
20%
0.11%
48%
Remaining volume (%) water leaks (%) Evaporated volume (%) Silting Volume (%)450
Initial capacity (hm3) total losses (hm3), representing about 37% of total capacity (fig 24, 25 and 26). The most important factors are leakage and sedimentation, which has reduced capacity to
source: own elaboration
source: Own elaboration
source: own elaboration
Remaining volume (%) water leaks (%) Evaporated volume (%) Silting Volume (%) Initial capacity (hm3) total losses (hm3)
5. CONCLUSION
Leakage, sedimentation and evaporation are the three phenomena that have reduced the capacity of the Gargar dam; moreover, these problems threaten the dam’s stability. Our work examines the sources of these losses. We conclude that correlations between hydraulic parameters confirm the presence of leaks in both banks downstream of the dam, exacerbated by the presence of cracks. These leaks can be clearly seen. Flow rates increase linearly with the level of the reservoir. High correlation coefficients (0.80 and 0.90) for the hydrological years 2004–2005 and 2005–2006 confirm this finding. Leaks are especially worrying as flow rate continues to increase due to the deterioration of certain impermeable zones caused, in turn, by hydraulic erosion or chemical corrosion. Our study established that the origin of these leaks is a lack of impermeability at the point where the reservoir meets the ground water. Therefore, the proposed solution consists of improving the impermeability of both banks with a curtain injection. These leakages are also due to the presence of a strong hydraulic gradient. However, the increase of this rate in time and for the same water level of the lake indicates deterioration of the rock mass forming the support of the dam. The rate of leakages was almost on the increase in time and especially when the water level in the reservoir is above the coast 98 m. This could be explained by the fact that the increased hydrostatic pressure resulted in a deterioration of the bedrock by the appearance of large cracks. It’s due to the degraded state of the geological layers. Water leaks at the level of this dam are more complex, so more studies are necessary to solve this problem. In addition to the considerable losses caused by leakage (estimated to an average 0.5 hm3 /year), losses due to sedimentation and evaporation (respectively 21.6 hm3 and 144.7 hm3 for 2015) account for a total of 166.8 hm3—representing 37% of total capacity It is therefore necessary to address the loss of storage capacity in order to avoid environmental damage and ensure that the project remains financially viable.
6. REFERENCES
[1] ANDT (Algerian National Agency for Dams and Transfers). Detection of water leaks in the restraints of dams. Algiers, ANDT Monograph, 2010: 20-35.
[2] ANDT (Algerian National Agency for Dams and Transfers). 1988–2015a. Annual balance sheet of exploitation of the Dams. Algiers, ANDT Monograph, 1988–2015a: 10–25.
[3] ANDT (Algerian National Agency for Dams and Transfers). Data of the leak-flows of water on the level of the Gargar Dam. Algiers, ANDT Monograph, 1988–2015b: 110–128.
[4] Benfetta H. Impact of water leaks on the total losses of Ouizert dam. International Symposium of Balwois. Montpellier, France, 2007.
[5] Benfetta H , Remini B Les fuites d’eau dans le barrage Algérien de Ouizert. Revue sècheresse internationale de France, 2008, 19 (3) :185-192, doi: 10.1684/sec.2008.0136 [6] Benfetta H, Remini B. The Gargar Reservoir Dam is it threatened by siltation? Larhyss Journal, ISSN 1112-3680, 2015, 24:175–192.
[7] Therond. R. Recherche sur l’étanchéité des lacs de barrage en pays karstique. Collection du centre de recherches et essais de chatou . Editions Eyrolles Paris, 1980.
[8] Coyne. B. 1994. Recherche des fuites sur le parement amont par la méthode des potentiels d’électrofiltration au barrage de LAC LONG. Rapport interne ANB Alger. 30 pages .
[9] Paul. R. Rupture de petits barrages. Recherche pour l’ingénierie de l’agriculture et de l’environnement. Cemagref France, 2002.
[10] Remini. B. Les pertes de capacité des Barrages: quelques exemples Algériens. Conférence internationale des limnologues d’expression Française. Montréal, Canada, 2003. [11] Remini. B, Avenard J. Envasement des Barrages. Alger, Editions CEDOC, 2003 : 5-15 [12] General of Studies and Large Hydraulic Works (SGSLHW). Monograph of Large Dams. Algiers, ANDT Monograph, 2011.
[13] Therond. R. Recherche sur l’étanchéité des lacs de barrage en pays karstique. Collection du centre de recherches et essais de chatou . Editions Eyrolles Paris, 1980.
[14] Toumi and Remini. B. Barrage de Foum el Gherza face au problème des fuites d’eau. Revue Larhyyss de Biskra, 2004: 3. 25-38.
[15] WS. Atkins. Preparatory project detailed, Gargar Dam. England International, 1982: 145–186.
How to cite this article:
Benfetta H, Ouadja A.The surface water storage problem in arid regions: a case study of the gargar dam, Algeria. J. Fundam. Appl. Sci., 2017, 9(3), 1598-1617.