Université de Montréal
Economic Evaluations of a Pharmacogenomics Test for
Statin-induced Myopathy in Secondary Cardiovascular
Prevention
par Dominic Mitchell
Département des Sciences biomédicales Médecine
Thèse présentée à la Faculté de Médecine en vue de l’obtention du grade de Philosophae Doctor (Ph.D.)
en Sciences Biomédicales Option générale
Mars 2018
Résumé
Les statines constituent la pierre angulaire du traitement des dyslipidémies. Les myopathies secondaires aux statines seraient l’une des principales causes d’abandon. Le diagnostic de myopathie repose sur la comparaison du taux de créatine kinase (CK) avec des valeurs de référence normales. Or, des études ont révélé que ces valeurs ne sont pas représentatives de l’ensemble de la population. Le test du taux de CK n’a donc qu’une utilité diagnostique restreinte. Un test pharmacogénomique (PGx) pour le diagnostic des myopathies chez les patients qui affichent une hausse légère ou modérée du taux de CK après l’amorce d’un traitement par une statine est en développement.
Nous avons évalué l’impact économique de ce test PGx hypothétique grâce à deux techniques de modélisation : un modèle de Markov et un modèle de simulation par événement discret (SED). Nous avons examiné les modèles avec la perspective d’un payeur canadien, avec un horizon temporel de la vie entière, pour les patients à risque cardiovasculaire (CV) élevé initiant une statine en prévention secondaire.
La détermination des taux de faux positifs (TFP) et de faux négatifs (TFN) du test revêt encore plus d’importance que le choix de la technique de modélisation. Dans cette thèse, nous avons opté pour une interprétation globale des résultats des tests, afin que les décisions des médecins et des patients s’apparentent à des erreurs de test. Cette définition permet de mesurer l’utilité clinique du test à influencer les décisions de prescription des médecins et, surtout, la volonté des patients de poursuivre le traitement. Ce dernier aspect s’applique particulièrement aux médicaments prescrits à titre préventif dont les bienfaits à long terme dépendent de l’adhésion du patient au traitement.
Les articles I et II présentent les résultats des modèles de Markov et SED. Les résultats concordent sur le plan qualitatif. Au Canada, un test PGx pour le dépistage des myopathies secondaires aux statines serait rentable avec une faible disposition à payer. Selon les analyses de sensibilité probabilistes, les modèles de Markov et SED donnaient des résultats favorables dans au moins 90 % des simulations assorties d’une disposition à payer de seulement 6150 $ et 12000 $ par année de vie pondérée par la qualité.
L’article III poursuit la réflexion des modèles présentés dans les articles I et II. Ceux-ci ont permis de constater qu’un test PGx complètement erroné (TFP = TFN = 100 %) se traduirait par un avantage différentiel monétaire net positif pour les payeurs. Ce résultat s’explique par le déséquilibre du risque entre les bienfaits d’une réduction des manifestations CV chez les patients atteints d’une myopathie légère ou modérée et le risque extrêmement faible de rhabdomyolyse. Cependant, ce résultat n’est pas plausible lorsque qu’on prend en considération les décisions à long terme des médecins et des patients, notamment le haut niveau de non-adhésion aux statines. Dans l’ensemble, cette thèse souligne l’importance d’évaluer l’impact économique des erreurs de test. Cette démarche ne doit pas se limiter à une supposition a priori des paramètres de rendement du test. Il convient d’examiner la fourchette complète des TFP et des TFN pour bien cerner l’incidence économique des tests diagnostiques, surtout lorsque le résultat du test influence la prescription d’un médicament préventif administré à long terme.
Mots-clés : pharmacoéconomie, test pharmacogénomique, Markov, simulation par événement discret, prévention cardiovasculaire secondaire, dyslipidémie, statines, myopathie
Abstract
Statins are the mainstay of treatment for dyslipidemia. Statin-induced myopathies are thought to be a major cause of patients discontinuing statin treatment. Myopathy diagnoses are based on creatine kinase (CK) elevation, which is compared to age-gender specific CK upper limit of normal values. Studies have shown, however, reference CK values are not representative of all population subgroups. Thus, CK tests have limited diagnostic capacity due to poor internal validity and limited external validity. A pharmacogenomics (PGx) test for statin-induced myopathies is in development for patients who have initiated statin therapy and who have mild to moderate CK elevation.
We conducted economic evaluations of this hypothetical PGx test using two modelling techniques: a Markov health state model and a discrete event simulation (DES) model. We evaluated the economic models with a lifetime horizon from the Canadian payer perspective for high cardiovascular (CV) risk patients initiating a statin in secondary prevention.
We found that even more important than the choice of modelling technique when evaluating the economic value of diagnostic tools, was the assessment of the diagnostic test false-positive and false-negative results. In this thesis, we have proposed an approach for interpreting diagnostic test results broadly such that physician and patient behaviours are akin to test errors. This definition addresses the clinical utility of the test in influencing physician prescribing recommendations and, importantly, patient decisions to adhere to therapy. This point is especially true for preventive medications, such as statins where the long-term benefits of therapy depend on patient adherence.
Articles I and II present the model results from the Markov health state model and the DES model. We found that, although the Markov and DES model results differed slightly, the qualitative model results were in agreement. A PGx test for statin-induced myopathy was cost-effective at a relatively low willingness-to-pay (WTP). In the probabilistic sensitivity analyses, the Markov and DES strategies were favoured in at least 90% of the model simulations with a payer WTP as low as $6,150 and $12,000 per quality-adjusted life year, respectively.
Article III was a reflection on the implications of model results presented in Articles I and II. Articles I and II highlighted that a totally inaccurate PGx test (i.e., false-positive rate [FPR] = false-negative rate [FNR] = 100%) would yield a positive incremental net monetary benefit for the payers. This result is explained by the risk imbalance between the benefit in reduction of CV events for patients suffering from mild to moderate myopathy compared to the extremely low risk of rhabdomyolysis. Although the totally inaccurate test result helped us understand the consequences of test errors, we recognize that a PGx test that is completely inaccurate, is not a plausible solution. The PGx test must be clinically valid and account for long-term physician and patient behavioural responses to the test results. As we have argued, the economic value of the PGx test for statin-induced myopathy in high CV risk patients depends on its ability to influence lifetime adherence to statin therapy.
Overall, this thesis highlights the importance of assessing the economic consequences of test errors. The assessment of test errors should not be limited to an a priori supposition of test performance parameters. The complete range of FPR and FNR test values should be investigated to fully understand the economic consequences of diagnostic tests. This is even more important when the diagnostic test is used to prescribe a long-term preventive medication.
Keywords: pharmacoeconomics, pharmacogenomics test, Markov, discrete event simulation, secondary cardiovascular prevention, dyslipidemia, statins, myopathy
Table of Contents
Résumé ... ii
Abstract ... iv
List of Tables ... xii
List of Figures ... xiii
Abbreviations ... xv Remerciements ... xviii Chapter 1. Introduction ... 1 1.1 Burden of Dyslipidemia ... 1 1.2 Statin Therapy ... 2 1.2.1 Statins ... 2 1.2.2 Mechanism of Action ... 3 1.2.3 Benefits of Treatment ... 3
1.2.4 Canadian Cardiovascular Society Statin Therapy Recommendations ... 5
1.2.4.1 Statin-Indicated Conditions ... 5
1.2.4.2 Primary Prevention Conditions ... 6
1.2.4.3 No Pharmacotherapy ... 7
1.2.5 Statin Non-Adherence ... 7
1.3 Statin-Induced Myopathy ... 8
1.3.1 Canadian Consensus Working Group Guidelines ... 11
1.3.2 Diagnosis of Myopathy ... 14
1.3.3 Risk Factors ... 14
1.3.4 Need for a New Diagnostic Test ... 15
1.4 Pharmacogenomics Testing for Statin-Induced Myopathy ... 15
1.5 Economic Evaluations of Diagnostic Tests ... 16
Chapter 2. Thesis Objective ... 19
2.1 Article I Objective ... 19
2.2 Article II Objective ... 19
2.3 Article III Objectives ... 19
3.1 Sensitivity and Specificity ... 20
3.2 The Perfect Clinical Environment... 22
3.3 The Environment Without the Pharmacogenomics Test ... 22
3.4 Digitization of Published Graphics ... 23
3.4.1 Processing Images ... 24
3.4.2 Converting the Images to Numerical Values ... 25
Chapter 4. Article I ... 27
4.1 Methodology ... 27
Article I ... 29
Statement of Authorship ... 30
Abstract ... 32
Key Points for Decision Makers ... 33
1 Introduction ... 34
2 Method ... 35
2.1 Economic Evaluation ... 35
2.1.1 PGx Test ... 35
2.1.2 Model Structure ... 37
2.1.3 Transition Probabilities, Hazard Ratio, Relative Risk and Rates ... 38
2.1.4 Costs ... 39
2.1.5 Health Utilities ... 39
2.2 Base Case Analysis ... 39
2.3 Sensitivity Analysis ... 40
2.4 Scenario Analysis ... 40
3 Results ... 40
3.1 Base Case Analysis ... 40
3.2 Sensitivity Analyses ... 41
3.3 Scenario Analyses... 41
4 Discussion ... 42
4.1 PGx False Negative and False Positive ... 43
4.2 Strength ... 44
5 Conclusion ... 45 6 References ... 46 7 Figures ... 50 8 Tables ... 54 Chapter 5. Article II ... 59 5.1 Methodology ... 59 5.1.1 Introduction ... 59 5.1.2 Methodology ... 59
5.1.3 Functional Form Selected ... 60
5.1.4 Mortality ... 61
5.1.4.1 Acute Myocardial Infarction All-Cause Mortality ... 63
5.1.4.1.1 All-Cause Mortality After a First AMI ... 63
5.1.4.1.2 All-Cause Mortality After AMI Recurrence ... 65
5.1.4.2 Stroke All-Cause Mortality ... 68
5.1.4.2.1 All-Cause Mortality After a First Stroke ... 68
5.1.4.2.2 All-Cause Mortality After Stroke Recurrence ... 70
5.1.5 Cardiovascular Events ... 72
5.1.5.1 AMI Recurrence ... 72
5.1.5.2 Stroke Post-AMI ... 74
5.1.5.3 Stroke Recurrence ... 76
5.1.5.4 AMI Post-Stroke ... 77
5.1.6 Time to Musculoskeletal Pain ... 78
5.1.7 Time-to-Event and Statin Efficacy ... 79
5.1.7.1 Patients Treated with a Statin ... 79
5.1.8 Patients Interrupting Statin Therapy ... 79
Article II ... 82
Statement of Authorship ... 83
Acknowledgments ... 85
Abstract ... 86
Key Points for Decision Makers ... 87
2 Method ... 90 2.1 Economic Evaluation ... 90 2.1.1 Model Assumptions ... 90 2.1.2 Model Structure ... 91 2.1.3 Model CV Events ... 92 2.1.4 Model Mortality ... 92 2.1.5 Statin Efficacy ... 92 2.1.6 Statin Interruption ... 93 2.1.7 Costs ... 93 2.1.8 Health Utilities ... 94
2.2 Base Case Analysis ... 94
2.3 Sensitivity Analyses ... 94
2.4 Scenario Analyses... 95
3 Results ... 95
3.1 Base Case Analysis ... 95
3.2 Sensitivity Analyses ... 96
3.3 Scenario Analyses... 96
4 Discussion ... 97
4.1 Consequences of False Negative and False Positive PGx Test Results ... 97
4.2 Strength ... 98 4.3 Limitations ... 99 5 Conclusion ... 100 6 References ... 101 7 Figures ... 107 8 Tables ... 111
Chapter 6. Article III ... 116
Article III ... 117
Statement of Authorship ... 118
Acknowledgments ... 120
Abstract ... 121
1 Introduction ... 123
2 Cross-Validation ... 124
2.1 Markov and DES Models ... 124
2.1.1 Model Intervention and Comparator ... 125
2.1.2 Test Parameters ... 125
2.2 Key Model Differences ... 126
2.2.1 Differences related to DES survival curves ... 126
2.2.1.1 Starting Age ... 126
2.2.1.2 Statin Interruption ... 126
2.2.1.3 Third CVE ... 127
2.3 Models Results Comparison ... 127
3 Economic Value of a PGx Test for Statin-Induced Myopathy ... 128
3.1 Importance of Assessing Consequences of Test Errors... 128
3.2 Role of PGx-Guided Statin Therapy ... 131
3.3 Changes in Treatment Options ... 133
4 Strengths and Limitations ... 133
5 Conclusion ... 134 6 References ... 136 7 Figures ... 144 8 Tables ... 148 Chapter 7. Discussion ... 152 7.1 Article I ... 152
7.2 Article I and Article II Modelling Comparison ... 153
7.2.1 Dominance of Markov Models in the Literature ... 153
7.2.2 Published Comparisons of Markov and Discrete Event Simulation Models ... 154
7.2.3 Key Model Differences Between the Markov and Discrete Event Simulation Models ... 155
7.2.3.1 Transition Probabilities Versus Time-to-Event ... 156
7.2.3.2 Statin Interruption ... 157
7.2.4 Impact of the Change in Discount Rate and Usage of Incremental Net
Monetary Benefit ... 157
7.2.5 Comparing the Model Results ... 163
7.2.5.1 Selection of an Economic Model ... 164
7.3 Article III ... 165
7.3.1 Importance of Assessing Test Performance Parameters... 165
7.3.2 The Role of PGx-Guided Statin Therapy ... 166
7.3.3 The Economic Value of a PGx Test for Statin-Induced Myopathy ... 167
7.3.3.1 Economic Evaluation Framework ... 167
7.3.3.2 The Importance of Cardiovascular and Myopathy Risk Imbalances ... 168
7.3.3.3 Interpretation of the Complete Test Matrix Results ... 169
7.3.3.3.1 There is no Such Thing as a Totally Inaccurate Diagnostic Test ... 169
7.3.3.3.2 The Test Decision Implies Lifetime Adherence to Statin ... 169
7.3.3.3.3 A Test for Statin-Induced Myopathy Can Only Have Value if it Increases Lifetime Statin Adherence ... 170
7.4 The Cost-Effectiveness Threshold ... 176
7.4.1 Historical Perspective ... 176
7.4.2 Other Factors Influencing the Decision Rule ... 178
7.4.3 Thresholds Used in Articles I-III ... 179
7.5 Thesis Strengths and Limitations ... 179
7.5.1 Thesis Strengths ... 179
7.5.2 Thesis Limitations ... 181
Chapter 8. Conclusion ... 183
List of Tables
Table 1 List of statins available on the RAMQ listing by potency ... 2
Table 2 Integrated CCWG terminology for myopathic syndromes ... 10
Table 3 Weibull parameter estimates for all-cause mortality after a first AMI ... 64
Table 4 Weibull parameter estimates for all-cause mortality after an AMI recurrence ... 66
Table 5 Weibull parameter estimates for all-cause mortality after a first stroke ... 69
Table 6 Weibull parameter estimates for all-cause mortality in patients with first and recurrent strokes ... 71
Table 7 Log-logistic parameter estimates for the long-term risk of AMI recurrence by gender and age group ... 72
Table 8 Weibull parameter estimates of long-term risk of stroke post-AMI ... 75
Table 9 Log-logistic parameter estimates of the long-term risk of stroke recurrence ... 76
Table 10 Log-logistic parameter estimates of the long-term risk of AMI post-stroke ... 77
Table 11 Weibull parameter estimates of the long-term risk of MSP ... 78
Table 12 Differences between the Markov and DES approaches... 156
Table 13 Example of ICUR in the northeast and southwest quadrant assuming a payer’s WTP of $50,000 per QALY ... 159
List of Figures
Figure 1 Management approach for muscle symptoms or hyperCKemia. ... 13
Figure 2 Test sensitivity and specificity parameters ... 21
Figure 3 Example of image processing with GIMP ... 24
Figure 4 Example of the digitization of the survival curve for AMI recurrence in women 85 years of age and older. ... 25
Figure 5 Enlarged screen capture of a digitized curve. ... 26
Figure 6 Canadian population annual death probability by age ... 28
Figure 7 Annual death probabilities in the Canadian population by age ... 62
Figure 8 Actual vs. predicted survival after a first AMI in men by age group ... 65
Figure 9 Actual vs. predicted survival after a first AMI in women by age group ... 65
Figure 10 Actual vs. predicted survival after an AMI recurrence in men by age group ... 67
Figure 11 Actual vs. predicted survival after an AMI recurrence in women by age group ... 68
Figure 12 Actual versus predicted survival after a first stroke ... 69
Figure 13 Actual vs. predicted survival after first and recurrent stroke ... 71
Figure 14 Actual versus predicted cumulative incidence of AMI recurrence in men by age group ... 73
Figure 15 Actual versus predicted cumulative incidence of AMI recurrence in women by age group... 74
Figure 16 Actual versus predicted cumulative incidence of stroke post-AMI ... 75
Figure 17 Actual versus predicted cumulative incidence of stroke recurrence... 76
Figure 18 Actual versus predicted cumulative incidence of AMI post-stroke ... 77
Figure 19 Assumed survival curve for musculoskeletal pain ... 79
Figure 20 Illustration of the random allocation death time ... 81
Figure 21 Number of Markov- and DES-related publications since 1985. ... 154
Figure 22 The cost-effectiveness plane ... 160
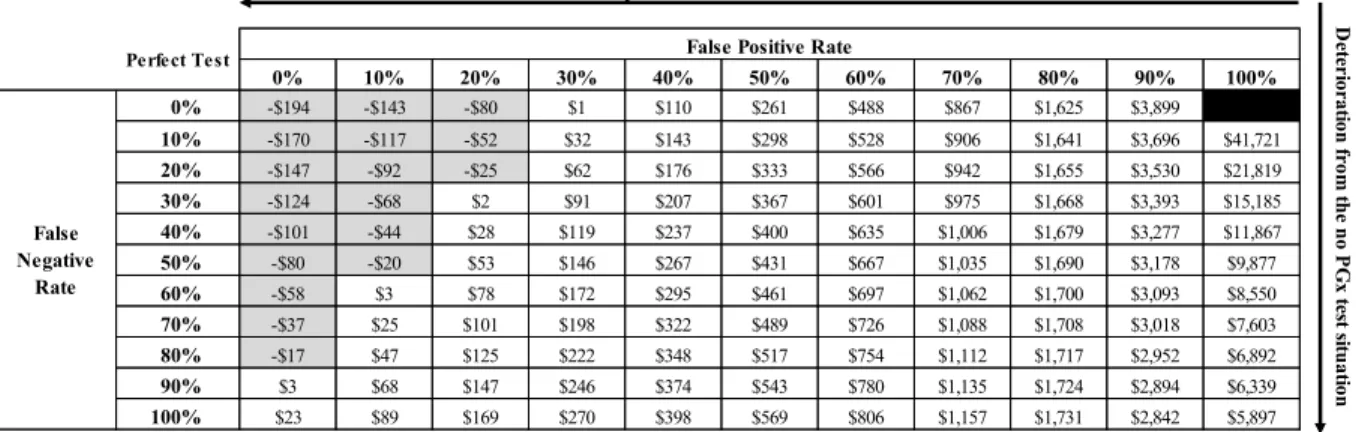
Figure 23 Matrices of the INMB results for the Markov model test performance scenario analysis assuming a payer’s WTP per QALY of $10,000 ... 162
Figure 24 Matrices of the INMB results for a Markov model test performance scenario analysis assuming a payer’s WTP per QALY of $50,000 ... 163
Figure 25 PGx test two-by-two table: sensitivity and specificity ... 171 Figure 26 Matrices of the INMB results for the DES model test performance scenario
analysis assuming a payer’s WTP per QALY of $50,000 ... 172 Figure 27 Two-by-two table for the test classification assuming 100% statin adherence ... 173 Figure 28 Two-by-two table for the test classification assuming 100% statin
non-adherence ... 173 Figure 29 Two-by-two table for the test classification with partial statin adherence ... 174
Abbreviations
4S Scandinavian Simvastatin Survival Study
ACC American College of Cardiology
AF Atrial fibrillation
AHA American Heart Association
AIC Akaike information criterion
AICc Akaike information criterion correction
AMI Acute myocardial infarction
BIC Bayesian information criterion
BMI Body Mass Index
CADTH Canadian Agency for Drugs and Technologies in Health
CCS Canadian Cardiovascular Society
CCWG Canadian Consensus Working Group
CDR Challenge-dechallenge-rechallenge CEAC Cost-effectiveness acceptability curve CHMS Canadian Health Measures Survey
CI Confidence interval
CK Creatine kinase
CSV Comma-separated value
CTT Cholesterol Treatment Trialists
CV Cardiovascular
CVD Cardiovascular disease
CVE Cardiovascular event
DES Discrete event simulation
DSA Deterministic sensitivity analysis
FDA Food and Drug Administration
FPR False-positive rate
FNR False-negative rate
GIMP GNU Image Manipulation Program HDL-C High-density lipoprotein cholesterol
HR Hazard ratio
HTA Health Technology Agency
ICER Incremental cost-effectiveness ratio ICUR Incremental cost-utility ratio
INESSS Institut national d’excellence en santé et services sociaux
IPD Individual patient data
ISPOR International Society for Pharmacoeconomics and Outcomes Research
LDL Low-density lipoprotein
LDL-C Low-density lipoprotein cholesterol
MRR Mortality rate ratio
MSP Musculoskeletal pain
NHANES National Health and Nutrition Examination Survey NHLBI National Heart, Lung and Blood Institute
NLA National Lipid Association
NNT Number needed to treat
OR Odds ratio
PCSK9 Proprotein convertase subtilisin/kexin type 9
PGx Pharmacogenomics
PSA Probabilistic sensitivity analysis QALY Quality-adjusted life year
RAMQ Régie de l’assurance maladie du Québec
RR Relative risk
ULN Upper limit of normal
UK United Kingdom
US United States
VBA Visual basic for application
Remerciements
La réalisation d’un projet de doctorat ne serait pas possible sans l’appui de son entourage. Je suis redevable à plusieurs personnes de leur soutien inébranlable au fil de ce parcours de longue haleine.
J’aimerais tout d’abord remercier Marie-Claude, qui partage ma vie depuis le début de mes études universitaires, il y a maintenant plus de 28 ans. Je n’aurais pas achevé ce doctorat sans son accord. Les sacrifices, elle les a faits autant, sinon plus, que moi.
À mes garçons – Hugo, Félix et Thierry –, je dirais simplement que le succès est un marathon, et non un sprint. Il n’y a pas de recette miracle. J’espère que l’obtention de mon doctorat saura vous inspirer à faire les bons choix.
Je tiens aussi à remercier mes parents, Gilles et Yolande, qui m’ont appuyé tout au long de ma vie. Ils demeurent à ce jour un modèle pour moi. Je suis très heureux qu’ils puissent assister à cet événement.
À l’équipe du centre de recherche – Dre Madeleine Durant, Dr Alexis Matteau, Dr Brian Potter et Dr Louis-Mathieu Stevens – merci de votre soutien, ainsi que des précieux commentaires et suggestions que vous m’avez fournis en cours de route.
Je suis également des plus reconnaissants à Jason Guertin de son appui et de son dévouement soutenu. Jason m’a assisté dans la préparation de l’examen de synthèse, et a été présent à toutes les étapes de mon parcours – d’abord comme collègue au doctorat, et maintenant en tant que codirecteur de thèse.
Enfin, je tiens à témoigner toute ma gratitude au Dr Jacques LeLorier. D’abord pour avoir accepté ma candidature au doctorat, puis pour m’avoir proposé ce projet de doctorat. Le Dr LeLorier s’est toujours montré disponible à mon égard, que ce soit pour discuter de projets de recherche ou pour réviser mes travaux. Je suis extrêmement privilégié d’achever mon doctorat sous sa supervision.
Chapter 1.
Introduction
1.1
Burden of Dyslipidemia
Dyslipidemia is defined as an elevation of plasma cholesterol, triglycerides, or low- and high-density lipoprotein cholesterol (LDL-C and HDL-C). It is an important cardiovascular (CV) risk factor contributing to the development of atherosclerosis [1]. Millions of Canadians have dyslipidemia. According to the 2012 to 2013 Canadian Health Measures Survey (CHMS) and the 2012 Canadian population estimate, approximately 13.3 million individuals have elevated cholesterol levels (i.e., dyslipidemiai) [2]. The economic burden of dyslipidemia is
substantial. In 2013, the direct drug costs associated with cholesterol-lowering drugs in Canada was estimated at $1.6 billion annually, with 85% of direct costs accounted for by provincial drug programs [3].
Millions of Canadians are prescribed statins to manage their dyslipidemia to reduce their risk of cardiovascular disease (CVD) [4]. Using the CHMS survey data, Hennessy et al. (2016) estimated that 2.8 million Canadian adults are currently prescribed a statin to reduce their cholesterol level; of these, 2.1 million are considered at high CV risk [4]. Estimates from the Canadian Cardiovascular Society (CCS) Guidelines (2012) [5], showed that 6.5 million Canadians (4.7 million considered at high CV risk) should be prescribed a statin. Assuming perfect adherence to therapy, Hennessy et al. (2016) further estimated that, among high CV risk patients currently treated and those recommended for treatment, close to 14,600 and 29,000 annual CV events (CVEs)ii, respectively, could be potentially avoided with statin therapy [4].
i In the CHMS, dyslipidemia was defined as having unhealthy blood concentrations of LDL-C (≥3.5mmol/L),
or a total cholesterol to high-density cholesterol ratio ≥5.0, or self-reported use of a lipid-modifying medication.
ii The numbers presented above differ from those in Hennessy et al. (2016). The authors made an error in
calculating the number needed to treat by multiplying a risk with a relative risk. To perform the risk adjustment, the authors should have used standard formulas to transform the CV risk into a rate that can then be adjusted by multiplying with the relative risk. The adjusted risk is obtained by converting back into a probability [6].
1.2
Statin Therapy
1.2.1
Statins
Statins, inhibitors of 3-hydroxy-3-methyl-glutaryl coenzyme A (HMG-CoA) reductase, are the mainstay treatment for dyslipidemia [7-9]. Lovastatin was the first commercial statin approved by the United States (US) Food and Drug Administration (FDA) in 1987 [10, 11]. Six other statins followed: simvastatin was initially approved for marketing in Sweden in 1988 and subsequently worldwide, pravastatin followed in 1991, fluvastatin in 1994, atorvastatin in 1997, cerivastatin in 1998, and rosuvastatin in 2003 [12]. However, in 2001, after statins were perceived as a safe drug class, the newly introduced cerivastatin was withdrawn from the market by its manufacturer following a large number of reports of rhabdomyolysis, of which more than 50 cases were fatal [12-15]. In 2002, the Heart Protection Study, the largest placebo-controlled 5-year statin trial, confirmed the safety of simvastatin in 20,536 high CV risk individuals in the United Kingdom (UK).
Several statin molecules are available. These can be classified based on their potency to lower LDL-C. Table 1 shows an adapted list of statin molecules/dosages reimbursed by the Régie de l’assurance maladie du Québec (RAMQ) [9, 16-18].
Table 1 List of statins available on the RAMQ listing by potency
Potency Statin molecule Dosage (mg) Low intensity (↓ LDL-C <30%) Fluvastatin Lovastatin Pravastatin Simvastatin 20, 40 20 10, 20 5, 10 Medium intensity (↓ LDL-C 30% to 50%) Atorvastatin Fluvastatin Lovastatin Pravastatin Rosuvastatin Simvastatin 10, 20 40 (BID), 80 (QD) 40, 80 40, 80 5, 10 20, 40, 80 High intensity (↓ LDL-C ≥50%) Atorvastatin Rosuvastatin 40, 80 20, 40
BID two times per day, LDL-C low-density lipoprotein-cholesterol, mg milligram, QD once per day, RAMQ Régie de l’assurance maladie du Québec.
1.2.2
Mechanism of Action
Statins are selective, competitive inhibitors of a HMG-CoA reductase, the rate-limiting enzyme that converts 3-hydroxy-3-methyl-glutaryl coenzyme A into mevalonic acid, a precursor of sterols, including cholesterol [19-21]. As a result, the expression of low-density lipoprotein (LDL)-receptors, followed by the uptake of LDL from blood to liver, is accelerated and the plasma total cholesterol decreases [22]. Statins reduce LDL-C non-linearly, in a dose-dependent manner, after administration of a single daily dose [21, 23].
1.2.3
Benefits of Treatment
As recognized by the CCS, statins reduce the relative risk of CVD in individuals by 25% to 35%, with better prevention of vascular events achieved with higher doses [5]. As statins are preventive medications, the cardio-protective benefits are observed after the first year of follow-up in clinical trials [24, 25]. To help answer statin-related efficacy and safety questions, the Cholesterol Treatment Trialists (CTT) Collaboration has carried out a series of meta-analyses. The CTT Collaboration was established in 1994 after it was recognized that not a single lipid trial would have sufficient numbers of patients to reliably establish mortality or to investigate events in specific populations [26]. To date, they have investigated statin-related questions on cancer, major vascular events, and mortality from nearly 30 major statin trials combining approximately 175,000 trial participants [26]. The meta-analyses conducted by the CTT have been used to inform national clinical guidelines [7, 8].
In 2005, the CTT Collaborators conducted a meta-analysis to establish the efficacy and safety of statins from 14 randomized clinical trials with 90,956 participants [27]. Their results indicated a 12% proportional reduction in all-cause mortality per mmol/L reduction in LDL-C (rate ratio=0.88, 95% confidence interval [CI] 0.84–0.91; p<0.0001). This difference was driven by the 19% reduction in coronary mortality (rate ratio=0.81, 95% CI 0.76–0.85; p<0·0001), with non-significant reductions in non-coronary vascular and non-vascular mortality [27]. The combined major vascular event reduction was 21% (rate ratio=0.79, 95% CI 0.77–0.81; p<0.001). These benefits were significant in the first year, but they were greater in subsequent years. In addition, the results indicated that the hazards of lowering LDL-C with statins appeared
extremely small compared to the benefits. The meta-analysis showed an extremely low incidence risk of rhabdomyolysis (5-year excess=0.01%; standard error=0.01) [27].
In 2010, the CTT Collaboration published another meta-analysis assessing the efficacy and safety of more intensive regimens to lower LDL-C [28]. The meta-analysis combined data from 26 randomized trials with 129,526 individuals and a median follow-up of 4.8 years. The results indicated that, compared with less intensive statin regimens, higher dose regimens significantly reduced major CVD events by a further 15% [28]. Across the 26 trials, all-cause mortality was reduced by 10% per 1.0 mmol/L LDL-C reduction (rate ratio=0.90, 95% CI 0.87–0.98; p<0.0001), reflecting largely the reduction in death due to coronary heart disease and other cardiac causes [28].
The benefits and safety of statins in patients at high vascular risk is well established and recognized in the CCS Guidelines [7]. The 2012 CTT meta-analysis looked at the impact of statins on lowering LDL-C in patients at low risk of vascular disease in 174,149 patients from 27 randomized clinical trials [29]. They concluded that in individuals with a 5-year risk of major vascular events below 10%, each 1 mmol/L reduction in LDL-C generated an absolute reduction in major vascular events of approximately 11 per 1,000 over 5 years, a reduction which greatly outweighs any known hazards of statin therapy [29]. Similar findings were observed in a Cochrane review of statins for the primary prevention of CVDiii based on 18 randomized trials
including 56,934 patients [31]. In 2013, the American College of Cardiology/American Heart Association (ACC/AHA) revised the US Cholesterol Treatment Guidelines; their revisions included lowering the risk threshold for treating primary prevention patients [32, 33]. Compared to the CCS Guidelines (2012), the US Cholesterol Treatment Guidelines (2013) recommend initiating a statin in primary prevention when the 10-year risk of atherosclerotic CVD exceeds 7.5%, whereas the CCS threshold was 20% [5, 7, 32, 33].
iii Primary prevention refers to health strategies delaying or preventing the onset of CVD. Secondary prevention
refers to health strategies applied after the onset of CVD (in early stages of the disease) and include interventions to prevent disease progression and complications [30].
1.2.4
Canadian Cardiovascular Society Statin Therapy
Recommendations
The most recent CCS Guidelines (2016) for dyslipidemia provide guidance on the population, risk assessment, management of dyslipidemia, and prevention of CVD [7, 34]. The guidelines recommend screening men ≥40 years, women ≥40 years (or postmenopausal), and all patients presenting with CV risk factors regardless of ageiv[7, 34]. The two key messages
from the CCS Guidelines are:
LDL-C levels are directly linked to the development of atherosclerosis and its reduction is directly linked to the reduction in CVEs
Health behaviour modification remains a cornerstone of risk reduction The CCS Guidelines stratify patient management into three risk categories:
Statin-indicated conditions Primary prevention conditions No pharmacotherapy
1.2.4.1 Statin-Indicated Conditions
The CCS Guidelines recommend initiating a statin in patients with an established CV risk (i.e., secondary prevention) [7]. For example, in patients with:
Clinical atherosclerosis Abdominal aortic aneurysm
iv The list of risk factors includes: clinical evidence of atherosclerosis, abdominal aortic aneurysm, diabetes
mellitus, arterial hypertension, current cigarette smoking, stigmata of dyslipidemia (arcus cornealis xanthelasma or xanthoma), family history of CVD (men <55 and women <65 years in first degree relative), chronic kidney disease (estimated glomerular filtration rate <60 ml/min/1.73m2 or albumin:creatinine ratio >3
mg/mmol for at least 3 months duration), obesity, inflammatory disease, HIV infection, erectile dysfunction, chronic obstructive pulmonary disease, and hypertensive disease of pregnancy.
Diabetes
o Age ≥40 years
o Age ≥30 years and disease duration ≥15 years (type 1 diabetes mellitus) o Microvascular disease
Chronic kidney disease
Genetic dyslipidemia with LDL-C ≥5 mmol/L
The CCS Guidelines recommend initiating statin therapy in target patient groups when the benefits of treating with a statin (as measured by the number needed to treatv [NNT] to avoid
one CVD event for 5 years of treatment per 1 mmol/L reduction in LDL-C) fall below the threshold considered acceptable by physicians; generally an NNT <50 is considered acceptable [7, 36]. The CCS Guidelines recommend pharmacotherapy in patient groups where the NNT falls below 40. For statin-indicated conditions where statins are indicated as initial therapy, the threshold NNT value is 20.
1.2.4.2 Primary Prevention Conditions
In primary prevention, the CCS Guidelines use the 10-year CV risk score from the Framingham Risk Score (FRS) to inform their recommendations [37]. The CCS Guidelines recommend initiating a statin therapy for patients with a FRS score above 20% (high CV risk patients, NNT=35) or a FRS score 10% to 19% (NNT=40) combined with other criteria:
LDL-C ≥3.5 mmol/L; or Non-HDL-C ≥4.3 mmol/L; or
v The NNT is a measure of the efficacy of health interventions. The NNT indicates the number of patients needed
to treat to avoid one health event. An NNT equal to one indicates that one health intervention would avoid one health event. From a public perspective, lower NNT values are desirable. NNT measures are time-specific [35].
Apolipoprotein B ≥1.2g/L; or
Men ≥50 and women ≥60 years of age and one additional CVD risk factor 1.2.4.3 No Pharmacotherapy
The CCS Guidelines do not recommend treating patients in primary prevention when the estimated 10-year FRS is less than 10% [7]. Note that the US Cholesterol Clinical Practice Guidelines have a lower FRS threshold for treating patients with a statin: their definition of the intermediate-risk category includes patients with an FRS above 7.5% to 20% [8, 32].
1.2.5
Statin Non-Adherence
Adherence to statin therapy is essential for patients to achieve the full benefits of treatment. DiMatteo et al. (2002) conducted a meta-analysis using 63 articles from different disease areas to assess the relationship between treatment adherence and clinical outcomes [38]. Their meta-analysis included seven studies in hypercholesterolemia. Three studies defined adherence as a dichotomous variable (e.g., 80% intake or greater vs. less) and four studies used a continuous definition (e.g., mean percentage daily dose taken). They found an odds ratio (OR) of 2.81 [95% CI 1.67–4.71] between non-adherent and adherent patients with hypercholesterolemia; that is, non-adherent patients were 2.81 times more likely to have a CVE than patients who adhered to therapy.
Adherence to therapy is a problem with statins. Many studies have highlighted the poor adherence and poor persistence to statin therapy. In a claims database study, Avorn et al. (1998) analyzed the persistence and adherence to lipid-lowering therapy in Canada and the US [39]. They found that, on average, patients remained without filled prescriptions for over one-third of the year and approximately 50% of the cohort from the US had discontinued treatment. Catalan et al. (2000) showed that, in a cohort of patients initiating a statin, only 33% still adhered to treatment after one year [40]. Guertin et al. (2016) reported that 18.7% and 58.0% of incident statin users had discontinued statin therapy at 30 days and at 1 year, respectively [41]. As shown by Nielsen and Nordestgaard (2016), early statin discontinuation (within 6 months of statin initiation) increased three-fold (6% to 18%) between 1995 and 2010 [42]. Their analyses indicated that early statin discontinuation increased with negative statin-related news stories.
Dorais et al. (2010) reported that, among 19,727 patients initiating a statin, 53.3% had discontinued treatment after 1 year [43]. Maningat et al. (2013) highlighted that statin adherence is lower than other preventive medications (aspirin: 71%; β-blockers: 46%; vs. statins: 44%) [44, 45]. Brown et al. (2017) conducted a chart review using the Manitoba Primary Care Research Network repository [46]. Their study showed that, among the secondary prevention CVD patients, less than 30% had received a repeat statin prescription from their primary care providers.
There are several reasons a patient may not adhere to statin therapy [44]. In clinical trials, the observed benefits of statin therapy only start to materialize after 1.5 years of treatment. For instance, in the large, double-blind, randomized controlled Scandinavian Simvastatin Survival Study (4S), the Kaplan-Meier curves for all-cause mortality for the placebo and simvastatin treatment groups start to diverge after 1.5 years [25]. Furthermore, as statin therapy is a preventive treatment, patients do not observe the benefit of statins in their daily lives. This may raise doubts in patients as to the necessity of treatment. Wouters et al. (2016) showed that among 229 patients, 40% to 70% doubted the need for therapy and lacked knowledge about statin efficacy, while 20% to 35% worried about joint and muscle side effects [47].
These data indicate that many patients do not fully understand the benefits of statin therapy and do not adequately adhere to treatment; thus, patients are potentially placing themselves at risk of having a CVE. A detailed description of which patients should remain on treatment may help improve adherence and treatment outcomes. Statin-induced myopathies are thought to be a major cause of statin discontinuation leading to many patients being untreated [48]. As such, there is a need for an accurate diagnostic test to convince patients to adhere to the treatment when the test indicates that the statin is not the cause of their muscle pain.
1.3
Statin-Induced Myopathy
Statins are generally well tolerated for most patients, and their widespread usage has had a major impact on reducing the global burden of CVD [49]. However, a proportion of patients may experience statin intolerance. Statin intolerance can be partial or complete. Partial statin intolerance may resolve with a switch to a different statin molecule and/or by reducing the statin dosage. Complete statin intolerance occurs when a patient cannot tolerate any statins at any
dosage [50]. The most common forms of statin intolerance are myopathies, which include muscle weakness, pain, inflammation, spasms, or paralysis [51]. Myopathies develop either as the result of inherited or acquired conditions of the muscle [52]. Statin-induced myopathies are in the category of acquired myopathy.
Myopathy is a broad term used to describe muscle toxicity, which can range from muscle ache to the extreme case of rhabdomyolysis. Myopathies are classified based on the level of creatine kinase (CK) in serum plasma, creatinine elevation (with brown urine or urinary myoglobin), and evidence of organ damage [53]. The serum CK test compares the level of CK in blood serum with the gender-/age-specific range of reference values (i.e., normal values) [54, 55]. Creatine kinase levels are a rough proxy for the severity of statin-induced myotoxicity, but the correlation between symptoms and CK levels remains incomplete. The clinical interpretation of CK levels is complex and there is yet no consensus on the definition of statin myopathy. Typically, myopathies are classified into three levels of severity: 1) myalgia, defined as muscle symptoms, such as ache or weakness, with normal CK levels; 2) myositis, defined as muscle symptoms with elevated CK levels; and 3) rhabdomyolysis, defined as muscle symptoms with CK elevation (typically >10x the upper limit of normal [ULN]) and creatinine elevation [52]. The ACC/AHA/National Heart, Lung and Blood Institute (NHLBI) [52], the FDA [56], National Lipid Association (NLA) [57], and the Canadian Consensus Working Group (CCWG) [58], have each proposed different definitions for statin-related muscle effects. These definitions are anchored on the CK ULN values. Hence, the importance of ULN reference values. Table 2 presents the definition of myopathy from the CCWG Guidelines (2016) for the management of statin adverse effects [58].
Table 2 Integrated CCWG terminology for myopathic syndromes
Characteristics
Term Laboratory Clinical
Myopathy NA General term referring to any disease of muscle Symptomatic myopathy
Myalgia CK ≤ ULN Muscle ache/weakness Myositis CK > ULN Muscle ache/weakness Rhabdomyolysis CK >10x ULN (CK
>10,000 U/L)
Muscle ache/weakness; renal dysfunction might result from myoglobinuria; need for hydration therapy
CCWG Canadian Consensus Working Group, CK creatine kinase, NA not applicable, ULN upper limit
of normal.
Modified from Mancini et al. (2016) [58] with permission from Elsevier.
Rhabdomyolysis, the most extreme form of myopathy, can lead to complications, such as renal damage and, in rare cases, death [59, 60]. The incidence of suspected statin-induced myopathy is 5% to 10% in randomized clinical studies [60, 61], and as high as 25% in some observational studies [53, 61, 62]. Radillis et al. (2012) argued that statin-related myopathies were systematically underestimated in randomized controlled trials [60]. Exclusion of patients with risk factors for myopathy, failure to systematically document myalgias, application of strict criteria to define myopathy (i.e., CK elevations >10 ULN), and the inclusion of a run-in phase excluding patients with muscle symptoms, are reasons why statin-induced intolerance may be under-reported in clinical trials [48, 60]. Identification and management of these patients is critical for them to fully achieve the benefits of chronic, generally life-long, lipid-lowering therapy [48]. Typically, statin myopathy symptoms are completely reversible and CK activity decreases within a few weeks after statin therapy discontinuation [50, 63, 64]. Serious muscle damage or rhabdomyolysis associated with statin treatment is extremely rare; for instance, occurring in 1 in 23 million individuals with prescriptions for atorvastatin [50]. In 2012-2013, atorvastatin was the leading cholesterol-lowering drug, representing 43% of the prescription volume, followed by rosuvastatin with 33.3% of the prescription volume [3]. Early treatment of rhabdomyolysis is key to a successful outcome and patients can expect full recovery with prompt treatment; however, if it is not treated early, it may cause lasting damage [65].
1.3.1
Canadian Consensus Working Group Guidelines
The CCWG established the Canadian Guidelines for diagnosis, prevention, and management of statin adverse effects and intolerance in 2011 with revision updates published in 2013 and 2016 [48, 58, 66]. The objective of these guidelines is to provide clinicians with an algorithm for managing patients in need of statin therapy who have drug intolerances (true or perceived) undermining compliance.
According to the guidelines, a diagnosis of statin intolerance should only be considered when a patient reports symptoms associated with the use of a statin, symptoms resolve when the statin is stopped, and the symptoms recur with the same or a different statin, regardless of abnormal laboratory findings [48].
There are several predisposing risk factors for adverse effects from statin-induced myopathy. The CCWG Guidelines (2016) present an exhaustive list under two categories: endogenous and exogenous factors [58]. Endogenous risk factors are non-modifiable patient characteristicsvi,
whereas exogenous risk factors are behavioural and treatment-relatedvii [58].
The CCWG Guidelines (2016) summarize the principles of the management of goal-inhibiting statin intolerance, which is described below [58]. First, the need for statin therapy as indicated by the CCS Guidelines [7] must be re-evaluated. Once the need has been established, then the practicing physician should assess the risk of statin-intolerance using the list of potential risk factorsvi,vii. The practicing physician should investigate whether a behavioural plan was set,
vi The list of endogenous factors includes: advanced age, female sex, low BMI, small body, frailty, history of
pre-existing/unexplained muscle/joint/tendon pain, history of CK elevation, family history of myopathy, family history of myopathy with statin therapy, neuromuscular diseases, severe renal disease, acute/decompensated hepatic disease, hypertension/heart failure (renal side effects mainly), hypothyroidism (untreated), diabetes mellitus, genetic polymorphisms (e.g., SLCO1B1 gene variants) [58].
vii The list of exogenous factors includes: high statin dose, alcohol abuse, illicit drug use (cocaine, amphetamines),
antipsychotics, fibrates (particularly gemfibrozil), nicotinic acid, amiodarone, verapamil, warfarin, cyclosporine, macrolide antibiotics, azole antifungals, protease inhibitors, nefazodone, large quantities of grapefruit (> 1 quart per day), pomegranate juice, unregulated supplements (e.g., red yeast rice, oyster mushrooms, etc.), surgery with severe metabolic demands, and heavy and/or unaccustomed exercise [58].
including dietary, weight, and exercise goals. Before confirming a diagnosis of statin-intolerance, the physician should ensure that a proper challenge-dechallenge-rechallengeviii
(CDR) protocol occurred and failed [58]. In addition, another important aspect of the management of statin-intolerance is to ensure that the patient is fully aware of the indication for statin treatment, the intended benefits, and the safety of statins [58].
Figure 1 below illustrates the statin intolerance management algorithm from the CCWG Guidelines (2016) [58]. The objective is to maintain patients on statin therapy with a CDR protocol [67]. Even though the CDR approach recommended by the CCWG is to ensure that patients in need of statin treatment be maintained on treatment, the CCWG Guidelines indicate that these obvious and axiomatic criteria are seldom met in clinical practice, leading to many patients who are in need of statin therapy being untreated [48].
viii The CDR protocol is a medical protocol for investigating adverse drug reactions, where a drug is administered
(challenge), withdrawn (dechallenge), and readministered (rechallenge) [67]. In statin-intolerance management, the rechallenge could be done with the same statin molecule/dosage, a reduction in statin dosage, or a switch to another statin with the same or lower potency [58].
Figure 1 Management approach for muscle symptoms or hyperCKemia.
CK creatine kinase, ULN upper limit of normal.
1.3.2
Diagnosis of Myopathy
Myopathies are currently diagnosed using a CK test, also known as a total CK or creatine phosphokinase test [68]. Creatine kinase is an enzyme expressed by various tissues and cell types. Conditions associated with muscle damage increase CK levels. These conditions include heart attack, strenuous physical activity, prolonged surgeries, muscular dystrophy, renal failure, and any drug or toxin that interferes with muscle energy production or increase in energy requirements, among others [68]. Preclinical statin studies show that statins decrease mitochondrial function, attenuate energy production, and alter muscle protein degradation, thereby providing a potential link between statins and muscle symptoms [69].
Factors other than age/gender affect the population normal range of CK values [70]. George et al. (2016) examined the distribution of CK values in 10,096 nonpregnant adults using the cross-sectional National Health and Nutrition Examination Survey (NHANES) 2011 to 2014 [71]. The Black race was strongly associated with CK values: the OR for an abnormal CK value was 5.08 (95% CI 3.65, 7.08) in Black women and 8.39 (95% CI 6.11, 11.52) in Black men. The differences in CK values by age, when excluding race ethnicity, were largely explained by body composition. Women with low body mass indices (BMIs) were less likely to have elevated CK values, while overweight or obese men had two-fold greater odds of having elevated CK values. Although the CCWG report uses multipliers to adjust the CK ULN values for ethnicity and gender, the magnitude of adjustment is much smaller than those reported by George et al. (2016) (2.0 for Black women and 2.5 for Black men), and the recommendations exclude adjustment for body composition [58]. These studies highlight that normal CK values are highly dependent on individual characteristics, which are not always included in the reference CK normal values. For instance, the Center for Disease Control and Prevention reference values from the laboratory manual, only account for patient age and gender [54]. The Mayo Clinic reports similar age and gender-specific reference CK normal values [55].
1.3.3
Risk Factors
Risk factors for statin-induced myopathy exist. These include female gender, low BMI, concomitant treatment with some cytochrome P450 inhibitors, declining kidney/liver function, and changes in statin level due to fluctuating albumin and α-1 glycoprotein levels [72]. The risk
of myopathy is greater with increasing statin dose and statin systemic exposure [72]. A link between the risk of simvastatin-induced myopathy and common variants in SLCO1B1 has been identified [73]. These findings have been replicated in both an independent trial and a practice-based longitudinal cohort [74, 75]. In addition, there is a genetic component associated with individual CK levels. In a genome-wide association study with 3,412 statin users, Dube et al. (2014) found genetic variants in a muscle CK gene (rs11559024) and leukocyte immunoglobulin-like receptor subfamily B member 5 gene (rs2361797) independently associated with CK levels in statin users [76]. These results were successfully replicated in an analysis of 5,330 statin/non-statin users from the Montreal Heart Institute Biobank [76].
1.3.4
Need for a New Diagnostic Test
Creatine kinase activity is neither sensitive to nor specific for statin-induced myopathy, and more appropriate laboratory parameters are not known [63]. Currently, given that statin-induced myopathy is diagnosed using CK tests, which have limited diagnostic capacity due to poor internal validity (elevated CK levels may be caused by a variety of factors others than statin therapy) [48, 77] and limited external validity (reference CK normal values vary between different populations) [70, 71], there is a need for a new diagnostic test to identify patients with statin-induced myopathy.
1.4
Pharmacogenomics Testing for Statin-Induced
Myopathy
There is an ongoing effort to develop a pharmacogenomics (PGx) test for statin-induced myopathy at the Beaulieu Saucier Pharmacogenomics Centre, led by Jean-Claude Tardif and Marie-Pierre Dubé, and funded by Genome Canada and Génome Québec (Grant number: 4530) [78, 79]. The research objective is to develop a PGx test to help physicians interpret personalized CK normal values for patients who have mild to moderate CK elevation (<5x ULN). The algorithm was planned to develop the personalized CK values for each patient, which would control for genetic markers (CKM and LILRB5 genetic variants), SLCO1B1 carrier status, age, sex, race, pre-statin CK measure, statin used, dose, duration of treatment, concomitant
medications, physical activity level (above or below Health Canada/FDA recommendations), smoking, height, weight, and BMI.
The purpose of this PGx test is to provide clinicians with a diagnostic tool for patients with muscle pain. Patients with negative test results would most likely be maintained on statin treatment and alternative causes of myalgia would be investigated. This approach is different from the earlier research program, which aimed at developing a test that would predict statin-induced-myopathy before statin initiation. Previous studies have identified a strong association between a non-synonymous coding single-nucleotide polymorphism, rs4149056, in the
SLCO1B1 gene and the risk of statin-induced myopathy [74, 80, 81]. To manage the risk of
statin-induced myopathy, Wilke et al. (2012) proposed pre-emptive genetic testing of SLCO1B1 gene variants prior to statin initiation to identify patients at risk of statin-induced myopathy [82]. However, subsequent studies have failed to show the clinical utility of initiating statin prescriptions guided by SLCO1B1 genetic testing [83, 84]. As CVE rates are much higher than serious myositis and rhabdomyolysis, reducing statin usage guided by the SLCO1B1 genotype may result in net harm [84].
The economic evaluation effort of the PGx test was conducted in parallel and independently from the test development team. We developed the economic evaluation from a theoretical perspective. The perspective of our economic evaluation was to determine the potential value of a PGx test. This approach has the advantage of being generic. It is not specific to a PGx test based on personalized CK values or any other genetic marker. Answering the question on the potential economic value of a hypothetical PGx test will provide answers on the potential market for this type of test.
We assumed this hypothetical PGx test would be used to diagnose statin myopathy in patients with mild to moderate CK values (CK <5 ULN). This PGx test would not be required for rhabdomyolysis, as it is associated with extremely high CK values, myoglobinemia and/or myoglobinuria, and pain symptoms that already have valid diagnostic tools [69].
1.5
Economic Evaluations of Diagnostic Tests
Guidelines on economic evaluations of medical devices are lacking. Drummond et al. (2009) reported that although the general method for economic evaluations is well established, medical
devices may require particular attention [85]. Ideally, when conducting an economic analysis, the objective is to value all long-term costs and benefits of a technology using a full economic evaluation, such as a cost-effectiveness, cost-utility, or cost benefit analysis [86]. Thus, when valuing a medical device, we need to understand its usage. For instance, when a device is used for both diagnostic and therapeutic purposes, complete efficacy and safety profiles for each use are required for the economic evaluation [85].
Other challenges in conducting economic evaluations of diagnostic tests exist. For example, inconsistencies in the quality assurance of laboratory tests may lead to complex interpretations of results and impact decision making [87]. In addition, Canadian health technology assessment (HTA) agencies lack guidance on the need for full evaluations of the costs and benefits of diagnostic tests. In Québec, l’Institut national d’excellence en santé et services sociaux (INESSS) does not require a full economic evaluation of long-term costs and benefits of medical devices [86] and the Canadian Agency for Drugs and Technologies in Health (CADTH) does not consider the economic evaluation of companion diagnostic tests in their evaluation of new pharmaceutical products [88]. This lack of guidance undervalues the importance of economic evaluations of diagnostic tests.
Another issue to consider for economic evaluations of diagnostic tests is the need to conduct modelling earlier in the development of these tests. Bern et al. (2016) conducted a systematic review of economic evaluations of pharmacogenetic and PGx screening tests [89]. They concluded that a majority of evaluations did not provide information regarding the intrinsic value of the PGx test. The importance of including the performance characteristics (i.e., accuracy, predictive value, and clinical utility) of the PGx test, while assessing the cost-effectiveness of a PGx test, was reported by several studies [87, 90-93]. The sensitivity and specificity (i.e., accuracy of a test) and especially the clinical and economic consequences of a false-positive and false-negative result of the investigated test, are key elements in the economic evaluation for Annemans et al. (2013) [92], Elkin et al. (2011) [94], Thariani et al. (2012) [87], and Epstein et al. (2009) [93]. Annemans et al. (2013) [92], Doble et al. (2013) [95], and Koelsch et al. (2013) [96] who suggest conducting economic modelling in the early stages of test development as this would provide a better understanding of the key economic challenges,
which would reduce potential uncertainty surrounding the value of the test, and thereby potentially lead to a better cost-effectiveness profile.
Chapter 2.
Thesis Objective
The objective of this thesis was to conduct an early economic evaluation of the PGx test, which is in development by the research team from the Beaulieu Saucier Pharmacogenomics Centre, led by Jean-Claude Tardif and Marie-Pierre Dubé, and funded by Genome Canada and Génome Québec for the project, “Personalized medicine strategies for molecular diagnostics
and targeted therapeutics of cardiovascular diseases” (Grant number: 4530) [78, 79].
2.1
Article I Objective
The objective of this article was to evaluate the economic value of a hypothetical PGx test for statin-induced myopathy in a cohort of patients at high CV risk using a Markov model. The model compares two strategies: with and without a PGx test in patients experiencing musculoskeletal pain (MSP).
2.2
Article II Objective
The objective of this article was to perform a cross-validation of the Markov model (Article I) developed for the evaluation of a hypothetical PGx test for statin-induced myopathy in a cohort of patients at high CV risk using a discrete event simulation (DES) model.
2.3
Article III Objectives
The objectives of this article were two-fold. First, this article compares the Markov and DES model results in light of the model differences. Second, the article summarizes our reflection on key points: 1) the economic evaluations of diagnostic tests, 2) the place in therapy of the PGx test for statin-induced myopathy, and 3) the impact of changes in treatment options on the economic evaluation.
Chapter 3.
Methodological Approach
This chapter presents the general methodological approach relevant to all articles used in this thesis. The methodological considerations specific to Article I and Article II are presented in Section 4.1 and Section 5.1.
3.1
Sensitivity and Specificity
Upon developing the Markov health state model for assessing the value of a hypothetical PGx test, there were no existing models in CVD assessing the economic value of a PGx test. When we started the thesis, the information on the PGx test characteristics (i.e., specificity and sensitivity) were unknown, as the PGx test research team led by Jean-Claude Tardif and Marie-Pierre Dubé were in the early development stages of the test. Hence, the de novo economic evaluation of the PGx test was conducted in parallel with the test development.
Although, not having the test parameters may be seen as a limiting aspect of the economic evaluation conducted in this thesis, we argue that it is one of the major strengths of this thesis project. An important aspect of the economic evaluation of diagnostic tests is the assessment of the consequences of false-positive and false-negative test outcomes. One approach for the economic evaluations would have been to assume a plausible range of test parameter values. Instead, we evaluated the value of the PGx test over the complete range of false-positive rates (FPRs) and false-negative rates (FNRs) (i.e., 0% to 100%). This choice allowed us to explore the consequences of false-positive and false-negative test results. Furthermore, we claim that exploring the FPRs and FNRs of the PGx test is a key element in the evaluation of diagnostic tests. Even with a perfect test (i.e., FPR=FNR=0%), if a proportion of physicians decide to ignore the test results or if patients decide to ignore their physician’s recommendation, it would be equivalent to an imperfect test (i.e., FPR≥0% and FNR≥0%). This could happen when a perfectly accurate PGx test result is negative; that is, the patient’s MSP is unrelated to the statin treatment. In a perfect clinical environment, the physician would maintain the statin therapy and the patient would adhere to their physician’s recommendation even if the patient suffers from MSP unrelated to the statin therapy. However, if this patient interrupted statin treatment regardless of the test result, the end outcome would be equivalent to a PGx false positive (FP)
test error, where the physician would prescribe the interruption of statin therapy. With a FP test result, the patient does not have a statin-induced myopathy, but the test falsely indicates that the patient has statin-induced myopathy. The FP erroneous test result, leading to statin discontinuation, is equivalent to a true-negative test result, with a patient interrupting the statin; they both lead to an unwarranted statin discontinuation. Using a broad interpretation of test performance parameters can be viewed as investigating the “real-world” test performance. Hence, as part of the thesis, we developed models with scenarios to assess the economic costs of false-positive and false-negative test outcomes.
Figure 2 shows the concept of test sensitivity and specificity [97, 98]. Sensitivity of a diagnostic test characterizes the capacity of the test to identify true-positive cases. Specificity characterizes the ability of the test to identify true-negative cases. A perfect test would have the sensitivity and specificity parameters equal to 100%. In the articles, we refer to FPR and FNR values.ix A
perfect test is characterized by FPR=FNR=0%, while a totally inaccurate test has a FPR=FNR=100%.
True condition
Condition positive Condition negative
Test results
Positive
test result True positive False positive Negative
test result False negative True negative Sensitivity= True positive Condition positive
Specificity= True negative Condition negative
Figure 2 Test sensitivity and specificity parameters
Instead of assuming a plausible range of FPR and FNR values of the hypothetical PGx test, we evaluated the economic model over the complete range of FPR and FNR values. This approach has enabled us to fully characterize the consequences of all possible positive and false-negative test outcomes.
3.2
The Perfect Clinical Environment
We approached the economic evaluation of the PGx test from a broad perspective that includes both the test performance parameters and the behaviour of physicians and patients. We defined the “Perfect Clinical Environment” as follows:
The PGx test is perfect (i.e., FPR=FNR=0%); and
Physicians base their prescribing recommendations solely on test results; and
Patients are fully compliant with the prescribing recommendations of their physicians. Deviation from one of the above physician or patient behaviour assumptions could be compared to the outcome of an imperfect test (i.e., FPR>0% and/or FNR>0%). This approach allowed us to have a broad interpretation of test results. For instance, if all patients without statin-induced myopathy interrupted their statin treatment, either because their physician did not prescribe according to the test result or the patient decided to ignore the physician’s recommendations, this would be equivalent to a PGx test with a FNR=100%. As we mentioned in Section 1.4, the PGx test for statin-induced myopathy will not be used in patients with rhabdomyolysis.
3.3
The Environment Without the Pharmacogenomics Test
We assumed that without access to a PGx test, physicians would interrupt the statin therapy of patients presenting with MSP. This scenario is equivalent to a diagnostic test with FPR=100% (i.e., all patients without statin-induced myopathy interrupt the statin therapy) and FNR=0% (i.e., none of the patients with statin-induced myopathy are maintained on statin therapy). In light of the CCWG Guidelines [58], which recommend a management algorithm based on a CDR approach, our assumption may be seen as not reflecting clinical practice. However, the CCWG Guidelines recognize that the CDR criteria are seldom met in clinical practice, leading to many patients who are in need of statin therapy being untreated [48]. Furthermore, patient
compliance needs to be considered in the economic evaluation as it is a key element in the PGx test evaluation. If the PGx test results do not convince physicians and patients to continue the statin therapy, this severely lessens the value of the PGx test.
In fact, we could argue that the value of the PGx test resides in the subgroup of physicians who would not follow the CCWG Guidelines, and patients who would ignore their physician’s prescribing recommendation to remain on treatment. Hence, the environment without the PGx test could be seen as applicable to this subgroup who would otherwise discontinue the statin therapy.
3.4
Digitization of Published Graphics
Most of the time, as researchers, we do not have access to patient level data from either clinical trials or observational studies. Hence, when conducting economic analyses, we use point estimates, and occasionally, 95% CIs. Although, this may be valid for developing Markov health state models, this is a major inconvenience when constructing a DES model where the simulation uses time-to-event to inform the model. Zhou et al. (2016) analyzed the differences in economic evaluation comparing a cohort Markov model, a Markov microsimulation, and a DES [99]. They developed their DES model by transforming the Markov transition probabilities into a time-to-event function. Although, we could have built the DES model using the transition probabilities from the Markov model, we opted to build the DES model using published survival curves (Kaplan-Meier) for the relevant CVEs in the model. There were two main reasons which motivated this decision: 1) data from published graphics would be more suitable for a DES model where events are modeled using time-to-event functions compared to a Markov model using point estimates for transition probabilities; 2) informing the CVE based on a different source of data would add an additional cross-validation dimension when comparing the Markov and DES models.
Converting graphics to time-to-event functions is a time-consuming process that requires three steps: processing images, converting images to numerical values, and estimating the mathematical functions, which are described below.