Pépite | Modélisation à l’échelle atomique des dislocations et de la plasticité dans la post-perovskite MgSiO3
173
0
0
Texte intégral
(2) Thèse de Alexandra M. Goryaeva, Lille 1, 2016. © 2016 Tous droits réservés.. lilliad.univ-lille.fr.
(3) Thèse de Alexandra M. Goryaeva, Lille 1, 2016. Order number: 42220. PhD Thesis l’Université de Lille – Sciences et Technologies Ecole doctorale Sciences de la Matière, du Rayonnement et de l'Environnement. To obtain the degree of. DOCTOR In Materials Sciences. Alexandra M. GORYAEVA. Modeling defects and plasticity in MgSiO3 post-perovskite at the atomic scale. Scientific committee: Dr. Andréa TOMMASI. University of Montpellier 2. President. Prof. Maureen D. LONG. Yale University. Examiner. Prof. Paul J. TACKLEY. ETH Zürich. Examiner. Prof. John P. BRODHOLT. University College London. Reviewer. Dr. Laurent PIZZAGALLI. Institut Pprime, Poitiers. Reviewer. Prof. Philippe CARREZ. University of Lille1. Supervisor. Prof. Patrick CORDIER. University of Lille1. Supervisor. © 2016 Tous droits réservés.. 6th December 2016. lilliad.univ-lille.fr.
(4) Thèse de Alexandra M. Goryaeva, Lille 1, 2016. © 2016 Tous droits réservés.. lilliad.univ-lille.fr.
(5) Thèse de Alexandra M. Goryaeva, Lille 1, 2016. L’homme, simple habitant de la terre, ne saurait en franchir les bornes. Mais s’il est rivé à son écorce, il peut en pénétrer tous les secrets. Jules Verne, 1903. © 2016 Tous droits réservés.. lilliad.univ-lille.fr.
(6) Thèse de Alexandra M. Goryaeva, Lille 1, 2016. Résumé La couche D" située à la frontière manteau-noyau est une région des plus complexes caractérisée en particulier par une forte anisotropie à différentes échelles. Inaccessible de par sa profondeur et caractérisée par des conditions de pression et de température extrêmes (au delà de 120 GPa et 2000 K), l‟étude de cette région de la Terre représente un défi majeur qui ne peut être abordé qu‟au travers de quelques observables géophysiques et d‟expériences de hautes pressions qui mènent parfois à des résultats contradictoires. En particulier, les causes de la forte anisotropie sismique de D" sont toujours l‟objet de débats (orientations préférentielles de cristaux (CPO) ou d‟inclusions, hétérogénéités thermochimiques,…). La contribution de l‟orientation préférentielle des cristaux à l‟anisotropie reste cependant une piste privilégiée compte-tenu de la structure très anisotrope de la postperovskite. De plus, la couche D" est une couche limite thermique à l‟interface entre le noyau constitué d‟un alliage de fer liquide et le manteau inférieur constitué de silicates solides mais au comportement visqueux. Les propriétés physiques de D" sont donc particulièrement importantes pour comprendre les transferts thermiques en provenance du noyau et leur contribution à la convection mantellique. Ce phénomène implique l‟écoulement plastique de roches contrôlé par le déplacement de défauts cristallins. Cependant, pour la post-perovskite, les informations concernant les propriétés mécaniques, les systèmes de glissement majeurs ou les défauts sont extrêmement parcellaires. Pour ces phases de hautes pressions, la modélisation numérique représente une approche de choix pour obtenir des informations sur les mécanismes de déformations élémentaires difficiles à obtenir par voie expérimentale. Le but de ce travail est d „étudier à l‟échelle atomique les défauts majeurs de la post-perovskite MgSiO3 (dislocations [100], [001] et ½[110]) ainsi que leurs mobilités afin d‟évaluer la capacité de cette phase à se déformer plastiquement par glissement de dislocations dans les conditions de la couche D".. © 2016 Tous droits réservés.. lilliad.univ-lille.fr.
(7) Thèse de Alexandra M. Goryaeva, Lille 1, 2016. Abstract The D‘‘ layer, located right above the core-mantle boundary (CMB), represents a very complex region with significant seismic anisotropy both at the global and local scale. Being a part of inaccessible deep Earth interior, characterized by extreme P-T conditions in excess of 120 GPa and 2000 K, this region is extremely challenging for interpretation relying only on the direct geophysical observations and high-pressure experiments, leading often to contradictory results. Thus, the reasons of the pronounced anisotropy in D‘‘ are still debated (e.g. crystal preferred orientation (CPO), oriented inclusions, thermo-chemical heterogeneities etc.). Among them, contribution of CPO in anisotropic silicate postperovskite phase is commonly considered as substantial. Furthermore, the D‘‘ layer is a thermal boundary layer located at the interface between liquid iron alloy, constituting the outer core, and solid although viscous silicates of the lowermost mantle. As such, its physical properties are critical for our understanding of the heat transfer from the core, driving mantle convection. The latter is governed by plastic flow, which, in turn, is controlled by the motion of defects in crystals. However, for the high-pressure postperovskite phase, information about mechanical properties, easy slip systems, dislocations and their behavior under stress is still scarce. For high pressure phases, numerical modelling represents a powerful tool able to provide the intrinsic properties and the elementary deformation mechanisms, not available for direct observations during highpressure experiments. The aim of this study is to access the structure and mobility of [100], [001] and ½<110> dislocations in MgSiO3 post-perovskite, relying on the full atomistic modeling approach, in order to infer the ability of this phase to plastically deform by dislocation glide at D‘‘ conditions.. © 2016 Tous droits réservés.. lilliad.univ-lille.fr.
(8) Thèse de Alexandra M. Goryaeva, Lille 1, 2016. © 2016 Tous droits réservés.. lilliad.univ-lille.fr.
(9) Thèse de Alexandra M. Goryaeva, Lille 1, 2016. CONTENTS INTRODUCTION………………………………………………………………………………...13. CHAPTER 1. Literature overview on the post-perovskite…………………………………….19 1.1. Post-perovskite crystal structure………………………………………………………….20 1.2. Perovskite → post perovskite phase transition…………………………………………...21 1.3. Stability of post-perovskite at extreme pressures………………………………………...26 1.4. Elasticity of silicate post-perovskite……………………………………………………...29 1.5. Plastic deformation of MgSiO3 post-perovskite and its structural analogues…………....30 CHAPTER 2. Models and methods……………………………………………………………..35 2.1. Atomic scale modeling: methodology and computational setup…………………………36 2.1.1. Ab initio calculations…………………………………………………………...36 2.1.2. Pairwise potential modeling……………………………………………………40 2.1.3. Nudged elastic band method…………………………………………………...44 2.2. Atomistic modeling of planar defects…………………………………………………….46 2.2.1 Generalized stacking faults……………………………………………………..46 2.2.2. Twinning energy landscape……………………………………………………48 2.3. Atomistic modeling of linear defects……………………………………………………..49 2.3.1 Designing and analyzing dislocation cores structures………………………….50 2.3.2 Geometry of simulation cells…………………………………………………...54 2.3.3 Computing lattice friction………………………………………………………57 2.4. Thermally activated dislocation glide…………………………………………………….58 2.4.1. Kink-pair formation mechanism……………………………………………….58 2.4.2. LT model in conjunction with atomistic simulations…………………………..60. CHAPTER 3. Generalized stacking faults……………………………………………………...63 3.1. Location of the shear planes..………………………………………………….…………64 3.2. GSF excess energies……………………………………………………………………...66 3.3. Validity of the pairwise potential…………………………………………………………70 3.4. Influence of crystal chemistry…………………………………………………………….71 3.5. Searching for the easiest slip systems…………………………………………………….74. 9 © 2016 Tous droits réservés.. lilliad.univ-lille.fr.
(10) Thèse de Alexandra M. Goryaeva, Lille 1, 2016. 3.6. Summary………………………….……………………………………...……………….74. CHAPTER 4. Dislocations with [100] Burgers vector…………………………………………77 4.1. Stable dislocation cores…………………………………………………………………..78 4.1.1. Screw dislocations…………………………………………………………......78 4.1.2. Edge dislocations………………………………………………………………82 4.2 Anisotropic lattice friction: Peierls stress calculations……………………………………85 4.2.1. Glide of screw dislocations…………………………………………………….85 4.2.2. Glide of edge dislocations……………………………………………………...87 4.3 Peierls barrier and MEP of [100](010) screw dislocation glide…………………………..88 4.3.1. Pairwise potential calculations…………………………………………...…….88 4.3.2. DFT calculations………………………………………………………….........90 4.4 Line tension of [100](010) screw dislocations…………………………………………….92 4.5 Kink-pair formation on [100] screw dislocations…………………………………………94 4.6. Summary………………………….…………………...………………………………….96. CHAPTER 5. Dislocations with [001] Burgers vector…………………………………………99 5.1. Structure of stable [001] dislocation cores………………………………………………100 5.1.1. Screw dislocations…………………………………………………………….100 5.1.2. Edge dislocations……………………………………………………………..102 5.2 Evolution of dislocation core characteristics with dissociation distance………...………103 5.3 Stacking fault energies…………………………………………………………………...105 5.4 Dissociation process……………………………………………………………………...108 5.5 Lattice friction……………………………………………………………………………109 5.6 Kink-pair formation enthalpy…………………………………………………………....110 5.7. Summary………………………….……………………………………………………..112 CHAPTER 6. Dislocations and deformation twinning with ½[110] Burgers vector………..113 6.1. Structure of ½ [110] dislocation cores…………………………………………………..114 6.1.1 Screw dislocations……………………………………………………………..114 6.1.2 Edge dislocations……………………………………………………………...116 6.2 Evolution of ½<110>{110} dislocation cores under applied stress……………………..118. 10 © 2016 Tous droits réservés.. lilliad.univ-lille.fr.
(11) Thèse de Alexandra M. Goryaeva, Lille 1, 2016. 6.3 Stacking fault structure and γ-energy…………………………………………………….120 6.4 Modeling ½<110>{110} deformation twinning…………………………………………122 6.4.1 Generalized planar fault energy……………………………………………….123 6.4.2 Twin nucleation model………………………………………………………...125 6.4.3 Twin morphology and critical twinning stress………………………………...128 6.5. Summary………………………….……………………………………………………..130. CHAPTER 7. Discussion and implications……………………………………….……………131 7.1. Structures of dislocation cores in MgSiO3 post-perovskite …………………………….132 7.2. Anisotropic lattice friction…………………………………………................................135 7.3. Thermally activated dislocation glide………………………………………...................139 7.4. Implications…………………………………………………….......................................142 CONCLUSIONS…………………………………………………………………………………147 PERSPECTIVES………………………………………………………………...………………151 Acknowledgements………..………………...………………………...………………………....153 Bibliography………………………….…………………………………………………………..155 List of publications…………………..……...………………………...………………………....169 List of abbreviations……………………...…………………………...………………………....170. 11 © 2016 Tous droits réservés.. lilliad.univ-lille.fr.
(12) Thèse de Alexandra M. Goryaeva, Lille 1, 2016. © 2016 Tous droits réservés.. lilliad.univ-lille.fr.
(13) Thèse de Alexandra M. Goryaeva, Lille 1, 2016. INTRODUCTION. Being restricted to the surface of the Earth, we tend to reveal the secrets of its inaccessible deep interior. An important source of information about the inner structure and composition of the planet comes from geophysical observations and from seismic waves that propagate through the Earth or along its subsurface after the occurrence of earthquakes. The travel time of seismic waves represents the first observable. Seismic wave velocities depend on the elastic properties and on the density of the matter through which the waves travel. This allows distinguishing the major divisions of the Earth's interior into a silicate mantle which extends to a depth of ~2900 km, and the iron rich metallic core with a radius of ~3400 km, subdivided into a liquid outer and a solid inner core (Fig. 1). The Earth‟s mantle is not homogeneous with depth: abrupt variations in seismic body wave velocities indicate changes in structure or/and composition of the Earth's interior with depth. Based on such observations, the Earth's mantle is further divided into two major. Fig.1. Schematic illustration of the Earth inner structure and the major distinct characteristics of the Earth‘s mantle. Right panel is taken from Mainprice et al. (2000). The radial seismic anisotropy profile corresponds to the seismic model SP6-F by Montagner and Kennett (1996).. 13 © 2016 Tous droits réservés.. lilliad.univ-lille.fr.
(14) Thèse de Alexandra M. Goryaeva, Lille 1, 2016. Introduction parts: the upper mantle that extends to a depth of about 410 km and mostly consists of (Mg,Fe)Si2O4 olivine (60%), (Mg,Fe,Ca)2Si2O3 pyroxenes and (Mg,Fe,Ca)3Al2Si3O12 garnets; and the lower mantle between 660-2700 km mostly made up by (Mg,Fe,Ca,Al)(Al,Si)O3 perovskite (PV), named bridgmanite in 2014 (Tschauner and Ma 2014), and (Mg,Fe)O ferropericlase. Besides these two regions, there are two highly anisotropic layers of ~200 km thickness (Fig. 1) where horizontally polarized shear waves travel faster (velocity VSH) than vertically polarized shear waves (VSV): the transition zone (TZ) which separates the lower and the upper mantle, and the D‘‘ layer located right above the core-mantle boundary (CMB). Sharp seismic discontinuities in the transition zone are known to be associated with subsequent phase transitions of (Mg,Fe)Si2O4 olivine into wadsleyite at ~410 km depth and ringwoodite at ~520 km depth, while the nature of the profound D‘‘ layer, lying almost halfway to the Earth‟s center, is still a matter of ongoing debates. Being located at the interface between the outer core and the lowermost mantle, where liquid iron alloy meets solid silicates, this region represents one of the most complex boundary layers of the Earth, where, for instance, the density contrast exceeds the one between the crust and the atmosphere. The properties of this region inevitably influence the processes occurring both in the core and in the mantle. Although being solid, the mantle undergoes slow convection due to the temperature and density gradient between its different regions. At the surface, downwelling zones are associated with cold and dense subducting slabs (the portion of a tectonic plate) sinking into the mantle, while the upwelling regions mainly correspond to the hot mantle plumes, rising from sources which may be as deep as the CMB (Fig. 2). Thus, the heat flow across the CMB plays an important role for the thermal structure of the planet, and contributes to the driving force of mantle convection. Historically, the few hundred kilometers zone above the CMB were interpreted as a continuous thermal boundary layer, characterized by reduced seismic velocity gradient. This view has changed in the early 1980s, when the discontinuous increase in the shear wave velocities was first observed between 250 and 350 km above the CMB (Lay and Helmberger 1983). Since that time, numerous seismological observations (e.g. Weber 1993; Garnero and Helmberger 1995; Thomas et al. 2004; Lay 2008; Hutko et al. 2009; Long 2009; Cobden and Thomas 2013 etc.) have shown that the D‘‘ region is much more. 14 © 2016 Tous droits réservés.. lilliad.univ-lille.fr.
(15) Thèse de Alexandra M. Goryaeva, Lille 1, 2016. Introduction. Fig.2. Schematic illustration of the distinct large scale structures at the bottom of the mantle and their possible role in mantle convection. LLSVP corresponds to the large low shear wave velocity provinces. Mantle plumes are generated at their top and entrain some fractions of the matter from the deep interior towards the surface. ULVZ stands for the ultralow velocity zones, likely represented by residuals of the magma ocean enriched in iron. The PPV zone corresponds to the lenses of post-perovskite, thought to be stable in relatively cold regions beneath the subducted slabs. The thickness of the PPV lenses strongly depends on the temperature. The picture is modified from Deschamps et al. (2015).. complex and heterogeneous than the rest of the lower mantle, where no major discontinuities are detected. Topographically, global structures are detected in the deep mantle beneath Africa and South-Central Pacific (Fig. 3). These zones are characterized by shear wave velocity anomalies of -2 to -5%, and therefore, defined as large low shear-wave velocity provinces (LLSVPs). It‟s generally accepted that these provinces, covering ~20% of the CMB, are hotter than the rest of the mantle and represent the main source of mantle plumes (see Davies et al. 2015 for a review). Location of LLSVPs is strongly correlated with location of the hot spots and the reconstructed eruption sites on the Earth‟s surface (Fig. 3). However, seismic observations in LLSVPs cannot be explained by thermal anomalies alone. The exact nature of LLSVPs is still not clear and understanding compositional anomalies (e.g. enrichment in iron) is needed to better explain it. Another low velocity anomalies at the bottom of the mantle are characterized by significant drop of VP and VS velocities by ~10% (Garnero and Helmberger 1995) and, 15 © 2016 Tous droits réservés.. lilliad.univ-lille.fr.
(16) Thèse de Alexandra M. Goryaeva, Lille 1, 2016. Introduction therefore, commonly referred as ultralow velocity zones (ULVZ). In contrast to LLSVPs, ULVZs form local structures of 5-40 km. These zones are generally observed at the edges of LLSVPs (Fig. 2) and interpreted as denser regions, possibly represented by pockets of partial melt enriched in iron (Williams and Garnero 1996; Rost et al. 2005). Locally, regional seismic data also indicates presence of abrupt vertical changes in speed of both P and S waves at the top of D‘‘ region. This abrupt changes are commonly referred as D‘‘ discontinuity. Numerous studies reported existence of such structures between ~100 and 450 km above the CMB in different parts of the globe (see Cobden et al. 2015 for a review). Mapping the regions, where D‘‘ discontinuity has been observed for S and P waves (Fig. 3), clearly demonstrates that D‘‘ discontinuity does not form a global structure, but rather represents lenses locally disposed out of LLSVPs, i.e. in colder regions, likely associated with subducted slabs.. Fig.3. Superposing the shear wave tomography at the CMB (2800 depth) with location of surface hotspots (green dots on the left panel), reconstructed eruption sites (yellow dots on the left panel) and with S- and P-waves seismic discontinuities (right panel). On both plots LLSVPs correspond to the red areas. The pictures are taken from Davies et al. (2015) and Cobden et al. (2015).. By analogy with the phase transformations in the TZ, Sidorin et al. (1999) suggested that seismic observations of the D‘‘ discontinuity could be explained by a mineral phase transition with a large positive Clapeyron slope of ~7 MPa/K. However, at that time no phase transition was known to occur and bridgmanite was believed to be stable down to the CMB (Knittle and Jeanloz 1987; Kesson et al. 1998) where pressures are expected to reach 120-135 GPa. In 2004, several research groups (Murakami et al. 2004; Oganov et al. 2004; Shim et al. 2004) independently demonstrated that MgSiO3 bridgmanite transforms into 16 © 2016 Tous droits réservés.. lilliad.univ-lille.fr.
(17) Thèse de Alexandra M. Goryaeva, Lille 1, 2016. Introduction. Fig.4. Schematic illustration of the relation between cold and warm geotherms at the bottom of the lower mantle with the PV→PPV transition boundary. The picture is modified from Hernlund et al. (2005).. layered MgSiO3 post-perovskite (PPV) at pressures and temperatures in excess of 120 GPa and 2000 K (see Chapter 1 for more details), i.e. at the P-T conditions close to that in the lowermost mantle. In agreement with the hypothetical suggestion by Sidorin et al. (1999), the so-called “last mantle phase transition” is characterized by a large Clapeyron slope of 6-11 MPa/K (Ono and Oganov 2005; Hirose et al. 2006a; Tsuchiya et al. 2004a), which indicates that lateral variations in the temperature at the CMB will result in large lateral variations in the transition depth. In cold regions, the post-perovskite transition rather occurs at relatively shallow depth, while in hot regions it may not transform at all (Fig. 4). Moreover, near the CMB where temperature increases rapidly, a back transition from PPV to PV (Fig. 4) may take place (Hernlund et al. 2005). Several seismologic observations indicate presence of double discontinuities, consistent with such a forward transformation, beneath the Pacific and the Caribbean (Thomas et al. 2004; Lay et al. 2006; van der Hilst et al. 2007; Hutko et al. 2008). However, taking into account large uncertainties in the thermochemical state of the lowermost mantle (Grocholski et al. 2012), the correlation between location of D‘‘ discontinuities and location of cold regions can‟t be blindly interpreted as a direct evidence of PPV at the CMB. A major question is whether presence of this phase can explain the observed seismic anisotropy and discontinuity of D‘‘. To answer this question, anisotropic seismic properties of the post-perovskite should be compared with the observed seismic data. Dynamic processes in the Earth‟s interior, such as mantle convection, cause deformation of the mineral phases that make up the mantle. At the mantle conditions, these rocks deform plastically under very low strain rates 17 © 2016 Tous droits réservés.. lilliad.univ-lille.fr.
(18) Thèse de Alexandra M. Goryaeva, Lille 1, 2016. Introduction (in the order of 10-16-10-14 s-1) and their rheological behavior is controlled by the motion of defects in the crystal structure. Anisotropic mobility of defects produces crystal preferred orientation (CPO), which, in turn, significantly affects seismic properties of an aggregate. In this context, understanding anisotropic rheological and seismic properties of mineral phases is not possible without understanding the elementary deformation mechanisms at the microscopic scale. So far, the easy slip systems in the post-perovskite are poorly known. Silicate post-perovskite is only stable at very high P-T conditions and cannot be quenched to ambient pressure. Therefore, there is no direct experimental evidence of dislocations activity in this phase and the available information is limited to in situ XRD measurements of textures, from which one can only assume easy slip systems. Well controlled experimental deformation of minerals, followed by the micro texture analysis, are very challenging under extreme P-T conditions, and the textures observed experimentally for MgSiO3 lead conflicting results (Merkel et al. 2007; Miyagi et al. 2011). Moreover, strain-rates accessible in a laboratory are 8-10 orders of magnitude larger than those in the mantle. Alternatively, numerical modeling represents a powerful tool able to provide information on microscopic processes taking place in the deep Earth‟s interior. The present work aims to investigate fundamental mechanisms of plastic deformation in the high pressure MgSiO3 post-perovskite through modeling defects and their mobility at the atomic scale, which in perspective will allow determining the relevant deformation textures resulting from dislocation creep in this phase at the lower mantle conditions.. 18 © 2016 Tous droits réservés.. lilliad.univ-lille.fr.
(19) Thèse de Alexandra M. Goryaeva, Lille 1, 2016. CHAPTER 1 Literature Overview on the Post-Perovskite. In 2004, discovery of the so-called “last mantle phase transition” immediately became promising to shed light on puzzling properties of the D′′ layer, including its marked seismic anisotropy. Since that time, anisotropic physical properties of the post-perovskite have been intensively studied in order to answer the major question whether this phase can explain the enigma of D′′. This chapter provides a bibliographic overview of MgSiO3 post-perovskite physical properties, essential for understanding rheological properties in the lowermost mantle, and summarizes the results of high-pressure experiments and numerical modeling performed within the last 12 years. The overview includes the description of the intrinsic crystal structure; experimental and theoretical evidence of the post-perovskite transition boundary and stability field at extreme pressures; insights into anisotropic elasticity and analysis of the available data on plastic deformation of silicate post-perovskite and its lowpressure structural analogues.. © 2016 Tous droits réservés.. lilliad.univ-lille.fr.
(20) Thèse de Alexandra M. Goryaeva, Lille 1, 2016. Chapter 1. Post-Perovskite. 1.1 Post-perovskite structure High-pressure MgSiO3 post-perovskite phase exhibits orthorhombic CaIrO3-type crystal structure (space group Cmcm, z = 4) with anisotropic unit cell parameters a = 2.456 Å , b = 8.042 Å and c = 6.093 Å at 121 GPa (Murakami et al. 2004). The occupied Wyckoff positions are 4c for Mg, 4a for Si, and 4c and 8f for O. Uncommonly for high-pressure minerals, post-perovskite is characterized by the presence of two nonequivalent cation layers parallel to (010). These layers are formed by Si-octahedra and eightfold coordinated Mg exclusively (Fig. 1.1). Along [100], Si-octahedra share edges forming rutile-like chains which are interconnected by apical oxygen atoms along [001] direction, building up (010) Si-layers. In contrast to the octahedra, centered by highly charged Si atoms, Mg polyhedra are linked with each other and Si-layers by edges and triangle faces. Due to the octahedral junctions by vertices, in the dense post-perovskite structure there are still [100] empty channels with pseudo trigonal symmetry (left panel of Fig. 1.1).. Fig. 1.1 Crystal structure of MgSiO3 post-perovskite. Mg atoms and polyhedra are shown in grey, Si – in blue and O – in red.. Being normal to the shortest lattice repeat, (100) represents the most densely packed atomic plane. In the post-perovskite, there are only two {100} atomic layers (per unit length) which are geometrically identical and shifted from each other by ½[010] in accord with the symmetry produced by the C-lattice. Presence of two equivalent atomic layers 20 © 2016 Tous droits réservés.. lilliad.univ-lille.fr.
(21) Thèse de Alexandra M. Goryaeva, Lille 1, 2016. Post-Perovskite. Chapter 1. Fig. 1.2 Atomic (100) monolayer of the post-perovskite compared with orthorhombically distorted close pack layer. Zigzags of cations and anions are highlighted with grey and red, respectively; unit cell is shown with black rectangular.. with pseudo trigonal features, shifted from each other, implies a relation with the hexagonal close packed (hcp) structure. However, the specific arrangement of atoms with different nature within each (100) layer (Fig. 1.2) as well as the location of these layers with respect to each other excludes the possibility to describe the post-perovskite structure in terms of a distorted close pack formed by anions or/and cations.. 1.2 Perovskite → post-perovskite phase transition Transition boundary The first experimental evidence of MgSiO3 post-perovskite phase transition (Murakami et al. 2004) was detected in a laser-heated diamond anvil cell (LHDAC) at P-T conditions in excess of 125 GPa and 2500 K (Pt scale by Jamieson et al. (1982)). The transition was shown to be reversible at 101 GPa and 2200 K, however, a specific Clapeyron slope was not properly constrained. Simultaneously, the existence of this new phase was confirmed by ab initio simulations (Oganov and Ono 2004, Tsuchiya et al. 2004a). Further, the transition boundary in pure MgSiO3 was experimentally determined (Ono and Oganov 2005, Hirose et al. 2006a) based on Pt (Jamieson et al. 1982; Holmes et al. 1989), MgO (Speziale et al. 2001) and Au (Heinz and Jeanloz 1984; Shim et al. 2002; Tsuchiya 2003) pressure standards (Fig. 1.3). The transition pressures reported from 21 © 2016 Tous droits réservés.. lilliad.univ-lille.fr.
(22) Thèse de Alexandra M. Goryaeva, Lille 1, 2016. Chapter 1. Post-Perovskite. Fig. 1.3 Perovskite → post-perovskite transition boundaries observed experimentally (Hirose et al. 2006a; Ono and Oganov 2005) with different pressure scales and calculated from the first principles (Tsuchiya et al. 2004a) for pure MgSiO3. Range of D‘‘ discontinuity is taken from Cobden et al. (2015).. Fig. 1.4 Pressure ranges of the silicate perovskite → post-perovskite phase transitions observed experimentally at 2500 K for various compositions compared to the pressure conditions of the D‘‘ layer. The diagram is built based on the overview of experimental data published in Cobden et al. (2015).. different pressure scales vary by more than 20 GPa. Even while using a given standard, different equations of state (EoSs) of the calibration material may result in some discrepancies in the P-T conditions determined (see Fig. 1.3 for Au and Pt scales). In overall, the transition pressures estimated with Pt are higher than those defined with Au but both are characterized by the similar Clapeyron slope of ~6 - 7 MPa/K (Ono and Oganov 22 © 2016 Tous droits réservés.. lilliad.univ-lille.fr.
(23) Thèse de Alexandra M. Goryaeva, Lille 1, 2016. Post-Perovskite. Chapter 1. 2005, Hirose et al. 2006a), close to that suggested to be necessary for the solid-solid phase transition accounting for the observed D‘‘ discontinuity (Sidorin et al. 1999). At the same time, MgO standard provides intermediate pressures but with a higher dP/dT gradient of the phase boundary close to 11.5 MPa/K (Hirose et al. 2006a). Complementary to the high-pressure experiments (Ono and Oganov 2005, Hirose et al. 2006a), the Clapeyron slope for the PV → PPV transformation in pure Mg-silicate was computed from the first-principles by Tsuchiya et al. (2004a) within the quasiharmonic approximation (QHA) framework (Carrier et al. 2008, Wallace 1972). The estimated range of the phase transition, with the lower pressure frontier from LDA (Perdew and Zunger 1981) and the higher – from GGA (Perdew et al. 1996) exchange correlation functionals, is indicated with a shaded area on Fig. 1.3. The calculated Clapeyron slope is ~7.5 MPa/K, consistent with those derived from high-pressure experiments with Pt and Au scales. Although the uncertainties in the defined phase transition boundaries are quite large both for experimental and theoretical techniques, superposing the overall results with the estimated mantle adiabat (Brown and Shankland 1981) suggests that the phase transition in MgSiO3 is likely associated with the D'' discontinuity at ~120 GPa and 2500 K (Fig. 1.3) as it was reported from the very first experiments by Murakami et al. (2004). Besides pure MgSiO3, Fe- and Al-bearing compositions have been extensively studied in order to estimate compositional effects on the PV → PPV transition boundary (Fig. 1.4). Experiments and theoretical simulations performed on binary (Mg1-xFex)SiO3 system indicate that incorporation of Fe2+ as Mg substituent significantly decreases the transition pressure (Mao et al. 2004, 2005; Caracas and Cohen 2005; Zhang et al. 2016). Thus, experimental measurements on the silicate systems with compositions close to (Mg0.9Fe0.1)SiO3 consistently provide the onset of PV → PPV phase transition at pressures and temperatures about 111 GPa and 2500 K (Shieh et al. 2006; Catalli et al. 2009; Metsue and Tsuchiya 2012). At the same time, most of theoretical (Akber-Knutson et al. 2005; Caracas and Cohen 2005; Zhang and Oganov 2006) and experimental (Tateno et al. 2005) studies, except for ab initio simulations by Tsuchiya and Tsuchiya (2008), indicate that Al3+ has the opposite effect stabilizing perovskite phase at higher pressures (Fig. 1.4). Accounting for simultaneous presence of both Fe and Al impurities, experimental studies of ternary (Mg1-xFex)(Si1-xAlx)O3 systems indicate a widely varying transition region from +20 GPa above to -25 GPa below the CMB (Nishio-Hamane et al. 2007; Catalli et al. 2009; Andrault et al. 2010; Shieh et al. 2011). 23 © 2016 Tous droits réservés.. lilliad.univ-lille.fr.
(24) Thèse de Alexandra M. Goryaeva, Lille 1, 2016. Chapter 1. Post-Perovskite. The post-perovskite phase transition was also experimentally observed in more complex multi-phase systems compositionally close to natural peridotitic/pyrolitic mantle and Mid-Ocean Ridge Basalt (MORB). Most observations of PV → PPV transformation in pyrolitic compositions occur in a relatively narrow transition region of ~113 – 127 GPa at 2500 K (Murakami et al. 2005; Ono and Oganov 2005; Ohta et al. 2008; Sinmyo et al. 2011). However, study by Groholski et al. (2012) demonstrates that the transition boundary in pyrolite may be shifted up to 140 GPa. Since most of these studies were based on gold pressure standards, the calibration effect would not account for more than ~5 GPa of discrepancy and the origin of the latest is still debated. Experiments performed for compositions close to MORB (Hirose et al. 2005; Ohta et al. 2008; Grocholski et al. 2012), corresponding to the component of subducted slabs which may penetrate into the lower mantle (Tackley 2011), consistently report the onset of the phase transition between ~107 and 114 GPa at 2500 K (Fig. 1.4). In summary, the experimental data illustrated on (Fig. 1.4) clearly demonstrates that P-T conditions and thickness of the phase boundary represent a complex function of chemical composition, which, in turn, remains obscure due to the uncertainties in the thermochemical state of the lowermost mantle (Grocholski et al. 2012).. Mechanism of the phase transition As suggested by Tsuchiya et al. (2004a), a structural relation between perovskite (Pbnm) and post-perovskite (Cmcm) phases can be seen from the compressive behavior of MgSiO3 perovskite (Wetzcovitch et al. 1995), illustrated on the upper panel of Fig. 1.5. In the perovskite structure under an applied strain ε6, the angles between octahedral edges bisected by (110) plane decrease faster than other similar angles. With sufficiently large strain (ε6 > 0.3) these angles vanish and give rise to the layered post-perovskite structure. However, a uniform transformation by simply closing the corners between Si-octahedra was demonstrated to be energetically less favorable than the transition through intermediate phases built by successive [101](010) stacking faults (Zahn 2011; Oganov et al. 2005). During this process, the shear strain decreasing the angles between octahedral edges is expected to enhance the onset of phase transformation. The reverse PPV → PV transformation is believed to occur through accumulation of <110>{110} stacking faults in post-perovskite (Oganov et al. 2005) as illustrated on Fig. 1.5. 24 © 2016 Tous droits réservés.. lilliad.univ-lille.fr.
(25) Thèse de Alexandra M. Goryaeva, Lille 1, 2016. Post-Perovskite. Chapter 1. Fig. 1.5 Structural relation between the orthorhombic perovskite (bridgmanite) and post-perovskite phases. Transformation mechanism on the upper panel proposed by Tsuchiya et al. (2004a), on the lower one – by Oganov et al. (2005). According to the transition mechanisms described above (Tsuchiya et al. 2004a; Oganov et al. 2005), the post-perovskite structure inherits [001] direction of the perovskite (Fig.1.5), while [100]PV and [010]PV directions correspond to <110>PPV vectors in the postperovskite reference (Fig. 1.5). Relying on this simple structural relation between the two phases, one can expect the appearance of a local structure resembling post-perovskite geometry inside [010](100) and [100](010) dislocation cores in perovskite; and, by analogy, - resembling perovskite in <110>{110} dislocation cores in the post-perovskite. Indeed, such a kind of dislocation cores was reported for dissociated [010](100) and [010](100) edge dislocations in MgSiO3 bridgmanite (Hirel et al. 2014; 2016). For these 25 © 2016 Tous droits réservés.. lilliad.univ-lille.fr.
(26) Thèse de Alexandra M. Goryaeva, Lille 1, 2016. Chapter 1. Post-Perovskite. dislocations, stacking faults between the two partials look like a lamella of the distorted post-perovskite structure where octahedra are linked by edges in one direction, by corners in another one and don‟t interconnect in the third direction, forming a nucleus of 2D layers. Thus, dislocations in perovskite might prompt the instant of the phase transition into postperovskite and vice versa. However, up to now there is no evidence on atomic structure of <110> dislocation cores in post-perovskite, possibly playing an important role for the PPV → PV transformation process.. 1.3 Stability of post-perovskite at extreme pressures Besides the Earth's CMB, several studies suggest the mantle of some extra-solar large rocky planets (if differentiation into silicate mantle and metallic core takes place there) to be made mostly of the silicate post-perovskite phase (Stamenković et al. 2011; Tackley et al. 2013; Baraffe et al. 2014). The so-called super-Earths, e.g. in GJ876d (Rivera et al. 2005), CoRoT-7 (Queloz et al. 2009), Kepler-10b (Batalha et al. 2011) and some other planetary systems, are expected to have a density ρ = 5.6 ± 1.3 g/cm3, very close to that of Earth, and radii of about twice the Earth radius. Based on these characteristics, pressures at the base of their mantles are expected to reach Tera Pascals (Valencia et al. 2006; Sotin et al. 2007). The interior dynamics of these planets causes a keen scientific interest nowadays and understanding of the post-perovskite plasticity may provide some insights into rheological processes taking place outside of the Solar System. Taking into account the extreme P-T conditions relevant to the interior of superEarths, only shock experimental techniques can be directly applied to investigate the stability field of the silicate post-perovskite phase there. Alternative experiments performed for isostructural low-pressures analogues and theoretical studies of the postperovskite behavior under compression provide contradictory results and report several possible scenarios of phase transformations into the so-called post-PPV phases followed by their decomposition into oxides (Fig. 1.6). Thus, study of MnTiO3 post-perovskite suggested its decomposition into MnO and orthorhombic MnTi2O5 (Okada et al. 2011), however, the precise crystal structure of the latest was not identified. Similarly, a gradual dissociation of MgSiO3 post-perovskite into MgO (CsCl - type) and MgSi2O5 with small 26 © 2016 Tous droits réservés.. lilliad.univ-lille.fr.
(27) Thèse de Alexandra M. Goryaeva, Lille 1, 2016. Post-Perovskite. Chapter 1. Fig. 1.6 Phase diagram of the two-stage (QHA by Umemoto and Wentzcovitch (2011)) and three-stage dissociation (AGA by Wu et al. (2014)) of MgSiO3 PPV in comparison with the estimated P-T conditions at CMB of terrestrial exoplanets (Sotin et al. 2007).. Fig. 1.7 (a) Monoclinic MgSi2O5 post-PPV (P21/c) observed by (Umemoto and Wentzcovitch 2011) and (Wu et al. 2014). (b) Tetragonal Mg2SiO4 post-PPV (I4̅ 2d) reported by (Wu et al. 2014). On the right panel anion sublattice is left out.. 27 © 2016 Tous droits réservés.. lilliad.univ-lille.fr.
(28) Thèse de Alexandra M. Goryaeva, Lille 1, 2016. Chapter 1. Post-Perovskite. monoclinic distortions from the orthorhombic Pbam cell (P21/c, a = 4.429 Å, b = 4.031 Å, c = 6.179 Å, β = 89.68°) was predicted at ~0.9 TPa by Umemoto and Wentzcovitch (2011) from the first-principles simulations within the quasiharmonic approximation (QHA) (Carrier et al. 2008, Wallace 1972). In MgSi2O5, both Si and Mg atoms change their original coordination into denser 9- and 8-fold coordinated polyhedra (Fig. 1.7a) interconnected in such a way that 9-fold coordinated Si2 form (010) layers linked with each other by [100] chains made of 8-fold coordinated Si1. The empty [100] channels in this rigid Si network are filled by Mg atoms. The P21/c post-PPV phase is shown to be stable up to pressures of ~2.1 TPa (Fig. 1.6) when it undergoes further decomposition into MgO (CsCl-type) and SiO2 (Fe2P-type) oxides. Another theoretical study by Wu et al. (2014) based on adaptive genetic algorithm (AGA) confirms the appearance of MgSi2O5 (P21/c) post-PPV, however, the dissociation mechanism (Fig. 1.6) is shown to be more complex than the one proposed by Umemoto and Wentzcovitch (2011). At the first stage of the MgSiO3 PPV decomposition at ~0.77 TPa, MgSi2O5 (P21/c) is found to coexist with another high-pressure tetragonal phase Mg2SiO4 (I4̅ 2d, a = 4.5745 Å, b = 4.7006 Å). In this structure, both Si and Mg are 8-fold coordinated and create a complex network made of 6-member corrugated rings penetrating into each other (Fig. 1.7b) in accord with the symmetry produced by the diamond d-plane. Under further compression, MgSi2O5 (P21/c) breaks down into SiO2 (Fe2P-type) and Mg2SiO4 (I4̅2d) at ~1.25 TPa, followed by gradual dissociation into MgO (CsCl-type) and SiO2 (Fe2P-type). The complete decomposition into oxides is expected to occur at ~3.09 TPa, which notably exceeds the expected pressures in mantle of super Earth planets (Sotin et al. 2007). Comparing the estimated internal pressures and temperatures of the large rocky planets (Valencia et al. 2006; Sotin et al. 2007) with the phase boundaries calculated using the QHA (Umemoto and Wentzcovitch 2011) and AGA (Wu et al. 2014), MgSiO3 postperovskite could be expected to remain stable in the mantles of super-Earths with masses smaller than 6-7M⊕ (Fig. 1.6). Therefore, among the known planetary systems, transformation of MgSiO3 post-perovskite into post-PPV phases possibly occurs in interior of big super Earths (>7M⊕) belonging to GJ876d (Rivera et al. 2005), while in the other systems, like CoRoT-7 (Queloz et al. 2009) and Kepler-10b (Batalha et al. 2011), postperovskite would rather represent a major constituent of the silicate mantle down to the CMB. 28 © 2016 Tous droits réservés.. lilliad.univ-lille.fr.
(29) Thèse de Alexandra M. Goryaeva, Lille 1, 2016. Post-Perovskite. Chapter 1. 1.4 Elasticity of silicate post-perovskite The orthorhombic symmetry of post-perovskite results in the elastic stiffness tensor containing nine independent Cij coefficients:. (1.1) [. ]. Experimental measurements of elastic properties at P-T conditions relevant to the CMB are extremely challenging to perform and up to now there are no reports of elastic coefficients determined experimentally for the post-perovskite silicate phase. As an alternative to laboratory approach, several theoretical studies based on the first-principles simulations (Iitaka et al. 2004; Tsuchiya et al. 2004b, Oganov and Ono 2004; Liu et al. 2012) provide us some insights into athermal anisotropic elasticity of MgSiO3 postperovskite1. Generally, all elastic moduli computed for the post-perovskite with LDA (Tsuchiya et al. 2004b, Iitaka et al. 2004; Caracas and Cohen 2005) are somewhat higher than those estimated using GGA (Oganov and Ono 2004; Carrez et al. 2007; Liu et al.. Fig. 1.8 Athermal elastic constants of MgSiO3 post-perovskite computed from the first principles. Solid lines correspond to LDA simulations by Tsuchiya et al. (2004b); dotted lines – to GGA by Liu et al. (2012). 1. Table with athermal elastic constants computed from the first principles at 120GPa is provided in Chapter 2. 29 © 2016 Tous droits réservés.. lilliad.univ-lille.fr.
(30) Thèse de Alexandra M. Goryaeva, Lille 1, 2016. Chapter 1. Post-Perovskite. 2012). Depending on the chosen exchange correlation functional (LDA or GGA), C66, C12, C13 and C23 differ within 15%, while other elastic coefficients Cij are in a good agreement (Fig.1.8). Much lower values of the C22 coefficient compared to C11 and C33 (Fig. 1.9) indicate that the post-perovskite is much more compressible along the b –axis, normal to the structural layering (Fig. 1.1), than along the a and c-axis. Studies of MgSiO3 post-perovskite thermoelasticity based on the quasiharmonic approximation (QHA) (Wentzcovitch et al. 2006) and density functional molecular dynamics (DFT-MD) (Stackhouse and Brodholt 2007, Zhang et al. 2016) demonstrate that all elastic moduli are two orders of magnitude more sensitive to the changes in pressure (i.e. dCij/dP) than to the changes in temperature (dCij/dT). Recent ab initio simulations by (Zhang et al. 2016) in a wide range of pressures and temperatures indicate that incorporation of up to 20-25% of Fe2+, Fe3+ and Al3+ into silicate post-perovskite at T = 2000 K and P = 120 GPa, close to that expected at the CMB, will result in an overall decrease of elastic moduli up to 10% without changing the intrinsic anisotropic character of the post-perovskite elasticity.. 1.5 Plastic deformation of MgSiO3 post-perovskite and its structural analogues Seismic anisotropy of post-perovskite is not only linked to anisotropic elasticity resulting from the distinct layered structure. Seismological properties of crystalline aggregates depend also strongly on the development of crystal preferred orientation (CPO) mostly produced by dislocation creep. So far, the concept of easy slip system in the postperovskite is poorly understood. Silicate PPV is only stable at very high P-T conditions and cannot be quenched to ambient pressure. Therefore, high-pressure experiments are limited to in situ XRD measurements of textures, from which one can only assume easy slip systems. Even though, the textures observed experimentally for MgSiO3 and its close Ge-analogues lead to conflicting results (see Table 1.1). Thus, LHDAC experiments performed by Merkel et al. (2006, 2007) suggest a slip in (110) or/and (100), which seems to be consistent with theoretically predicted <110>{110} by Oganov et al. (2005).. 30 © 2016 Tous droits réservés.. lilliad.univ-lille.fr.
(31) Thèse de Alexandra M. Goryaeva, Lille 1, 2016. Post-Perovskite. Chapter 1 Table 1.1. Slip systems of MgSiO3 post-perovskite and its structural analogues from high-pressure experiments and theoretical studies Composition. Slip System. Method. Reference. (100) / {110}. LHDAC. Merkel et al. 2007. (001). LHDAC. Miyagi et al. 2010. [1̅ 10](110). ab initio metadynamics. Oganov et al. 2005. [100](010) [001](010). ab initio GSF & PN model. Carrez et al. 2007a,b. [001](010). ab initio PN model, VPSC. Metsue et al. 2009. [100](001). ab initio GSF. Metsue and Tsuchiya 2013. (100) / {110}. LHDAC. Merkel et al. 2006. (100) – transf. Opx (001) – deform.. LHDAC. Okada et al. 2010. (100) – transf. Opx (001) – deform.. LHDAC. Miyagi et al. 2011. [1̅ 10](110) / (001) [010](001). LHDAC In-situ 3D XRD. Nisr et al. 2012. [100](001). ab initio PN model VPSC. Metsue et al. 2009. MnGeO3. (001). LHDAC. Hirose et al. 2010. CaPtO3. [100](010). D-DIA, TEM. McCormack et al. 2011. (Mg, Fe)SiO3. MgGeO3. 31 © 2016 Tous droits réservés.. lilliad.univ-lille.fr.
(32) Thèse de Alexandra M. Goryaeva, Lille 1, 2016. Chapter 1. Post-Perovskite Table 1.1 continued. CaIrO3. [100](010) [u0w](010). Cubic anvil apparatus, TEM. Miyajima et al. 2006. [100](010) [001](010). D-DIA, TEM. Miyajima and Walte 2009. [100](010) [001](010) {110} twins. LHDAC, TEM. Miyajima et al. 2010. [100](010). D-DIA, TEM. Walte et al. 2007. (100) – transf. PV (010) – deformation. D-DIA, SEM-EBSD. Walte et al. 2009. (010). DAC, In-situ XRD. Niwa et al. 2007. (010) {110} twins. DAC, TEM. Niwa et al. 2012. [100](010). Kawai-type apparatus, SEMEBSD. Yamazaki et al. 2006. [100](010). D-DIA, In-situ XRD. Miyagi et al. 2008. [100](010). D-DIA, In-situ XRD, SEM-EBSD. Hunt et al. 2016. [001](010). ab initio PN model, VPSC. Metsue et al. 2009. However, during similar experiments by Miyagi et at. (2010, 2011), a strong development of (001) textures is observed. At the same time, Nisr et al. (2012) reports appearance of both (110) and (001) in MgGeO3. Under similar conditions, MnGeO3 (Hirose et al. 2010) produces textures consistent with slip in (001). Further experimental studies by Miyagi et al. (2011), Okada et al. (2010) and Walte et al. (2009) suggest that slip in (100) plane, similar to that observed by Merkel et al. (2006, 2007) can be rather classified as a transformation texture (from orthopyroxene), while (001) is likely produced during 32 © 2016 Tous droits réservés.. lilliad.univ-lille.fr.
(33) Thèse de Alexandra M. Goryaeva, Lille 1, 2016. Post-Perovskite. Chapter 1. deformation of PPV phase. Dominant (001) slip in MgSiO3 and MgGeO3 is consistent with the results from ab initio simulations of generalized stacking faults (GSF) by Metsue et al. (2013). This theoretical study also indicates that incorporation of Fe2+ decreases the strength of all slip systems without changing the general character of plastic anisotropy. Another numerical modeling based on the Peierls-Nabarro (PN) model (Peierls, 1940; Nabarro 1947) performed for MgSiO3 by Carrez et al. (2007a,b) and Metsue et al. (2009), rather emphasizes the importance of dislocation glide in (010) parallel to the structural layering. Alternatively to silicate and germanate compositions, use of analogue materials stable at ambient pressures allows direct TEM analysis of recovered samples. Therefore, not surprisingly, CaIrO3 appears to be very attractive to perform well-controlled deformation experiments (see Table 1.1). In contrast to high-pressure MgSiO3 and MgGeO3 phases, both experimental and theoretical studies of CaIrO3 consistently report the presence of [100](010) and [001](010) dislocations and (010) textures, independently from the applied deformation and analytical techniques (see Table 1.1). It‟s also interesting to note, that appearance of {110} twin domains in CaIrO3 is systematically reported only during DAC experiments (Miyajima et al. 2010, Nawa et al. 2012). This implies that the observed {110} textures in MgSiO3 and MgGeO3 (Merkel et al. 2006, 2007) might not represent a transformation texture as suggested by Miyagi et al. (2011) and Okada et al. (2010), but instead could result from deformation through twinning due to high stress and strain rates produced by DAC. However, before direct extrapolation of plastic behavior inferred for analogue materials into silicate compound, one should take into account that in terms of bonding (Hustoft et al. 2008, Metsue et al. 2009; Tsuchiya and Tsuchiya 2007), characteristics of CaIrO3 differ from those in MgSiO3 and MgGeO3 (Kubo et al. 2008; Hustoft et al. 2008). First-principles studies also indicate that anisotropic elasticity (Tsuchiya and Tsuchiya 2007) and plasticity (Metsue et al. 2009) in CaIrO3 are not the same as in silicate postperovskite. Even so, being very close in terms of bond strength to MgGeO3 and not to CaIrO3, MgSiO3 may produce [001](010) CPO, remarkably similar to that in CaIrO3, and different from the expected [100](001) texture in germanates (Metsue et al. 2009). Summarizing the available experimental and theoretical results (see Table 1.1), we are clearly far from understanding plasticity of both monocrystalline and polycrystalline 33 © 2016 Tous droits réservés.. lilliad.univ-lille.fr.
(34) Thèse de Alexandra M. Goryaeva, Lille 1, 2016. Chapter 1. Post-Perovskite. silicate post-perovskite. The only clear answer is provided for the low-pressure analogue CaIrO3. However, there is still no plausible definition of good isostructural analogues of MgSiO3 post-perovskite, accounting for bond strength contrast controlling plastic anisotropy in monocrystalline material. This implies that experimental observations and theoretical predictions made for PPV low pressure analogues can not necessarily address rheology of the lowermost mantle.. 34 © 2016 Tous droits réservés.. lilliad.univ-lille.fr.
(35) Thèse de Alexandra M. Goryaeva, Lille 1, 2016. CHAPTER 2 Models and Methods. Within the last forty years, atomic scale modeling has become a powerful tool for modeling physical properties of a wide range of materials. Theoretical modeling is especially valuable when performing well-controlled experiments at relevant P-T conditions, strain rates etc. is extremely challenging or simply impossible. The aim of this chapter is to describe the basic physical models of the two commonly used simulation techniques, employed in this work: ab initio atomic-scale calculations within the density functional theory (DFT) framework; and atomistic simulations based on classical interatomic potentials. The chapter also provides an outline of the technical methods used in this study for modeling planar and linear defects, including explicit description of the simulation cells geometries and of the computational setup used for modeling defects at the atomic scale.. © 2016 Tous droits réservés.. lilliad.univ-lille.fr.
(36) Thèse de Alexandra M. Goryaeva, Lille 1, 2016. Chapter 2. Models & Methods. 2.1 Atomic scale modeling: methodology and computational setup 2.1.1 Ab initio calculations Schrödinger equation The total energy E of a system which consist of N electrons at positions ri and M nuclei at positions Ri can be found by solving the (non relativistic and time independent) Schrödinger equation: Ĥ Ψ(r1, r2, …, rN, R1, R2, …, RM) = E Ψ(r1, r2, …, rN, R1, R2, …, RM),. (2.1). where Ĥ is the Hamiltonian operator and Ψ is the wave function. The Hamiltonian Ĥ can be defined as combination of kinetic energy operator T and potential energy operator V: Ĥ =Te + TN + Vee + VNN + VeN ,. (2.2). where Te and TN correspond to the kinetic energy of electrons and nuclei; Vee , VNN , VeN to the interaction energy between the electrons, the nuclei, and between electrons and nuclei, respectively. Despite the apparent simplicity of the Hamiltonian (2.2), solving the Schrödinger equation (2.1) is very difficult because of large 3N number of electronic coordinates. For an atomic system containing more than two electrons, it‟s impossible to obtain the exact wave function Ψ by solving the Schrödinger equation (2.1) without introducing some approximations. Born-Oppenheimer approximation The first basic assumption is known as Born-Oppenheimer or adiabatic approximation. It relies on the fact that electrons are much lighter than nuclei and, therefore, are characterized by higher velocities. Consequently, the kinetic energy of the nuclei are negligible with respect to those of electrons: Te >> TN ; thus, the TN term can be neglected. Low mobility of nuclei allows assuming them stationary positioned and considering only electrons to behave as quantum particles, therefore, the interaction energy VNN has a constant value ENN, which does not play a role in solving the Schrödinger equation. Based on all these assumptions, the Hamiltonian (2.2) reduces to: Ĥ = Te + Vee + ENN + VeN .. (2.3). 36 © 2016 Tous droits réservés.. lilliad.univ-lille.fr.
(37) Thèse de Alexandra M. Goryaeva, Lille 1, 2016. Models & Methods. Chapter 2. The many electron Schrödinger equation can be further simplified while considering N single electron Schrödinger like equations, where each electron experiences an effective field of other electrons. At this point, the problem becomes one of finding suitable ways to define the effective electron interactions, and to describe the total wave function from the N single electron wave functions ψi with energy ϵi. Density functional theory The framework of density functional theory (DFT) was built by Hohenburg and Kohn (1964) based on two theorems: (i) that the external potential of a system of electrons is a unique functional of the electron density, and (ii) that the ground state and energy of the system is variational with respect to electron density. The energy of such a system can be written as: ∫. where both the external potential Vext and the “universal” functional F are functions of the electron density ρ(r). The effective single electron approach, suggested by Kohn and Sham (1965), defines the total electron density as a sum over one-electron wavefunctions describing single non-interacting electrons moving in the mean field of other electrons. The electron density ρ at a given point r corresponds then to the sum of the probability of finding an electron from any of one-electron orbitals at that point. The functional F, contributing to the total energy E (eq. 2.4) of the system can be decomposed into three parts:. where Ts is a kinetic energy of an isolated electron; EH – Coulomb interaction between the electronic density states related to positions r and r‘; and Eex – the exchange correlation functional. The EH term can be defined as: ∫. |. |. There is no general exact expression for the exchange-correlation functional Eex in terms of the electronic density ρ(r). The Eex term is commonly defined by approximations described 37 © 2016 Tous droits réservés.. lilliad.univ-lille.fr.
(38) Thèse de Alexandra M. Goryaeva, Lille 1, 2016. Chapter 2. Models & Methods. in the next section. To compute the energy E[ρ(r)] of the system, each one-electron equation should rely on the solutions of all the other equations, therefore, they all are solved together using a self-consistent approach.. Approximations for the exchange-correlation functional Approximating the exchange-correlation functional is the only inaccuracy in DFT that does not arise from its numerical implementation. The Local Density Approximation (LDA) introduced by Kohn and Sham (1965) represents a very simple and accurate approximation. Within the LDA approach, the energy arising from exchange and correlation at a point r of electron density ρ is equal to the exchange and correlation energy in a system of electrons with uniform density ρ: ∫. where ϵex is the energy of exchange and correlation of a uniform electron gas which can be accurately defined by quantum Monte Carlo methods. The LDA functional was parameterized by Perdew and co-workers (Perdew and Zunger 1981; Perdew and Wang 1992). The use of LDA for condensed matter is known to lead to over binding (total binding energy is too high) and to somewhat underestimated bond lengths. Consequently, elastic moduli computed with LDA can be expected to be somewhat overestimated (e.g. Fig. 1.8 and Table 2.2). An effective refinement to LDA is to include a dependence on the local density gradient. in the exchange correlation functional. This approach is known as the. Generalized Gradient Approximation (GGA) and can be defined as: ∫. In this equation, the functional. , accounting for the local density gradient. ,. can be calculated in several ways. Common GGA parameterizations include PW91 (Wang and Perdew 1992) and PBE (Perdew et at. 1996). Compared to LDA, GGA formalism often leads to slight under binding, i.e. to energies that are lower and bonds that are longer.. 38 © 2016 Tous droits réservés.. lilliad.univ-lille.fr.
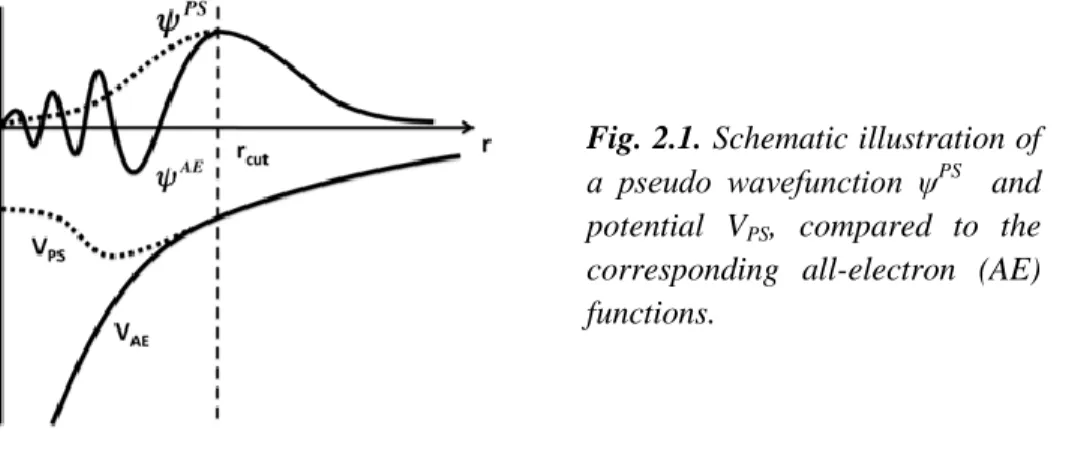
(39) Thèse de Alexandra M. Goryaeva, Lille 1, 2016. Models & Methods. Chapter 2. Plane waves and pseudopotentials In practice, performing DFT simulations requires introducing some additional “machinery” making it efficient. In periodic solids, the most common approach is using the concept of plane waves and pseudopotentials. A plane wave basis set is established to represent the one-electron Kohn-Sham orbitals. The wave functions of the latter have the same periodicity as the crystal lattice (Bloch‟s theorem), which is essential for describing 3D periodic boundary conditions of the system, making it infinite. Representing the periodic wave functions (Bloch waves) in reciprocal space allows studying a single unit cell while sampling the one-electron wave functions with k-points over the first Brillouin zone (primitive cell of the reciprocal crystal lattice). In principle, this sampling should be infinite, however, practically, it‟s not possible and, therefore, restricted to a finite number of k-points (dependent on the size of the system), sufficient to reach a reasonable convergence for the total energy of the system.. Fig. 2.1. Schematic illustration of a pseudo wavefunction ψPS and potential VPS, compared to the corresponding all-electron (AE) functions.. The wavefunctions are characterized by the largest curvature close to the cores of atoms, therefore their explicit description in this region is computationally expensive. To reduce this effect, pseudopotentials are introduced to replace the potential energy of the interactions between the core and valence electrons which mainly determines the material properties. The core (effective ion) region is defined as the nucleus plus the inner atomic electrons and can be restricted to the zone with r < rcut. Outside the core, i.e. in the region where r > rcut, the pseudopotential wavefunction ψPS and potential VPS matches the corresponding all-electron curvatures ψAE and VAE (Fig. 2.1). The most accurate approximation to handle the interactions between the nuclei and the electrons is projector 39 © 2016 Tous droits réservés.. lilliad.univ-lille.fr.
(40) Thèse de Alexandra M. Goryaeva, Lille 1, 2016. Chapter 2. Models & Methods. augmented wave (PAW) method developed by Blöchl (1994). It allows accounting for the orbitals of inner electrons (i.e. within the core) by using a linear transformation of the all electron wavefunctions into a pseudo wavefunction in the region r < rcut. Other commonly used pseudopotentials, known as ultrasoft (US), are based on a generalized eigenvalue formalism (Vanderbilt 1990) and just smoothen the pseudo wavefunctions of the core. The US-potentials are therefore less accurate than PAW and the least time consuming. To define the number of plane waves needed to accurately describe the atomic system, the corresponding energy cutoff Ecut should be introduced.. Computational setup for modeling defects in MgSiO3 PPV with VASP In this work, ab initio calculations are performed based on the density-functional theory (DFT) within the generalized gradient approximation (GGA), with PW91 parameterisation as derived by Perdew and Wang (1992), and the all-electron projector augment-wave (PAW) method as implemented in the VASP code (Kresse and Furthmüller 1996; Blöchl 1994). The outmost core radius for Mg, Si and O are 2.0, 1.9 and 1.52 au, respectively. To achieve computational convergence, a plane-wave cutoff Ecut of 600 eV is applied. The first Brillouin zone is sampled using the Monkhorst-Pack scheme (Monkhorst and Pack 1976) with 8 × 6 × 1 k-point grid to compute generalized planar fault energy (GPFE) for <110>{110} system in atomic arrays containing 180 atoms; with 10 × 1 × 1 for 1b dipole simulation cells containing 360 atoms (employed for modelling [100] screw dislocations); and with 4 × 1 × 1 grid for the 2b dipole cells containing 720 atoms (employed for calculating line tension Г of [100] screw dislocations). The convergence energy is 10-3 meV/atom. Simulations are performed at a constant volume, corresponding to the bulk volume at 120 GPa.. 2.1.2 Pairwise potential modeling Atomic scale modeling from the first principles, relying on solving the Schrödinger equation, is a very accurate and, therefore, computationally expensive method. As such it is restricted to systems containing few hundred of atoms. This limitation often hampers using ab initio methods for direct atomic-scale modeling of dislocation cores in complex 40 © 2016 Tous droits réservés.. lilliad.univ-lille.fr.
Figure


+7
![Fig. 2.11. (a) Right panel: post-perovskite atomic array containing a quadrupole of [100] screw dislocations](https://thumb-eu.123doks.com/thumbv2/123doknet/3711703.110543/55.918.144.774.141.920/right-panel-perovskite-atomic-array-containing-quadrupole-dislocations.webp)

 z 100 = 0.25 12 Mg-O, 8 Si-O 13.56 13.23 95.2 GGA111.66 9.01 107.1 LDA 2 11.35 7.35 119.0 [001](010) z 010 = 0.55 6 Si-O 11.69 6.18 113.0 z010= 0.4 2 Mg-O, 4 Si-O 18.32 12.42 173.8 z 010 = 0.7 8 Mg-O 6.29 3](https://thumb-eu.123doks.com/thumbv2/123doknet/3711703.110543/73.918.127.794.161.990/table-continued-gga-lda-si-mg-si-mg.webp)
![Fig. 4.1. DD maps of [100] screw dislocations viewed along the Burgers vector direction](https://thumb-eu.123doks.com/thumbv2/123doknet/3711703.110543/78.918.158.774.701.942/fig-maps-screw-dislocations-viewed-burgers-vector-direction.webp)
Documents relatifs