HAL Id: hal-02433886
https://hal.archives-ouvertes.fr/hal-02433886
Submitted on 9 Jan 2020
HAL is a multi-disciplinary open access
archive for the deposit and dissemination of
sci-entific research documents, whether they are
pub-lished or not. The documents may come from
teaching and research institutions in France or
abroad, or from public or private research centers.
L’archive ouverte pluridisciplinaire HAL, est
destinée au dépôt et à la diffusion de documents
scientifiques de niveau recherche, publiés ou non,
émanant des établissements d’enseignement et de
recherche français ou étrangers, des laboratoires
publics ou privés.
Experimental and numerical investigation of PWR Tube
Support Plate (TSP) clogging formation mechanisms
G. Yang, V. Pointeau, E. Tevissen, A. Chagnes
To cite this version:
G. Yang, V. Pointeau, E. Tevissen, A. Chagnes. Experimental and numerical investigation of PWR
Tube Support Plate (TSP) clogging formation mechanisms. NURETH-17, Sep 2017, Xi’An, China.
�hal-02433886�
Experimental and numerical investigation of PWR Tube Support Plate (TSP)
clogging formation mechanisms
Guangze YANGa, Véronique POINTEAUa, Etienne TEVISSENa and Alexandre CHAGNESb a CEA Cadarache, Saint Paul lez Durance 13115, France
b University of Lorraine, GeoRessources Lab, UMR CNRS 7359, 2 Rue Doyen Marcel Roubault, TSA
70605, 54518 Vandoeuvre Les Nancy, France
guangze.yang@cea.fr; veronique.pointeau@cea.fr; Etienne.tevissen@cea.fr; alexandre.chagnes@univ-lorraine.fr
ABSTRACT
Corrosion product deposits in the secondary side of PWR Steam Generators (SG) may result in Tube Support Plate (TSP) clogging majorly composed of magnetite (Fe3O4), which can lead to heavy
consequences for nuclear reactor operation and safety issues such as primary-to-secondary leaks. It appears that TSP clogging is mainly driven by magnetite particle deposition and iron precipitation, which can be strengthened by flashing and electrokinetics mechanisms under the specific TSP geometric configuration. TSP clogging formation involves thus complex thermohydraulic, physical and chemical processes while the contribution of each phenomenon and the influence of operating conditions such as secondary fluid velocity, pH and temperature on TSP clogging are still unheralded. COLENTEC two-phase flow loop tests in 2015 provided the first representative experimental results of TSP clogging build-up and showed deposit growth rate in accordance with French power plant feedbacks. Numerical calculations showed the electrokinetics may play a predominant role in TSP clogging formation whereas no significant contribution of magnetite particle deposition occurs provided that the size of magnetite particles is close to 1 µm and the total iron concentration is less than 1 ppm.
KEYWORDS
Precipitation; Magnetite deposition; Electrokinetics; Two-phase test loop experiences; Modelling studies
1. INTRODUCTION
Électricité de France (EDF) nowadays operates 58 Pressurized Water Reactors (PWR) that produce more than sixty-three thousand megawatts of installed power capacity and more than 85% of electricity in France. Safety and performance of these reactors are crucial targets to ensure electrical supply to the whole national territory. Steam generators (SG) play a crucial role as a heat exchanger from the primary to the secondary flow and as one of the three safety barriers. The steam generators in PWRs are shell-and-tube heat exchangers that use the heat from the primary reactor coolant to make steam drive turbine generators. Fig. 1 presents a cross-section of a simplified PWR recirculating steam generator. In this design, the tube bundle consists of 3000-6000 individual tubes, each welded inserted to a thick plate with a hole for each tube, which is called tube support plate (TSP).
Code de champ modifié Code de champ modifié Code de champ modifié Code de champ modifié
Figure 1. PWR recirculating steam generator [1]
In the early 1990’s, SG water oscillations were observed at Surry Power Units 1 and 2 in Virginia, at Kori Units 3 and 4 and Yongwang Units 1 and 2 in Korea [2,3]. This phenomenon was caused by a severe deposit build-up in the TSP quatrefoil-shaped holes. Likewise, EDF Nuclear Power Plants (NPPs) have been recently affected by the same phenomenon. Between 2004 and 2006, three primary-to-secondary leaks occurred in NPP located in Cruas (France). In-situ investigations showed that the flow holes of the uppermost TSP (8th TSP in SG 51B) were partially or completely clogged by corrosion products [4,5]
(Fig. 2). This phenomenon, so-called TSP clogging or TSP blockage, was considered potentially generic for EDF NPPs.
(a) (b)
Figure 2. Photo of TSP clogging: (a): top view of a « clean » flow hole; (b) Full clogged flow hole [1]
TSP clogging can induce high velocity zones and transverse velocities in the secondary flow, which can imply flow induced vibrations, tube cracks and leaks in some cases as it was observed in the NPP located in Cruas (France). TSP clogging phenomena can also decrease the recirculation ratio of the steam generator. In other words, the secondary side effective flow of water available for cooling is decreased. Thus, TSP clogging phenomenon in nuclear steam generators may lead to dramatic consequences for NPP operation as well as safety issues [5]. The chemical cleaning is nowadays the main effective method to
remove most of the deposits in steam generators. Nevertheless, it remains costly, difficult to perform and may damage certain parts of the steam generators due to the corrosive properties of the chemical cleaning solution [6]. Therefore, there is a great interest in investigating it appears of great interest to investigate
alternative solutions to avoid TSP clogging. For this aim, it is obviously mandatorynecessary to understand the phenomena responsible for TSP clogging. In this context, an extensive research program was engaged in 2008 by EDF [4,5]. In particular, this program pays attention to understand thoroughly TSP clogging by investigating the driving mechanisms and the role of local thermohydraulic and chemical parameters.
After summarizing the main phenomena involved in TSP clogging formation, a comparison of the deposit build-up observed during our representative two-phase flow experiments under high temperature and high pressure (COLENTEC tests) with EDF NPP feedbacks is presented in the present paper. Furthermore, COLENTEC tests and modelling studies of different phenomena involved in deposit formation as well as the effect of total iron concentration on the contribution of each phenomenon are discussed.
2. Literature review of TSP clogging formation
In this section, a general EDF NPP feedback analysis is presented and expected phenomena involved in TSP clogging formation are explained.
2.1. EDF NPP feedback analysis
In 2008, EDF published a report on TSP clogging assessment results for 900 MW NPPs equipped with 51B or 51BI SG [4]. It was indicated that the deposit thickness of TSP clogging can reach up to about 3 mm after 15 to 20 years of NPP operation. TSP clogging has a lipping form at the inlet of flow holes. Rippling deposits set alongside the vertical TSP surface (Fig. 2b). TSP clogging was found more important on the hot leg than on the cold leg, at the top than at the bottom of steam generators. In SG 51B, TSP clogging was more important on the 8th TSP where the temperature reaches 277.2 °C, the
pressure is equal to 61.5 bars, the pH value measured after cooling to 25 °C (pH25 °C)is 9.2 and the void
fraction is equal to 85%. Mixed ferrites (Fe1-xδx)(Fe2-yφy)04 (δ and φ = Fe, Mn, Co, Ni, Cr…with x and y
closed to 0) were identified in TSP clogging. The NPP located in Cruas (France) exhibited the greatest TSP clogging level likely due to the low pH value in the SG generator of Cruas NPP. Indeed, the pH25 °C
was equal to 9.14 in Cruas NPP instead of 9.6 in other NPPs, which were not affected by TSP clogging. Therefore, EDF concluded that low pH values of the fluid in SG may influence dramatically TSP blockage. Oxidizing conditions were also considered as an aggravating factor. However, the impact of oxidizing conditions on TSP blockage may be lower than the impact of pH as oxidizing condition is responsible for the oxidation of magnetite into hematite which could be more difficult to re-entrain [1]. Likewise, impurities such as silicon and calcium may have a negative impact since these elements can play a role in deposit consolidation [1].
2.2. TSP clogging formation phenomenology
Yang et al. [1] made a complete review of the state of the art of TSP clogging formation mechanisms. Flow Accelerated Corrosion (FAC) of carbon steel components at the upstream of SG was identified as the major source term of TSP clogging formation, which provides magnetite particles and soluble Fe (II) ions flowing into SG. Particle deposition and soluble iron precipitation were thus supposed to be the two major mechanisms of TSP clogging formation.
2.2.1. Magnetite particle deposition
The main existing experimental studies in the literature of regarding particle deposition can be found in our previous paper [1]. Magnetite surface chemistry in SG high-temperature conditions was particularly discussed as it is mandatory to understand its interaction with TSP wall in order to predict its deposition. Results showed that the surface of magnetite particles and TSP are both negatively charged under typical SG thermohydraulic and chemical conditions (pH25 °C > 9 at about 270 °C), which indicates the low
probability of magnetite particles aggregation and deposition onto TSP surface from a physical-chemical point of view. However, TSP clogging phenomenon implies a specific geometry configuration and occurs in high void fraction and high turbulence two-phase flow conditions. Therefore, the physical-chemical phenomena may be less predominant and the particle deposition may become favoured [1].
The vena contracta model is believed to be the most suitable one to describe particle deposition in TSP clogging formation [1]. This model takes into account the specific TSP flow hole geometry and the high void fraction on the 8th TSP (85%). Rummens [7] considered in this model that particle deposition occurs
when a sudden contraction in the flow circulation is achieved in typical SG conditions. Considering that the particle deposition results exclusively from this vena contracta mechanism, the deposition thickness
ed (m) can be expressed as follows:
𝑒𝑒
𝑑𝑑(𝑡𝑡) =
𝜌𝜌𝑙𝑙𝐶𝐶𝑝𝑝𝜌𝜌𝐾𝐾𝑑𝑑𝑣𝑣,𝑝𝑝𝑡𝑡(1)
𝐾𝐾
𝑣𝑣,𝑝𝑝=
𝑎𝑎𝑣𝑣𝑘𝑘𝑣𝑣(𝜌𝜌𝑝𝑝−𝜌𝜌𝑙𝑙)𝐶𝐶𝑔𝑔𝑑𝑑𝑝𝑝2𝑈𝑈 𝑧𝑧,𝑚𝑚2
𝜇𝜇𝑙𝑙 (2)
where ρl, ρp and ρd (kg/m3) represent liquid density, particle density and the formed deposit density, respectively; Cp is the particle concentration (kg/kg); Kv,p is the deposition rate (m/s) as expressed in Eq. (2); av is an empirical dimensionless parameter, proposed to be 0.0008 by Prusek et al. [6]; Cg represents the mass fraction of vapour phase (kg/kg); dp is the particle size (m); Uz,m represents the vertical mixture velocity (m/s) and µl is the dynamic viscosity of fluid (kg/m/s).
kv (1/m) allows taking into account the specific TSP flow hole geometry, which indicates that this vena
contracta mechanism is a self-sustained phenomenon. Indeed, the flow contraction becomes more and
more important as the deposit grows and consequently, the particle deposition is more and more favoured. This parameter is modelled by the following expression:
𝑘𝑘
𝑣𝑣=
𝐿𝐿−[𝑅𝑅(1−𝜏𝜏𝑆𝑆 𝑐𝑐)](3) where L, R and S are characteristic values of the specific geometry of flow holes. They respectively represent half the distance between two consecutive tubes, the equivalent radius of a flow hole and its section, as shown in Fig. 3.
Figure 3. Top view of a pattern of a Tube Support Plate (secondary flow hole in white colour)
Parameter τc represents the TSP clogging rate which is a ratio between the flow blockage section to the total hole section. It is a dimensionless number and its value ranges between 0 and 1.
This vena contracta model shows that the higher the particle size, the particle concentration and the fluid kinetic energy are, the more the deposition rate increases. These equations will be used furtherly to model the particle deposition phenomenon and evaluate its contribution to global TSP clogging formation.
2.2.2. Soluble iron precipitation
The three basic steps during precipitation are: attainment of supersaturation attainment, formation of
nuclei formation and crystal growth of crystals. In the present paper, only two specific precipitation mechanisms, i.e. flashing and electrokinetics, will be presented in the light of the specific TSP flow hole geometry and thermohydraulic conditions in order to model the precipitation phenomenon in TSP clogging formation.
2.2.2.1. Flashing
This phenomenon is attributed to the sudden decrease in pressure which is created at the inlet of TSP flow holes due to the presence of the sharp contraction. This pressure reduction can be related to a liquid enthalpy reduction ΔHl (J/kg) which may induce a local change from liquid to steam. Due to the vaporization, the mass fraction of soluble species in liquid locally increases as they cannot be transported by the steam. If the concentration reaches the solubility, a local precipitation occurs. This so called “flashing” precipitation may act as a deposit cementing agent and strengthens a preliminary particle deposit.
The mass flux of soluble species precipitation 𝜙𝜙Rs per unit area (kg/s/m
2)can be expressed by using Eq. (4)
proposed by Prusek [5] when all the soluble species precipitate:
𝜙𝜙
𝑠𝑠=
𝜙𝜙𝑙𝑙𝛥𝛥𝛥𝛥𝑙𝑙𝑆𝑆𝛥𝛥𝑙𝑙𝑔𝑔
(4)
where 𝜙𝜙Rl represents the mass flux of liquid per unit area (kg/s/m
2), which can be obtained by multiplying
liquid density ρl (kg/m3) by liquid phase velocity Uz,l (m/s); S represents the solubility of soluble species (kg/kg); and Hlg is the heat of vaporisation of liquid (J/kg).
The liquid enthalpy reduction depends on the TSP clogging rate (𝜏𝜏𝑐𝑐) and the liquid phase velocity at the inlet of TSP (Uz,l):
𝛥𝛥𝛥𝛥𝑙𝑙= 𝜆𝜆(𝜏𝜏𝑐𝑐)𝑈𝑈𝑧𝑧,𝑙𝑙2 (5)
where the dimensionless parameter λ is supposed to be 7.97 when τc = 0 [5]. Two other λ values of about 18 and 76 were proposed respectively with τc = 0.44 and 0.72 by Prusek et al. [8]. The exact values are
not indicated. The flashing mechanism shows thus a strong dependence onto TSP clogging rate and especially the secondary fluid velocity, which determine the magnitude of the pressure drop, so the liquid enthalpy reduction.
2.2.2.2. Electrokinetics
Electrokinetics phenomenon occurs in the presence of a charge fluid or a charged surface as well as when the fluid velocity changes. Strong interactions occurring between the ions in fluid and charged surface gives rise to a region called the Electrical Double Layer (EDL)[1]. In order for the interface to remain neutral the charge held onto the solid is balanced by the redistribution of ions of opposite charge in solution close to the solid. When a differential pressure applies to the ionic fluid, inducing a velocity in the fluid, a current named streaming current is generated by the motion of the excess charge in the EDL. Any change in streaming current in the direction of flow results in a current vector normal to the wall, named wall current, in order to satisfy electroneutrality. In the case of TSP blockage, both non-clogged and magnetite clogged TSP are charged negatively under SG conditionsas previously mentioned. Anodic reactions driven by wall currents, such as corrosion of iron and precipitation of magnetite, can then occur at the inlet of TSP, i.e. where the flow is accelerated.
Recently, Guillodo et al. [9] suggested deposition is initiated at the inlet of TSP by electrokinetic effects. In particular, they proposed that the formation of the initial deposit disturbs sufficiently the flow to form other flow singularities, resulting in a propagation of annular deposits along the length of the TSP (Fig. 4).
Figure 4. The proposed electrokinetic mechanism of deposit propagation along the annulus of a flow restriction [9]
This mechanism allows explaining the lipping form at the inlet of TSP and the annular rippled deposits along the length of TSP observed in NPPs. However, this phenomenon still remains poorly understood due to the lack of experimental or modelling investigations under typical SG conditions. Thus, its contribution in global TSP clogging formation cannot be directly calculated and will be estimated by means of specific hypothesises in the section 4 of this paper.
3. COLENTEC experiments: thermohydraulic and chemical representative TSP clogging build-up tests
Started in 2007, the COLENTEC project aims at providing deposit build-up data under thermohydraulic and chemical conditions throughout a dedicated facility, which is the COLENTEC two-phase flow test loop. In this section, a general description of COLENTEC facility and the results of tests performed with COLENTEC in 2015 will be presented.
3.1. General description of the experimental test loop
Schindler et al. [3] published a complete description of the COLENTEC test loop. This facility is composed of three thermodynamical loops that allow recreating the two-phase flow configuration in the secondary side of steam generators at the upper TSP level, particularly on the 8th TSP where the most TSP
clogging is observed (T = 277.2 °C, P = 61.5 bars, pH25 °C = 9.2 and void fraction = 85%). The primary
loop includes a boiler which is designed to provides water at 350 °C and 155 bars. This loop is connected to the secondary loop by another boiler and a 4-tubes steam generator mock-up (Fig. 5a), which consists of the test section of COLENTEC loop (Fig. 5b). This mock-up is geometrically representative of a TSP’s fraction containing 4 primary tubes. The TSP has been specifically designed to ensure the possibility of characterizing the deposit formation onto surfaces, by using movable test coupons [10]. The flow is then condensed through the condenser connected to an air cooler. The condensates container ensures a buffer volume. Finally, the measurements of chemical parameters are performed by the chemical and volume control system (Fig. 5a).
(a) (b)
Figure 5. (a): Schematic diagram of COLENTEC test loop [3,10]; (b): Photo of the test section
3.2. COLENTEC 2015 experimental conditions and obtained deposit build-up thicknesses
In 2015, the first COLENTEC test was conducted during 74 days. In addition of representative stainless steel test coupons, titanium samples were used in order to facilitate the deposit detection and thickness measurement. Indeed, iron detection with titanium test coupons in case of deposit formation would be indubitably related to a supply of iron species in the secondary fluid and not by the material corrosion [10]. To obtain the first information of TSP clogging build-up kinetics, two test steps of 11 days and 63 days were designed with partial test coupons’ replacement in the transition state. After the two-step test,
test coupons were characterized by Scanning Electronic Microscopy (SEM) and Transmission Electronic
Microscopy (TEM) in order to identify the composition of deposit layer, to observe the presence, the
morphology and distribution of deposits along the coupons and to measure the deposit thickness and its weight as a function of time and initial surface roughness. In the present paper, only the deposit thickness
on titanium samples formed after 11 days and 63 days will be presented after introducing the experimental operating conditions. These two sets of experimental data will be compared to EDF NPP feedback extrapolations. In particular, the calculated thickness obtained by applying different models will be compared with the experimental thickness.
3.2.1. COLENTEC 2015 experimental conditions
The test temperature was around 256 °C, i.e. lower than the nominal temperature on the 8th TSP
(277.2 °C). Table I compares the operating conditions of the present test (called COLENTEC 2015) with nominal operating conditions at the 8th TSP in NPP steam generators
Table I. Comparison of the operating conditions reached during the COLENTEC 2015 test and nominal operating condition at the 8th TSP in NPP steam generator [10]
COLENTEC 2015 operating conditions
Nominal operating conditions
Temperature (°C) 256.0 277.2
Pressure (bars) 45.1 61.5
Void fraction 90% 85%
Mixture velocity at the inlet of
TSP (m/s) 3.2 2.7
pH25°C 9.2 9.2
Total iron concentration (ppb) 30 30
The pH25 °C at 9.2 was obtained by adding morpholine and ammoniac in order to reach a pH that favours
TSP clogging formation as observed in the Cruas NPP. Total iron concentration of 30 ppb including soluble and particle species was added in the secondary circuit (this concentration does not take into account possible concentration phenomenon in steam generators [1]). The effect of super-concentration phenomenon will be discussed in detail in the present paper. The total iron super-concentration during the test was daily controlled and measured by UV spectrophotometer and ICP-MS. The calculated velocity of the mixture at the inlet of TSP under the COLENTEC operation conditions is equal to 3.2 m/s [10] (for a sake of comparison, this value is equal to 2.7 m/s in the EDF modelling tool [1]). The slight difference in temperature, pressure and void fraction between the COLENTEC 2015 test and the NPP steam generator at the 8th TSP is responsible for differences in the change in iron solubility (S), dynamic
viscosity of the liquid (µl), etc. (Table II).
Table II. Secondary-fluid parameter changes induced by the thermohydraulic difference between COLENTEC 2015 test and nominal operation (S: magnetite solubility; µl: dynamic viscosity of
liquid phase; ρl: density of liquid phase; Cg: mass fraction of vapour phase; Hlg: heat of
vaporization)
COLENTEC 2015 operating conditions (256 °C, 45.1 bars,
90%)
Nominal operating conditions (277.2 °C, 61.5 bars, 85%)
S (ppb) 8 6
µl (kg/m/s) 10x10-5 9.5x10⁻⁵
ρl (kg/m3) 790 755
Hlg (J/kg) 1.71x10⁶ 1.62x10⁶
The variation of the solubility as a function of temperature in the presence of morpholine and ammoniac was obtained from EPRI data (unpublished data). The secondary-water properties were calculated by using the SteamTab software [11].
3.2.2. COLENTEC 2015 deposit build-up thicknesses
Pointeau et al. [10] made a detailed description of formed deposit thickness measurements onto titanium test coupons and highlighted that the deposit thickness depends on the initial sample surface roughness and the different localizations of test coupons. In the present paper, two mean thickness values, i.e. 5 and 30 µm, are observed onto non-treated titanium surface after 11 and 63 days under COLENTEC 2015 operating conditions, respectively. These two values will be used to compare with calculated results in the section 4.
4. Comparison of thicknesses obtained by EDF NPP feedbacks, the COLENTEC 2015 test and modelling studies
As presented previously, the TSP clogging thickness obtained by EDF NPP feedbacks is around 3 mm after 15 years (5475 days) and the formed deposit thicknesses under COLENTEC 2015 operating conditions are 5 and 30 µm after 11 and 63 days, respectively. The deposit thicknesses by particle deposition, flashing and electrokinetics have been calculated using numerical models presented in the section 2.2, under both EDF nominal operating conditions and COLENTEC 2015 operating conditions. All calculated thicknesses have been compared to EDF feedbacks and experimental COLENTEC results in order to evaluate the contribution of each mechanism into the global TSP clogging formation. Finally, the effect of the possible super-concentration phenomenon in steam generators has been particularly discussed.studied.
4.1. General hypotheses used in modelling studies
Magnetite (Fe3O4) has been identified as the major component in TSP clogging from EDF NPP’s
feedbacks. In the following modelling studies, TSP clogging will be supposed to be the pure magnetite with a density of 5000 kg/m3, which is considered to be independent of temperature. To facilitate the
thickness calculation, the deposit porosity will not be taken into account. TSP clogging is supposed to be formed exclusively by magnetite deposition by vena contracta mechanism, flashing and electrokinetic phenomena. In all calculations, the deposit is supposed to be formed onto a non-clogged TSP, i.e. 𝜏𝜏𝑐𝑐 = 0. Magnetite particle size is fixed to 1 µm for particle deposition modelling, which is believed to have a good representability of real particle size dispersion in steam generators [1]. Regarding the secondary fluid velocity at the inlet of TSP, the mixture velocity is supposed to be equal to liquid phase velocity (Uz,m = Uz,l = 3.2 and 2.7, under COLENTEC 2015 operating conditions and EDF nominal operating
conditions, respectively). The deposit thicknesses deduced from EDF NPP’s feedbacks for 11 and 63 days and the thickness deduced from COLENTEC test for 15 years are obtained by linear extrapolation, supposing that TSP clogging grows linearly with time. The COLENTEC results seem consistent with this assumption.
4.2.1. Magnetite particle deposition
Eqs. (1)-(3) are used to calculate the deposit thickness exclusively formed by the vena contracta mechanism. The particle concentration Cp is calculated as the difference between the total iron concentration (30 ppb) and the magnetite solubility S (6 ppb in nominal operating conditions and 8 ppb in COLENTEC 2015 operating conditions). As presented in the previous section (4.1.), the deposit is supposed to have the same density as magnetite particles (ρp = ρd = 5000 kg/m3). The geometrical parameter kv was calculated in ref. [1] with 𝜏𝜏𝑐𝑐 = 0 and was found to be 371 m-1. av was proposed to be
0.0008 by the model. All other parameters can be found in Table I and II. The numerical results for 11 days, 63 days and 15 years under EDF nominal operating conditions and COLENTEC 2015 operating conditions are presented in Table III.
4.2.2. Flashing
Eqs. (4) and (5) allow calculating the deposit thickness exclusively formed by flashing mechanism. λ is fixed to 7.97 given that 𝜏𝜏𝑐𝑐 = 0. The calculation method and parameter values can be found in the section 2.2.2.1.and Table I, II, respectively. The results are presented in Table III.
4.2.3. Electrokinetics
No model exists nowadays to describe the electrokinetics phenomenon under typical SG conditions. In the present paper, the deposit thickness formed by electrokinetics is estimated by subtractingsubtracting
magnetite particle deposition and flashing from global TSP clogging formation (Table III).
Table III. Modelling of particle deposition, flashing and electrokinetic phenomena under COLENTEC 2015 operating conditions and EDF nominal operating conditions (total iron
concentration = 30 ppb; particle size: 1 µm)
COLENTEC 2015 operating conditions (256 °C, 45.1 bars, 90%)
Nominal operating conditions (277.2 °C, 61.5 bars, 85%) 11 days 63 days 15 years 11 days 63 days 15 years Particle deposition thickness (m) 8.5x10⁻⁸ 4.9x10⁻⁷ 4.2x10⁻⁵ 6.5x10⁻⁸ 3.7x10⁻⁷ 3.2x10⁻⁵ Flashing thickness (m) 9.41.5x10 -76 5.48.3x10-6 4.77.2x10-4 3.54.6x10-7 2.07x10⁻⁶ 1.72.3x10-4 Electrokinetics thickness (m) 4.50x10 -6 2.52x10⁻⁵ 2.11.9x10-3 5.65x10⁻⁶ 3.21x10⁻⁵ 2.87x10⁻³
The thickness resulting from electrokinetics after 11 days under COLENTEC 2015 operating conditions is equal to the subtraction of corresponding flashing thickness and particle deposition thickness:
9.41.5x10-76 and 8.5x10⁻⁸ m, respectively (see Table III), from the COLENTEC experimental result after
11 days: 5x10⁻⁶ m. The other electrokinetics thicknesses are estimated in the same way.
4.3. Discussions
Table III indicates that despite the differences of thermohydraulic parameters, the calculated deposit thicknesses for each mechanism are similar under COLENTEC 2015 operating conditions and EDF
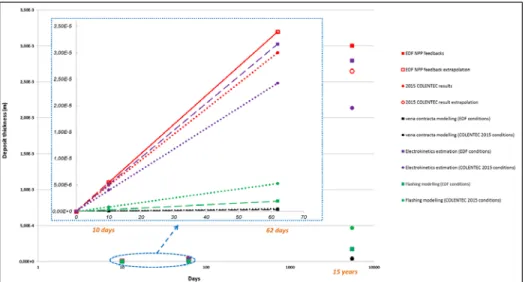
nominal operating conditions. The COLENTEC 2015 test can thus be considered representative of the phenomena involved during TSP clogging. Electrokinetics appears to be the predominant phenomenon of TSP clogging formation when total iron concentration is equal to 30 ppb. Fig. 6 shows a schematic comparison of deposit thicknesses from EDF NPP feedbacks, COLENTEC 2015 test and calculations.
Figure 6. Comparison of deposit thicknesses from EDF NPP’s feedbacks, 2015 COLENTEC test and numerical studies by considering different mechanisms (calculation performed with particle
size of 1 µm and total iron concentration of 30 ppb)
Fig. 6 shows electrokinetics phenomenon (purple points) predominates the TSP clogging formation while flashing (green points) has a secondary contribution and particle deposition (black points) appears negligible. This tendency is identical under both COLENTEC 2015 conditions (round points) and EDF nominal conditions (square points).
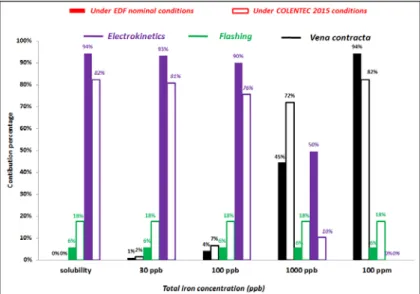
The contribution in percentage of each mechanism is calculated for several total iron concentrations including magnetite solubility, 100 ppb, 1000 ppb and 100 ppm in order to highlight the effect of the possible super-concentration phenomenon in steam generators (Figure 7). There is no information in the literature concerning the degree of super-concentration in SG. However, the selected total iron concentrations have been chosen so that calculations bring a good view of the contribution of the different mechanisms involved in TSP clogging. The other parameters are unchanged in these calculations.
Figure 7. Calculation of the contribution (in %) of vena contracta deposition (black), flashing (green) and electrokinetics (purple) on deposit formation at different total iron concentration under
EDF nominal operating conditions (filled) and COLENTEC 2015 operating conditions (unfilled (calculation performed by taking particle size of 1 µm)
Fig.7 shows that flashing mechanism is independent from the total iron concentration. Its contribution to global TSP clogging formation remains unchanged at 1827% and 68%, under COLENTEC 2015 operating conditions and EDF nominal operating conditions, respectively. The difference between COLENTEC 2015 operating conditions and nominal EDF operating conditions may arise from the difference in secondary fluid velocity (3.2 m/s vs. 2.7 m/s) as flashing is significantly dependent on fluid velocity (see section 2.2.2.1.). Electrokinetic phenomenon is the predominant mechanism when total iron concentration is below 1000 ppb, whereas the contribution of particle deposition appears negligible. This trend changes when total iron concentration reaches 1000 ppb. For this value, the particle deposition’s contribution is similar to electrokinetic mechanism (45% vs. 5048%) under nominal EDF operating conditions. At even higher total iron concentration, the particle deposition becomes to be the most important formation mechanism.
5. Conclusions
A general review of TSP clogging formation was presented which allows identifying three implicated mechanisms: particle deposition, flashing and electrokinetics. EDF NPP’s feedback provides a deposit thickness of around 3 mm after 15 years under nominal operating conditions. COLENTEC two-phase flow test loop is a dedicated facility, found to be a pertinent tool for reproducing TSP clogging phenomenon under representative SG conditions. Indeed, aA COLENTEC test was performed in 2015 under operating conditions close to EDF nominal operating. This test showed the thickness of deposit reaches 5 and 30 µm after 11 and 63 days, respectively. Calculations were then conducted by using existing particle deposition model and flashing model in order to estimate the level of contribution of each mechanism during to TSP clogging. It was stated that Eelectrokinetics appeared s to be the predominant
formation mechanism when total iron concentration in the secondary fluid is lower than 1000 ppb while particle deposition due to vena contracta becomes the most important mechanism at high total iron concentration (> 1000 ppb).
NOMENCLATURE
Abbreviations
EDF = Electricité de France PWR = Pressurized Water Reactors SG = Steam Generator
TSP = Tube Support Plate NPP = Nuclear Power Plant FAC = Flow Accelerated Corrosion EDL = Electrical Double Layer SEM = Scanning Electron Microscope TEM = Transmission Electron Microscope
ICP-MS = Inductively Coupled Plasma Mass Spectrometry
Roman symbols
ed = deposition thickness (m)
Cp = particle concentration (kg/kg)
Cg = mass fraction of vapour phase (kg/kg)
Hlg = heat of vaporization (J/kg)
ΔHl = enthalpy variation of liquid phase (J/kg)
S = solubility of soluble species (kg/kg) Tl = fluid temperature (K)
Uz,m = vertical mixture velocity (m/s)
Uz,l = vertical liquid velocity (m/s)
Kv,p = particle deposition rate in vena contracta mechanism (m/s)
av = dimensionless empirical parameter in vena contracta mechanism
kv = variable blockage rate (1/m)
L = half the distance between two consecutive tubes (m) R = flow hole equivalent radius (m)
S = flow hole section (m2)
t = time (s)
dp = particle diameter (m)
Greek letters
ρp/l/d = particle/fluid/deposit density (kg/m3)
μl = dynamic viscosity of fluid (kg/m/s)
𝜙𝜙Rl = mass flux of liquid per unit area (kg/s/m
2)
𝜙𝜙Rs = mass flux of soluble specie precipitation per unit area (kg/s/m
2)
τc = tube support plate clogging rate
λ = dimensionless parameter in flashing model
ACKNOWLEDGMENTS
We are grateful to COLENTEC team members: S. Bantiche, J.P. Descamps, I. Holveck, P. Marrand, J.C. Petronin, Y. Philibert and P. Schindler. We gratefully thank LARC laboratory of CEA Cadarache for providing ICP-MS analyses.
REFERENCES
1. G.Yang, V. Pointeau, E. Tevissen, A. Chagnes, “A review on clogging of recirculating steam generators in Pressurized-Water Reactors”, Prog Nucl Energ, 97, pp.182-196 (2017).
2. H.E.C. Rummens, J.T. Rogers, C.W. Turner, “The Thermal Hydraulics of Tube Support Fouling in Nuclear Steam Generators”, Nucl. Technol. 148, pp.268–286 (2004).
3. P. Schindler, E. Tevissen, V. Pointeau and A. Ungar, “COLENTEC: A new approach to investigate tube support plate clogging of Steam Generators”, Proceedings of 2012 Nuclear Plant Chemistry
Conference (NPC), Paris, France, 2012.
4. G. Corredera, M. Alves-Vieira and O. De Bouvier, “Fouling and TSP blockage of steam generators on EDF fleet: identified correlations with secondary water chemistry and planned remedies”,
Proceedings of 2008 International Conference on Water Chemistry of Nuclear Reactor Systems,
Berlin, Germany, 2008.
5. H. Bodineau, T. Sollier, Tube support plate clogging up of French PWR steam generators, Eurosafe Forum, Paris, France, 2008. http://inis.iaea.org/Search/search.aspx?orig_q=RN:44067716 (accessed January 4, 2016).
6. T. Prusek, “Modélisation et simulation numérique du colmatage à l’échelle du sous-canal dans les générateurs de vapeur”, PhD thesis, Aix-Marseille Université, 2012.
7. H.E.C. Rummens, “The thermohydraulics of Tube-Support Fouling in Nuclear Steam Generators ”, PhD thesis, Carleton University, 1999.
8. T. Prusek, E. Moleiro, F. Oukacine, A. Adobes, M. Jaeger, M. Grandotto, “Deposit models for tube support plate flow blockage in Steam Generators”, Nucl. Eng. Des. 262, pp. 418–428 (2013). 9. M. Guillodo, M. Foucault, N. Ryckelynck, F. Chahma, M. Guingo, C. Mansour, O. Alos-Ramos, G.
Corredera, “Experimental and numerical study of deposit formation in secondary side SG TSP by electrokinetic approach”, Proceedings of 2012 Nuclear Power Plant Chemistry Conference (NPC), Paris, France, 2012.
10. V. Pointeau, E. Tevissen, P. Schindler, G. Yang, A. Chagnes, J.L. Bretelle and S. Delaunay, “Synthesis and characterization of magnetite deposits on tube support plate in COLENTEC diphasic loop dedicated to the study of steam generator’s clogging”, Proceedings of 2016 Nuclear Plant Chemistry
Conference (NPC), Brighton, UK, 2016.
![Figure 2. Photo of TSP clogging: (a): top view of a « clean » flow hole; (b) Full clogged flow hole [1]](https://thumb-eu.123doks.com/thumbv2/123doknet/12994288.379586/3.918.137.558.628.806/figure-photo-tsp-clogging-view-clean-flow-clogged.webp)
![Figure 4. The proposed electrokinetic mechanism of deposit propagation along the annulus of a flow restriction [9]](https://thumb-eu.123doks.com/thumbv2/123doknet/12994288.379586/7.918.185.516.521.752/figure-proposed-electrokinetic-mechanism-deposit-propagation-annulus-restriction.webp)
![Figure 5. (a): Schematic diagram of COLENTEC test loop [3,10]; (b): Photo of the test section](https://thumb-eu.123doks.com/thumbv2/123doknet/12994288.379586/8.918.86.608.525.727/figure-schematic-diagram-colentec-test-loop-photo-section.webp)