Série Scientifique
Scientific Series
99s-31Decentralized or Collective
Bargaining in a
Strategy Experiment
Siegfried Berninghaus, Werner Güth,
CIRANO
Le CIRANO est un organisme sans but lucratif constitué en vertu de la Loi des compagnies du Québec. Le financement de son infrastructure et de ses activités de recherche provient des cotisations de ses organisations-membres, d=une subvention d=infrastructure du ministère de la Recherche, de la Science et de la Technologie, de même que des subventions et mandats obtenus par ses équipes de recherche.
CIRANO is a private non-profit organization incorporated under the Québec Companies Act. Its infrastructure and research activities are funded through fees paid by member organizations, an infrastructure grant from the Ministère de la Recherche, de la Science et de la Technologie, and grants and research mandates obtained by its research teams.
Les organisations-partenaires / The Partner Organizations
$École des Hautes Études Commerciales $École Polytechnique
$Université Concordia $Université de Montréal
$Université du Québec à Montréal $Université Laval
$Université McGill $MEQ
$MRST
$Alcan Aluminium Ltée $Banque Nationale du Canada $Bell Québec
$Développement des ressources humaines Canada (DRHC) $Egis
$Fédération des caisses populaires Desjardins de Montréal et de l=Ouest-du-Québec $Hydro-Québec
$Imasco
$Industrie Canada $Microcell Labs inc.
$Raymond Chabot Grant Thornton $Téléglobe Canada
$Ville de Montréal
© 1999 Siegfried Berninghaus, Werner Güth et Claudia Keser. Tous droits réservés. All rights reserved. Reproduction partielle permise avec citation du document source, incluant la notice ©.
Short sections may be quoted without explicit permission, provided that full credit, including © notice, is given to the source.
ISSN 1198-8177
Ce document est publié dans l=intention de rendre accessibles les résultats préliminaires de la recherche effectuée au CIRANO, afin de susciter des échanges et des suggestions. Les idées et les opinions émises sont sous l=unique responsabilité des auteurs, et ne représentent pas nécessairement les positions du CIRANO ou de ses partenaires.
This paper presents preliminary research carried out at CIRANO and aims at encouraging discussion and comment. The observations and viewpoints expressed are the sole responsibility of the authors. They do not necessarily represent positions of CIRANO or its partners.
Decentralized or Collective Bargaining
in a Strategy Experiment
*Siegfried Berninghaus
H, Werner Güth
I, Claudia Keser
'Résumé / Abstract
Nous présentons une expérience dans laquelle deux joueurs négocient avec un troisième joueur. Les deux joueurs peuvent négocier séparément ou former une coalition pour négocier collectivement avec le troisième. La solution théorique de référence prédit des négociations décentralisées, car seulement un des joueurs a intérêt à former une coalition. Les résultats de l'expérience montrent un nombre significatif de négociations collectives. Lorsque comparée à la négociation décentralisée, la négociation collective n'a pas d'effets significatifs sur les profits des joueurs de la coalition, mais réduit le profit du troisième.
We present an experiment where two players bargain with a third player. They can bargain either separately or form a joint venture to bargain collectively. Our theoretical benchmark solution predicts decentralized bargaining, as only one player has an interest in forming a joint venture. However, we observe a significant amount of collective bargaining. Collective bargaining, when compared with decentralized bargaining, has no significant effect on the payoffs of the players in the joint venture but reduces the payoff of the third player.
Mots Clés : Négociation, coalition, économie expérimentale, sélection d'équilibre
Keywords: Bargaining, joint venture, experimental economics, equilibrium selection
JEL: C78, C92
*
Corresponding Author: Claudia Keser, CIRANO, 2020 University Street 25th floor, Montréal, Qc, Canada H3A 2A5 Tel: (514) 985-4000 Fax: (514) 985-4039 email: [email protected] We are grateful to Timothy Cason for inspiring suggestions and to Claude Montmarquette for his helpful comments. We benefited from the remarks by participants of the Journées de Microéconomie Appliquée, Lyon, 1999. Financial support from the Deutsche Forschungsgemeinschaft, Sonderforschungsbereich 373, at the Humboldt University Berlin, and Sonderforschungsbereich 504, at the University of Mannheim, is gratefully acknowledged. Claudia Keser thanks the CIRANO and the Alexander von Humboldt Foundation (Feodor Lynen Research Fellowship) for their financial support.
1.
Introduction
One of the most basic decisions in human life is on whether to cooperate with others or to rely on one’s own efforts only. An extreme form of cooperation is the foundation of a joint venture or, in other words, the replacement of individual efforts by a common endeavor. We find such extreme forms of cooperation as merger in industry, trade unions, political parties, and many other social groups.
In this paper, we present an experiment in which we examine subjects' behavior in a situation where they may either opt for a joint venture and bargain collectively or bargain individually with a third party. Initiating and organizing a joint venture usually includes many different aspects. The parties involved have, for example, to decide on who does what. This is an aspect which we neglect in our experiment. We focus on the subjects' decisions for or against forming a joint venture in a situation with an asymmetry known to all and on their bargaining strategies with and without the joint venture. The specific purpose of the joint venture is to bargain with a third party on a contract.
In a previous study (Berninghaus et al. 1998) a simple model of this joint venture problem is introduced and both theoretically and experimentally investigated. There are two major results. First, the theoretical solution predicts collective bargaining for some parameter combinations, while it predicts decentralized bargaining for others. The experimental data, however, do not reveal the predicted tendencies. Second, the theoretical solution predicts that, due to a basic asymmetry, one of the potentially merging parties is stronger than the other. In some situations it is better for the stronger party to vote against collective bargaining, while for the weaker party it is always better to vote for collective bargaining. This finds expression in the experimental data in that the weaker party votes for centralization more often than the stronger party.
The model of Berninghaus et al. (1998), similarly to the game-theoretical study by Selten and Güth (1977), allows for only two possible contracts. This is a highly restrictive assumption which we abandon in the present study. In our experiments, many contracts are possible. Furthermore, in order to obtain a richer data set, we apply the strategy method of experimentation. We simultaneously ask all subjects to give entire strategies for playing the game. A strategy prescribes the bargaining decisions for both the case of collective and the case of decentralized bargaining in addition to the decision for or against forming the joint venture (by its potential partners).
The potentially merging parties could represent trade union representatives who decide on whether they bargain collectively or individually on wages with the employers' representative. The industrialized countries show large differences in wage bargaining structures. Wage bargaining can take place at several different levels. At the extreme case of decentralization (as, for example, in the United States and Canada), firms and employees negotiate over wages and working conditions at the level of the individual establishment. At the other extreme of centralized bargaining (as, for example, in the Scandinavian countries), national unions and employers' associations may bargain for the whole country. At the intermediate level (as, for
example, in Belgium, Germany, and the Netherlands), we may find sectoral, branch, or industry-level bargaining.
In the macroeconometric literature there is an on-going debate about the impact of the degree of centralization in wage bargaining on macroeconomic performance and, in particular, the wage rates in a country (see OECD 1997 for a survey). Calmfors and Driffill (1988) argue that there is a hump-shaped relationship. On theoretical and empirical grounds, they come to the conclusion that both complete decentralization and complete centralization yield lower wage rates than intermediate situations. But their result could not be replicated by, for example, Fitzenberger (1995). Up to now, we have not encountered a satisfactory explanation of the impact of the degree of centralization in wage bargaining on wage formation. The empirical studies face severe measurement and methodological problems. Obviously, national wage bargaining systems show differences other than those in the degree of centralization which also need to be taken into account (see, for example, Traxler and Kittel 2001)
Our experiment may be considered an attempt to deal, in a somewhat abstract way, with some aspects of the relationship between the degree of centralization in wage bargaining and the wage rates. We focus on the question of which degree of centralization a trade union would actually prefer if it could choose among various degrees of centralization and how this choice affects the bargaining outcome. Our experiment is not designed, however, to test the hypothesis of a hump-shaped relationship. We compare the cases of complete decentralization and complete centralization; intermediate situations are not feasible with only two potentially merging parties. A theoretical model dealing with the centralization question has also been presented by Horn and Wolinsky (1988). Their model examines the centralization decision in an industry where a firm employs two types of workers. The focus of the model is on potential gains from forming a joint venture. Jun (1989) examines a similar model where the focus is on how the gains are allocated among the members of the joint venture. Both models resemble ours in having a two-stage structure where the two groups of workers decide in the first stage on whether or not to form a joint venture. In contrast to our model, however, the second stage of their game relies on a non-cooperative bargaining process similar to the one presented by Rubinstein (1982).
In the following Section 2 we introduce our model and analyze it (game-)theoretically. As in Berninghaus et al. (1998), we use the (cooperative) bargaining solution introduced by Nash (1950, 1953) to select a unique equilibrium. The experimental design, explained in Section 3, concentrates on a parameter constellation in which only one of the potentially merging parties should be interested in merging. In Section 4 we present a statistical analysis of the experimental data. Section 5 concludes the article with a discussion of the major results.
2.
The Model
In our experiments there are three players, X, Y, and Z. They can negotiate either in a decentralized way or collectively. In the case of decentralized bargaining, X negotiates with Z about the allocation of a "pie" PXZ = 97, and, independently, Y negotiates with Z about the
allocation of a "pie" PYZ = 97. In case of collective bargaining, X and Y first merge into XY who
then bargains with Z about the allocation of the total "pie" PXYZ = 194. Whatever XY earns is
equally divided between X and Y.
Let i and j be the two bargaining parties; i.e., (i, j) is either (X, Z) or (Y, Z) or (XY, Z). Like Berninghaus et al. (1998), we rely on a modified bargaining procedure of Nash (1950, 1953): Each of the two parties k = i, j chooses a demand Dk and a bottom line Bk with Pij≥ Dk≥ Bk ≥ Ck,
and where Ck (≥ 0) denotes the conflict payoff of party k.
Given the vector (Di , Bi , Dj , Bj) of bargaining choices and the size of the "pie" Pij, a demand agreement is reached if
Di + Dj ≤ Pij
whereas a bottom line agreement is reached in the case of no demand agreement and Bi + Bj≤ Pij
Whereas both parties k = i, j receive their demand Dk in case of a demand agreement, their profits
are determined by their bottom lines Bk in case of a bottom line agreement. If none of these two
agreements is achieved, the two parties end up in conflict with conflict payoffs Ck.
Since the conflict payoffs Ck depend on the pairing (i, j), we write Ck(i, j). We concentrate on the
following situation: CX (X, Z) = 0 , CY (Y, Z) = b , CXY (XY, Z) = a + b, CZ (X, Z) = c CZ (Y, Z) = c CZ (XY, Z) = 2c with a, b, c > 0 ; b + c < 100 ; a + c < 100
Due to the fact that CY (Y, Z) = b > 0 = CX (X, Z), we can say that Y is stronger than X.
To solve this game theoretically, we can consider the acceptance borders as the (only) essential strategic variables. Obviously, in an efficient equilibrium the bargaining parties must choose
Bi + Bj = Pij
To select a unique efficient equilibrium outcome as a benchmark solution we rely on the Nash bargaining solution, which maximizes the product of the dividends (Bk – Ck) for k = i, j.
For the pair (i, j) = (X, Z) we maximize (BX – 0) (BZ – c) subject to BX + BZ = 97. This yields B*X = 48.5 – c/2, and B*Z = 48.5 + c/2
For the pair (i, j) = (Y, Z) we maximize (BY – b) (BZ – c) subject to BY + BZ = 97. This yields B*Y = 48.5 + (b – c)/2, and B*Z = 48.5 + (c – b)/2
For the pair (i, j) = (XY, Z) we maximize (BXY – a – b) (BZ – 2c) subject to BXY + BZ = 194. This
yields
B*XY = 97 + (a + b – 2c)/2, and B*Z = 97 + (2c – a – b)/2
Recall that the payoff BXY, or the conflict payoff (a + b) are to be divided equally between X and Y. Because a + b > 0 it follows that B*XY /2 > B*X. Thus, the weaker party X has an interest in
forming XY.
In this experimental study, we will consider a situation where the stronger party Y has no interest in forming XY. The condition B*Y > B*XY/2 has to be satisfied. Given, our parameter constraints,
this implies b > a.
The actually chosen parameters are
a = 12, b = 24, c = 11
Table 1 shows the resulting solution payoffs for X, Y, and Z under collective and decentralized bargaining. In the bottom row we have determined each player’s incentives for centralizing as the difference of his payoff in the case of collective bargaining and his payoff in the case of decentralized bargaining. Obviously, of the three players only X has positive incentives for centralizing. Our benchmark solution, thus, predicts decentralized bargaining.
Table 1: Payoffs for players X, Y, and Z under collective
and decentralized bargaining, and each player’s incentives for centralizing
X Y Z
decentralized bargaining 43 55 96a
collective bargaining 52 52 90
incentives for centralizing 9 -3 -6
a
54 + 42
3.
Experimental Design
The experiments were organized at the University of Karlsruhe with students from various faculties. Each subject was seated at a computer terminal. The experiment monitor distributed written instructions and read them aloud. Then each subject had to answer at his terminal a number of questions which tested the understanding of the instructions. Only when all subjects had correctly answered all questions could the experiment start. Subjects were not allowed to communicate other than through their decision making.
Each subject was randomly allocated the role of either player X, Y, or Z. Each subject participated in 20 negotiation rounds keeping the same role. The matchings of an X, a Y, and a Z player, however, were randomly determined in each round within matching groups of 9 players (3 players in each role). The subjects had complete information about the game, but they were not informed about the size of the matching group. In each round, all subjects made their decisions simultaneously and independently. These decisions represented complete plans prescribing decisions for all situations that might occur in that round.
The X and Y players had to declare whether they wanted to bargain collectively or not. Furthermore they had to choose an integer demand and acceptance border for individual and for collective bargaining. Similarly, the Z player had to choose an integer demand and acceptance border both for the individual negotiations with X and with Y, in case X and/or Y wanted to negotiate separately, and for the negotiation with XY, in case both X and Y wanted to negotiate collectively. When all players had made their decisions, it was determined whether decentralized or collective bargaining would take place and the appropriate negotiation was effectuated. For collective bargaining to take place, both X and Y had to vote for it. If only one of them opted for merging, decentralized bargaining took place. In the case of collective bargaining, it was randomly decided which of the two players, X or Y, was representing them in the negotiation with Z. At the end of each round, each player was informed whether decentralized or collective bargaining had taken place and about his own individual payoff and the payoff of the party he was negotiating with.
We organized 8 sessions with 18 subjects, i.e., two matching groups, each. Thus, we obtained 16 independent observations (matching groups) in total. At the end of each session, each subject was privately paid in cash his accumulated payoff for the 20 rounds. The conversion rate was 3 pfennigs (0.03 deutsche mark, DM) for 1 experimental currency unit. The average payment was DM 24.88 for the subjects in the role of player X, DM 26.12 for those in the role of player Y and DM 47.19 for those in the role of player Z.
4.
Experimental results
4.1 Collective or decentralized bargaining
Recall that theoretically the X player has an interest in collective bargaining while the Y player should prefer decentralized bargaining. As collective bargaining can take place only if both X and Y vote for it, the solution predicts decentralized bargaining. We observe, however, that (in the aggregate over all matching groups and rounds) 40 percent of all bargaining is collective. Fig. 1 shows the percentage of collective bargaining in each of the 20 rounds. The percentage of collective bargaining declines from 41 percent in the first 10 rounds to 39 percent in the second 10 rounds, but this decline is statistically insignificant (one-sided Wilcoxon signed rank test, 5 percent level). Of the X players’ votes, 77 percent are for collective bargaining while of the Y players’ votes, 51 percent are for collective bargaining. Thus, similar to Berninghaus et al. (1998), we find evidence in favor of the prediction in that the X players vote significantly more often for collective bargaining than the Y players (two-sided sign test, 1 percent significance level).
0 10 20 30 40 50 60 70 80 90 100 1 2 3 4 5 6 7 8 9 10 11 12 13 14 15 16 17 18 19 20 Round P e rc e n t of c e n tr a lize d ba rga ining
4.2 Bargaining behavior
Table 2 presents the average demands and bottom lines of players X and Y both in decentralized and in collective bargaining. It also presents the average demands and bottom lines of the Z players in negotiation with X, Y, and XY. We observe that all demands are significantly higher than the respective bottom lines (one-sided Wilcoxon signed rank test, 5 percent level). In other words, all player types in all situations tend to make concessions in that their bottom lines are below their demands. We observe no significant differences between the demands (or bottom lines) of X (or Y) players in decentralized and in collective bargaining. Neither do we observe significant differences between the demands (or bottom lines) of X players and Y players1. The Z players’ demands show no significant differences whether they bargain with X, Y, or XY. The Z players’ bottom lines, however, do significantly differ: their bottom lines in the negotiation with X are higher than those in the negotiation with Y, and their bottom lines in the negotiation with Y are higher than their bottom lines per player (i.e., half of their bottom lines) in the negotiation with XY (two-sided Wilcoxon signed rank test, 5 percent level). In other words, the Z players perceive the Y players to be stronger than the X players, but they perceive the joint venture XY to be even stronger than the two parties separately. These differences show in the bottom lines rather than in the demands suggesting that bottom lines are behaviorally more relevant than demands . Table 3 splits the demands and bottom lines of players X and Y according to whether the respective player voted for decentralized or for collective bargaining. We make the following observations (one-sided Wilcoxon signed rank tests, 5 percent level): X players who vote for collective bargaining demand significantly more than X players who vote for decentralized bargaining2. Y players who vote for collective bargaining demand in the collective bargaining mode significantly more than Y players who vote for decentralized bargaining. This is also true for the bottom lines. We conclude that X players who vote for collective bargaining think that they should try to achieve more in decentralized bargaining as well. Y players who are willing to bargain collectively try to do better in collective bargaining than Y players who are not willing to bargain collectively3.
Comparing demands and bottom lines (as presented in Table 2) to our benchmark solution (in Table 1), we observe the following (one-sided binomial tests, 5 percent level): In the case of decentralized bargaining, X players’ demands and bottom lines and Z players’ demands and bottom lines in negotiation with Y tend to be too high while Y players’ bottom lines and Z players’ demands and bottom lines in negotiation with X tend to be too low. In the case of collective bargaining, X and Y players’ bottom lines are significantly too low, while Z players’ demands are too high. Generally the bargaining behavior of the different players does not seem to reflect the strength that our benchmark solution attributes to them.
1 Note, however, that in decentralized bargaining the Y players’ demand just fails significance for being higher than
the X players’ demand by p = 0.058.
2 This is true for their demand as X; it just fails significance for their demand as XY (p=0.051). 3
Note, however, that we do not know how seriously subjects considered the demands and acceptance borders for collective bargaining in situations where due to their own vote collective bargaining could not happen.
Demands and bottom lines are rather closely located around the equal split of the total "pie", i.e., 48.5. While the demands of the X, Y, and Z players, in decentralized and collective bargaining, significantly tend to be above half of the "pie", bottom lines significantly tend to be below half of the "pie" (one-sided binomial test, 5 percent level)—with the exception, however, of the Y players' demands and bottom lines (as the XY representative) in collective bargaining. Recall that according to our benchmark solution, the Y player's bottom line in decentralized bargaining, the XY player's bottom line, and the Z player's bottom line in the negotiation with X should be larger than half of the "pie".
Let us define a player's concession as the difference of his demand and bottom line. Table 4 presents the average concessions of X, Y, and Z players in decentralized and collective bargaining. In the case of collective bargaining we consider half of the concession, or the concession per player in XY. We observe no significant difference between the concessions of players X and Y and between decentralized and collective bargaining. Furthermore, we observe no significant differences between the concession of player Z and players X or/and Y. We observe, however, significantly higher concessions of Z players in collective bargaining than in decentralized bargaining (two-sided Wilcoxon signed rank test, 1 percent level). We may interpret this as further evidence that Z players perceive the joint venture XY as a stronger bargaining partner than either X or Y separately.
Table 2: Average demands and bottom lines
player X player Y player Z
X XYa Y XYa X Y XYa demand bottom 52.81 45.88 52.90 46.52 54.76 46.62 51.73 44.74 51.68 46.41 50.92 45.63 51.07 43.59 a per player
Table 3: Average demands and bottom lines of the X and Y players in voting against/for centralization
vote against centralization vote for centralization
player X player Y player X player Y
X XYa Y XYa X XYa Y XYa
Table 4: Average concessions
player X player Y player Z
toward X toward Y toward XY decentralized collectivea 6.93 6.38 8.14 6.98 5.27 5.29 7.48 a per player
4.3 Agreements and conflicts
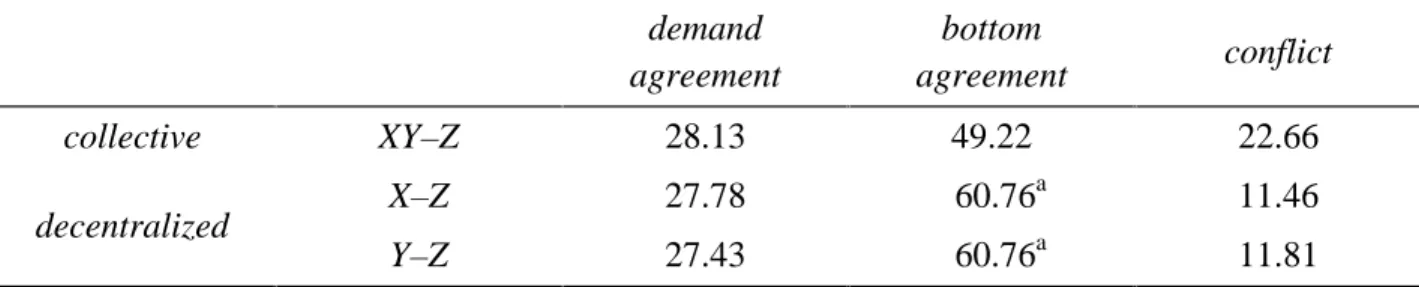
The relative frequency of demand agreements is 27.60 percent in decentralized bargaining and 28.13 percent in collective bargaining. The relative frequency of bottom line agreements is 60.76 percent in decentralized bargaining and 49.22 percent in collective bargaining. The relative frequency of conflicts is 11.63 percent in decentralized bargaining and 22.66 percent in collective bargaining. Table 5 shows the respective percentages separately for the bargaining situation between X and Z and between Y and Z. There appears to be no difference between them. In decentralized bargaining, border agreements become significantly more frequent from the first 10 rounds to the second 10 rounds. In all cases, border agreements occur more often than demand agreements and conflicts. Thus, acceptance borders are behaviorally more relevant than demands.
Table 5: Relative frequency of demand agreements, bottom line agreements and conflicts
demand agreement bottom agreement conflict collective decentralized XY–Z X–Z Y–Z 28.13 27.78 27.43 49.22 60.76a 60.76a 22.66 11.46 11.81 a
Significantly increased from the first 10 rounds to the second 10 rounds (Wilcoxon matched pair signed rank test, 5 percent significance level, two-sided)
4.4 Payoffs
The average payoffs per period realized by the X, Y, and Z players are 41.46, 43.53, and 78.65 respectively. Although the Y players on average gain significantly more than the X players (one-sided Wilcoxon signed rank test, 5 percent level), Y players gain only 79.1 percent of their theoretically predicted profit under decentralized bargaining while X players gain 96.4 percent of
the predicted profit. Z players gain 82.8 percent of the predicted payoff and significantly less than the sum of the X and Y players’ profits (one-sided Wilcoxon signed rank test, 5 percent level). Table 6 presents both the predicted and the average realized payoffs per round of each bargaining party in decentralized and collective bargaining. For the realized payoffs we determine the X, Y, and Z players’ incentives for centralizing as the differences of payoff in collective bargaining and the payoff in decentralized bargaining. The incentives are 1.04, -2.40, and -14.83 for the X, Y, and Z player respectively. Thus, compared to the theoretical benchmark solution, the X players’ incentive and the Y players’ disincentive have become less important while the Z players disincentive has become more important.
We find significance for the following observations (one-sided Wilcoxon signed rank test; 5 percent level; all other comparisons show no significant difference): (1) The Z players’ payoffs per XY player in collective bargaining tend to be lower than their payoffs in the negotiation with X alone (a) or Y alone (b). Thus, the Z players’ total payoffs in collective bargaining tend to be lower than their sum of payoffs in decentralized bargaining. (2) In collective bargaining, the Z players’ payoffs per XY player tend to be lower than those of the X players and those of the Y players. (3) In decentralized bargaining, the Z players’ payoffs tend to be lower than those of the Y players but higher than those of the X players. (4) The Y players’ payoffs in decentralized bargaining just fail significance for being larger than their payoffs in collective bargaining4 and larger than the X players’ payoffs5. Of these observations only (1b) violates the prediction of the Nash bargaining solution.
Table 6: The predicted and average realized payoffs per round in decentralized and collective bargaining (the realized payoffs include those in case of conflict)
negotiation parties
(i, j) payoff of party i payoff of party j Nash bargaining prediction (X, Z) (Y, Z) (XY, Z) 43 55 52* 54 42 45* realized payoff per round (X, Z) (Y, Z) (XY, Z) 41.04 44.49 42.09* 42.73 41.85 34.88* * per player of party i
5.
Conclusion
We observe that in 40 percent of the cases the stronger Y players vote for collective bargaining although it is not in their strategic interest: not only according to the theoretical benchmark solution but also in the experiment (although this just fails significance) Y players do, on average, gain higher payoffs in decentralized than in collective bargaining. We suggest that the larger number of votes for collective bargaining by Y players might be influenced by an inequality aversion with respect to the Z players (Fehr and Schmidt 1999, Bolton and Ockenfels 1999). In collective bargaining, Z players claim less than in decentralized bargaining. Thus, in collective bargaining Z players gain significantly lower payoffs than in decentralized bargaining—their payoffs in collective bargaining still being higher than those of the X or Y players, though.
Demands and bottom lines are located around the equal split of the total "pie." Obviously, fairness considerations similar to those observed in ultimatum bargaining experiments also play some part in our experiment (see Roth 1995 for a survey).
X (and Y) players who vote for collective bargaining claim (in collective bargaining) a larger share of the pie for themselves than those who vote for decentralized bargaining. This supports the common claim that by forming a coalition a bargaining side may gain in strength (Einigkeit macht stark!). According to game theory this claim is true only for specific (parameter) constellations different from the one we use (see Berninghaus et al. 1998). For our particular model, the benchmark solution predicts a minor loss for Z when X and Y merge (-6). In the experiment, we observe a loss which is more than twice as great (-14.83).
Our experiment may be considered another test of the Nash bargaining solution. Nydegger and Owen (1975) and Roth and Malouf (1979) have presented experiments designed to test the axioms of the Nash bargaining solution. Keser, Rullière and Villeval (1999) also explore the predictive success of the Nash bargaining solution in an experiment where employers bargain with trade unions of different sizes. They observe that employers do not adapt their claims to the union's size as predicted by the Nash bargaining solution. Our experiment allows us, like Berninghaus et al. (1998), to compare the success of the Nash bargaining prediction in decentralized and collective bargaining. We observe that the behavior of Z players qualitatively reflects the strength relation between X and Y in the case of decentralized bargaining. However, in the case of collective bargaining, the strength of the joint venture is overvalued. One possible explanation is an "irrational" fear of Z players regarding the joint venture (supported by the fact that Z players claim less from XY than they claim from X and Y separately). A more convincing explanation is offered by the Einigkeit macht stark result discussed above. If Z has to bargain with XY instead of X and Y separately, both partners of the XY joint venture have voted for it. According to Table 3, those who vote for XY have higher aspirations than the average X or Y participant. Thus, voting for the joint venture can be seen as the determined self-selection of tough bargainers. In other words, when XY forms, Z confronts tougher bargaining partners than when XY does not form. This also explains the higher conflict rate in collective bargaining than in decentralized bargaining.
References
Berninghaus, S. K., Güth, W., Lechler, R., Ramser H.-J. (1998): Decentralized versus collective bargaining: An experimental study, mimeo.
Bolton, G. E., Ockenfels, A. (1999): ERC: A theory of equity, reciprocity and competition, American Economic Review.
Calmfors, L., Driffill, J. (1988): Bargaining structure, corporatism and macroeconomic performance, Economic Policy 6, 14-61.
Fitzenberger B. (1995): Zentralisierungsgrad von Lohnverhandlungen und Lohnbildung in Ländern der Europäischen Union, Diskussionspapier 20, CILE, Konstanz.
Fehr, E., Schmidt, K. M. (1999): A theory of fairness, competition, and cooperation, Quarterly Journal of Economics.
Horn, H., Wolinsky, A. (1988): Worker substitutability and patterns of unionization, Economic Journal 391, 484-497.
Jun, B.H. (1989): Non-cooperative bargaining and union formation, Review of Economic Studies 56, 59-76.
Keser, C., Villeval, M.-C., Rullière, J.-L. (1999): Union bargaining strength as a public good: Experimental evidence, Working Paper 99-22, SFB 504, Universität Mannheim.
Nash, J. F. (1950): The bargaining problem, Econometrica, 18, 155-162.
Nash, J. F. (1953): Two-person cooperative games, Econometrica, 21, 128-140.
Nydegger, R. V., Owen, G. (1975): Two person bargaining: An experimental test of the Nash axioms, International Journal of Game Theory 3, 239-249.
OECD (1997): Economic performance and the structure of collective bargaining, Employment Outlook.
Roth, A. E. (1995): Bargaining experiments, in: J.H. Kagel and A.E. Roth, eds., The Handbook of Experimental Economics, Princeton University Press.
Roth, A. E., Malouf, M. W. K. (1979): Game-theoretic models and the role of information in bargaining, Psychological Review 86, 574-549.
Rubinstein, A. (1982): Perfect equilibrium in a bargaining model, Econometrica 50, 97-109. Selten, R., Güth, W. (1978): Macht Einigkeit stark?–Spieltheoretische Analyse einer
Verhandlungssituation, in: Neue Entwicklungen in den Wirtschaftswissenschaften, Schriften des Vereins für Socialpolitik, N.F. Bd. 98, 197-217.
Traxler, F., Kittel, B. (2001): The bargaining system and performance. A comparison of 18 OECD countries, forthcoming in: Comparative Political Studies.
Liste des publications au CIRANO *
Cahiers CIRANO / CIRANO Papers (ISSN 1198-8169)
99c-1 Les Expos, l'OSM, les universités, les hôpitaux : Le coût d'un déficit de 400 000 emplois au Québec — Expos, Montréal Symphony Orchestra, Universities, Hospitals: The Cost of a 400,000-Job Shortfall in Québec / Marcel Boyer
96c-1 Peut-on créer des emplois en réglementant le temps de travail ? / Robert Lacroix 95c-2 Anomalies de marché et sélection des titres au Canada / Richard Guay, Jean-François
L'Her et Jean-Marc Suret
95c-1 La réglementation incitative / Marcel Boyer
94c-3 L'importance relative des gouvernements : causes, conséquences et organisations alternative / Claude Montmarquette
94c-2 Commercial Bankruptcy and Financial Reorganization in Canada / Jocelyn Martel 94c-1 Faire ou faire faire : La perspective de l'économie des organisations / Michel Patry
Série Scientifique / Scientific Series (ISSN 1198-8177)
99s-30 Qui veut réduire ses heures de travail? Le profil des travailleurs adhérant à un programme de partage de l'emploi / Paul Lanoie, Ali Béjaoui et François Raymond 99s-29 Dealing with Major Technological Risks / Bernard Sinclair-Desgagné et Carel Vachon 99s-28 Analyse de l'impact productif des pratiques de rémunération incitative pour une entreprise de services : Application à une coopérative financière québécoise / Simon Drolet, Paul Lanoie et Bruce Shearer
99s-27 Why Firms Outsource Their Human Resources Activities: An Empirical Analysis / Michel Patry, Michel Tremblay, Paul Lanoie et Michelle Lacombe
99s-26 Stochastic Volatility: Univariate and Multivariate Extensions / Éric Jacquier, Nicholas G. Polson et Peter E. Rossi
99s-25 Inference for the Generalization Error / Claude Nadeau et Yoshua Bengio 99s-24 Mobility and Cooperation: On the Run / Karl-Martin Ehrhart et Claudia Keser
99s-23 Input Price Discrimination, Access Pricing, and Bypass / Ngo Van Long et Antoine Soubeyran
99s-22 Existence and Uniqueness of Cournot Equilibrium: A Contraction Mapping Approach / Ngo Van Long et Antoine Soubeyran
99s-21 Sources of Productivity Growth: Technology, Terms of Trade, and Preference Shifts / Thijs ten Raa et Pierre Mohnen
99s-20 Remarks on Environmental Regulation, Firm Behavior and Innovation / Bernard Sinclair-Desgagné
* Vous pouvez consulter la liste complète des publications du CIRANO et les publications elles-mêmes sur notre site World Wide Web à l'adresse suivante :