Conference paper
Roxanne Brion-Roby, Jonathan Gagnon*, Jean-Sébastien Deschênes and Bruno Chabot
Development and treatment procedure of
arsenic-contaminated water using a new and
green chitosan sorbent: kinetic, isotherm,
thermodynamic and dynamic studies
DOI 10.1515/pac-2017-0305
Abstract: Arsenic is classified as one of the most toxic elements for humans by the World Health Organiza-tion (WHO). With the tightening drinking water regulaOrganiza-tion to 10 μg L−1 by the WHO, it is necessary to find
efficient sorbent materials for arsenic. In this work, the removal of arsenic(V) from water is achieved with an insoluble chitosan sorbent in the protonated form obtained by a simple heating process. Kinetic studies show a very fast sorption (less than 10 min). The Langmuir isotherm model is best describing experimental data with a capacity of 42 mg g−1 at pH 8. The sorption process is based on anion exchange (chemisorption)
determined from the Dubinin-Radushkevich model. The sorption efficiency of the chitosan sorbent is 97 % at low concentrations (e.g. 100 μg L−1). Thermodynamic analysis reveals that the sorption process is exothermic
and is controlled by enthalpic factors. Breakthrough curves (BTC) were acquired in real-time by instrumental chromatography and was better described by the Thomas model. BTC from column sorption and desorption with a salt solution suggest that this sorbent is relevant for large scale applications. With this new renewable product, it will be possible to treat arsenic contaminated water at low cost and with little waste (concentra-tion factor of 1500).
Keywords: arsenic removal; breakthrough curves; column adsorption; fixed-bed; ICGC-6; isotherms; kinetics; polysaccharides; thermodynamics; water treatment.
Introduction
Arsenic is one of the most toxic elements for human health. Contamination of drinking water by arsenic affects over 140 million people in 70 countries around the world [1] and represents a major issue of public health. Moreover, arsenic is difficult to detect because it is odorless, colorless and highly water-soluble.
Article note: A collection of invited papers based on presentations at the 6th international IUPAC Conference on Green Chemistry
(ICGC-6), Venice (Italy), 4–8 September 2016.
*Corresponding author: Jonathan Gagnon, Département de Biologie, chimie et géographie, Université du Québec à Rimouski,
300 allée des Ursulines, Rimouski, Québec G5L 3A1, Canada, e-mail: jonathan_Gagnon@uqar.ca. http://orcid.org/0000-0001-6463-0413
Roxanne Brion-Roby: Département de Mathématiques, informatique et génie, Université du Québec à Rimouski, 300 allée des
Ursulines, Rimouski, Québec G5L 3A1, Canada; and Département de Biologie, chimie et géographie, Université du Québec à Rimouski, 300 allée des Ursulines, Rimouski, Québec G5L 3A1, Canada
Jean-Sébastien Deschênes: Département de Mathématiques, informatique et génie, Université du Québec à Rimouski, 300 allée
des Ursulines, Rimouski, Québec G5L 3A1, Canada
Bruno Chabot: Centre de recherche sur les matériaux lignocellulosiques, Université du Québec à Trois-Rivières, 3351 boul. des
Mainly, chronic arsenic intoxication causes skin problems, several types of cancer and affects all organs including the central nervous system and the development of children [2–4].
Natural sources of arsenic come principally from weathering and eroding of rocks and soils. Anthro-pogenic sources represent more than three times the contribution from natural sources. Mining and wood industries are the main anthropogenic sources. Arsenic is affecting people living in developing as well as in industrialized countries. Arsenic contamination can attain concentrations up to 5 mg L−1 and affects
popula-tion of several countries like Bangladesh, China, India, Mexico, Spain and Vietnam [2, 5–7].
The World Health Organization (WHO) suggests a concentration lower than 0.01 mg L−1 in drinking
water and 0.05 mg L−1 in wastewater, which many countries have difficulties to attain. Traditional
remedia-tion techniques such as coagularemedia-tion, precipitaremedia-tion, ion exchange, and membrane separaremedia-tion are available to remove arsenic from water [6–9]. However, most of them present major disadvantages with incomplete metal recovery, high capital and operation costs, and/or sludge disposal problems [10]. Adsorption is one of the most effective processes for the decontamination of water. Commercial activated carbons are very effective adsorbents due to their highly developed porosity, large surface area (that can reach 3000 m2 g−1), variable
characteristics of surface chemistry, and high degree of surface reactivity. Unfortunately, due to their high production costs, these materials tend to be more expensive than other adsorbents [11]. Thus, it is necessary to develop a simple and efficient water treatment for arsenic removal involving renewable resources, espe-cially for inorganic arsenic which is the most toxic form [7].
Ion exchange is widely used in several industries such as chemicals, food, pharmaceutical, and water treatment. Sorbents are obtained from many starting materials like synthetic resins and others. For example, zeolite sorbents have been studied for heavy metals removal from wastewater [12]. Moreover, the introduction of cationic groups on polysaccharides is also interesting to promote interactions with anionic species [13].
On the other hand, chitosan is a rare example of natural cationic polymer that is obtained by N-deacety-lation of chitin. The latter is found in crustacean exoskeletons, a by-product of the fishery industry. Chitosan is the second most abundant polysaccharide on Earth and it is renewable, biodegradable, biocompatible, non-toxic, and hydrophilic. This aminopolysaccharide is soluble in diluted acidic aqueous media. Chitosan is also well-known for coordination of transition metal ions through the primary amine and hydroxyl groups. Adsorption of metal ions occurs from coordination and electrostatic bonds [14–17]. Besides that, chitosan have been reported to be six times more efficient than chitin to coordinate metallic ions [18]. Pristine chitin and chitosan have shown very low sorption capacity toward As(V) (0.13 mmol g−1). In addition, an important
drawback of chitosan and its derivatives is their swelling properties that complicate their separation by fil-tration and centrifugation methods. To overcome these disadvantages, chitosan was grafted or cross-linked to improve its sorption properties and handling that generally involve toxic chemical reagents. Some green procedures have been recently reported for the formation of magnetic chitosan. For example, chitosan was cross-linked with EDTA and was studied for the removal of metal ions with efficiency up to 1.56 mmol g−1 [19].
Regeneration of chitosan sorbent in adsorption columns was realized with a solution of sodium hydroxide, hydrochloric acid and sodium chloride [20–23].
In this work, we have synthesized a new insoluble chitosan sorbent using a simple and green method-ology where amine groups are protonated. The sorbent was studied for sorption of arsenate ions, which is based on electrostatic interactions and ion exchanges. Kinetics, adsorption isotherm and thermodynamic were determined from batch experiments (removal around 97 % at low concentrations). Adsorption and des-orption in fixed-bed columns were also studied in real-time from instrumental chromatography.
Experimental
Materials
Chitosan, poly[ß-(1→4)-2-amino-2-deoxy-D-glucopyranose], from Nordic shrimp exoskeletons (Pandalus
chitosan in 1 % acetic acid v/v) was purchased from Primex (Iceland). Acetic acid (ACS grade) was bought from Fisher Scientific. For analysis, the nitric acid was metal trace grade. Arsenic solutions were made with Na2HAsO4 · 7H2O. All other chemicals were of analytical grade and were bought from Aldrich. No purification of reagents was done before use.
Synthesis of chitosan sorbent
Chitosan (10 g) was heated at 160 °C in an oven during 16 h. The solid was then allowed to reach room tem-perature (RT). The chitosan sorbent was washed with acetic acid (150 mL, 5 % v/v). The brown slurry was filtered under vacuum and washed three times with nanopure water. The yellow/brown solid was dried at RT. A yield of 85 % was obtained. The solid was ground in a 50 mL cell during 5 min at RT at a frequency of 20 Hz with four metallic balls of 15 mm by a cryogenic mill (CryoMill) from Retsch. The solid was size separated with Canadian standard sieves series of W.S. Tyler and only the fractions of 75–500 μm were kept, which composed 90 % of the total mass. IR ν (cm−1); 3200–3400 (O–H and N–H stretching), 1690 (C=O carboxylate), 1630 (NH
2
def), 1538 (C=O acetate), 1403 and 1377 (CH3 def), 1350 (CH2 def), 1000–1200 (C–O stretch). Solid-state 13C
NMR; 180 (C=O acetate), 174 (C=O amide), 101 (C1), 75 (C3), 58 (C2), 24 (CH3 acetate) ppm.
The amount of accessible amine groups on the sorbent was measured by mixing the sorbent (100 mg) in water (40 mL) acidified with hydrochloric acid (3 mL of 0.3 M solution). Then, the suspension was titrated by adding sodium hydroxide solution (0.1 M) and the pH was followed with a pH meter from Mettler Toledo until pH 11.5. From volumes at the two equivalence points, the quantity of accessible amine groups was determined.
Instruments
Nanopure water was obtained using a nanopure Diamond system (model D11931) from Barnstead. Infrared absorption spectra were measured on a FT-IR iS10 spectrophotometer by ATR. NMR spectra were recorded with an Avance III HD 600 MHz NMR spectrometer from Bruker. SEM images were acquired on a JEOL JSM-6460 LV scanning electron microscope. Dried supports were placed on a carbon tape and placed on the sample holder. BET surface areas were analyzed by physisorption of nitrogen on solid porous materials, using an AUTOSORB-1 analyzer from Quantachrome. Arsenic analyses were achieved on a MP-AES from Agilent Technologies 4200 MP-AES with a nitrogen generator and an autosampler ASX-520 Cetac using a MP Expert software version 1.5.0.6545. Breakthrough curves were measured with an ÄKTA fast protein liquid chromatography (FPLC) from GE Healthcare equipped with an UV-visible detector and a 16 mm diameter XK column.
Adsorption
The concentration of arsenic for the kinetic experiments was 120 mg L−1. Sorbent material (0.100 g) was used
for 50 mL of arsenic solution. Kinetic sorptions were done in 50 mL Falcon conical centrifuge tubes. The tubes were agitated on an orbital shaker of JEIO TECH at 120 rpm during a specific time. The tubes were centrifuged immediately with an Avanti J-E centrifuge from Beckman coulter at 5000 rpm during 5 min at RT. The super-natants were kept and stored at 4 °C until analysis.
For the isotherm, thermodynamic and low concentrations studies, the specific concentration was attained by dilution of an arsenic solution of 200 mg L−1 and 2000 μg L−1 (low concentration experiments).
The final concentrations were between 20 and 200 mg L−1 to fit in the isotherm curve and between 100 and
a final volume of 50 mL at pH 8 (only nanopure water and arsenate). The sorbent material (0.100 g) was added to the arsenic solution. The suspension was stirred as for kinetic experiments during 2 h at 21 °C. For isotherm adsorption experiments realized at 45 and 65 °C, a Thermo Scientific thermal mixer with blocks was used. The suspensions were centrifuged and the supernatants were stored as previously described for kinetic experiments.
All sorption experiments (kinetics, isotherm, and low concentrations) were realized in duplicate which had standard variations lower than 2 %.
Quantification of arsenic
Concentrations of arsenic were determined by MP-AES using a single pass cyclonic spray chamber. The method parameters include a wavelength of 234.984 nm for arsenic, a calibration fit linear weighted, three readings per sample, an uptake time of 25 s, a rinse time of 25 s and a stabilization time of 15 s. The super-natant was directly analyzed without prior digestion. The washing solution between analyses was 2 % (v/v) nitric acid. The calibration range was 7.5–120 mg L−1. The detection limit was 0.5 μg L−1. All experiments were
realized at least in duplicate.
The sorption reaction is described in Scheme 1. The sorption capacity of the chitosan sorbent was deter-mined with the following equation [24] :
( ) As eq u s s q c V q m ⋅ − = (1)
where qs is the capacity of the sorbent material (mg g−1 sorbent), q
As is the available amount of arsenic in the
suspension (mg), ceq is the equilibrium concentration of arsenic in the supernatant (mg L−1), V
u is the volume
of the liquid phase (L), and ms is the weight of the sorbent (g).
All kinetic and isotherm curves were nonlinearly fitted with MATLAB version R2014a. Parameter identifi-cation involved the minimization of a least squares criterion measuring the deviation between the experimen-tal data and the model prediction. This nonlinear optimization was performed using a multi-start strategy (in order to identify possible local minima and assess the global one) and the Nelder-Mead algorithm.
Dynamic study in fixed-bed column
A layer of sand (thickness of 5 mm, particle size 200–300 μm) was added in the bottom of the fixed-bed and the chitosan was suspended overnight in water before addition to the top of the column. An upper layer of sand was added after bed compaction. Breakthrough curves (BTC) were obtained with a column filled with the sorbent and the feed was pumped at a constant flow and the filtrate was analyzed in real-time at 200 nm with an UV detector coupled to the FPLC. Table 1 presents some parameters on fixed-bed columns. The interstitial volume was determined from the weight of water necessary to fill the fixed-bed column. The bed density was calculated from the weight of the fixed-bed divided by its volume. Calibration of the UV detector was realized
NH3+ O O H O OH CH3 O O NH3+ O O H O OH CH3 O O n
+
HAsO4 2– n+
1/2 n n HAsO42– 1/2using standard solutions of arsenic in accordance with the Beer-Lambert law. The response of the detector was linear over 170 mg L−1 of arsenic.
Results and discussion
Formation and characterization of chitosan sorbent
Chitosan was transformed with a good yield into an insoluble product in aqueous acidic media by simple heating at 160 °C. This chitosan product was washed with a solution of acetic acid to remove soluble materials and to protonate the amine groups. Figure 1 compares IR spectra of pristine chitosan and chitosan sorbent. IR spectrum of the sorbent shows characteristic bands of chitosan and acetate ions. Particularly, O–H and N–H stretching at 3200–3400 cm−1, carbonyl stretching of carbonyl at 1690 cm−1, CH
2 deformation at 1350 cm−1 and
C–O stretching at 1000–1200 cm−1 are observed. A new carbonyl band is observed at 1538 cm−1 in comparison
with raw chitosan, as expected, due to the acetate counter-ion. Two new bands (1403 and 1377 cm−1) assigned
to CH3 deformations are also observed.
Solid-state 13C NMR spectrum (Fig. 2) corresponds to the structure of acetate chitosan sorbent. Figure 2
shows carbonyl bands at 180 ppm (carboxylate) and 174 ppm (amide). Pyranosyl C1 and C3 carbons are found at 101 and 75 ppm, respectively. The carbon bearing the amine (C2) is observed at 58 ppm. The methyl carbon belonging to the acetate ion is detected at 24 ppm.
The average particle size was between 75 and 250 μm, determined by sieving the powder. The quantity of accessible amine groups was quantified by acid-base titration, where 4.7 mmol g−1 of amine groups were
reached, corresponding to almost 100 % of all amine groups of the sorbent material. The Brunauer, Emmett and Teller (BET) analyses reveal that the specific surface area is 0.45 m2 g−1, which is consistent with literature.
Table 1: Operational parameters for dynamic experiments.
Parameters Down-flow experiment Up-flow experiment
Mass of sorbent (g) 2.2545 2.3237 Interstitial volume (mL) 27.17 31.74 Diameter (cm) 1.6 1.6 Height (cm) 12.20 13.85 Bed volume (cm3) 24.53 27.85 Bed density (kg m−3) 91.9 83.4
Average particle diameter (μm) ~192 ~192
Inlet concentration (mg L−1) 120 120
Feed flow rate (mL min−1) 2.0 2.0
Temperature (°C) 21 21
Empty bed contact time (min) 12.3 13.9
3750 3500 b a 3250 3000 2750 2500 2250 Wavelength (cm–1) Tr ansmittance (%) 2000 1750 1500 1250 1000 750
Indeed, chitosan sorbents possess specific surface area between 0.29 and 0.52 m2 g−1 for chitosan beads and
cross-linked chitosan beads [25]. The SEM images (Fig. 3) demonstrate that particles are randomly shaped and that they are very porous up to 5 μm.
Four different batches of sorbent were separated by size. Table 2 shows that, despite the size of par-ticles, the sorption percentage and capacity were almost the same for all six tested fractions. Fractions 75–500 μm represent approximately 90 % in all four batches. The sorption capacity of the batches is similar between the four lots. It demonstrates that the product is reproducible and the particle size has no effect on the sorption.
Fig. 3: SEM images of the sorbent with enlargements.
Table 2: Capacity and composition of four different batches of the chitosan sorbent. Particle
ranges (μm) Sorption (%) Percentage in batch #1 Percentage in batch #2 Percentage in batch #3 Percentage in batch #4
250–500 57.53 17.90 17.65 31.06 15.31 125–250 57.17 45.70 51.60 47.82 65.48 75–125 56.90 26.70 16.41 8.05 12.78 75–500 57.25 90.30 85.66 86.93 93.57 200 150 100 Chemical shift (ppm) 50 0
Adsorption of arsenate
Adsorption kineticsPseudo-first order kinetic model
Kinetic experiments were modelled using the pseudo-first order, pseudo-second order, and intra particle diffusion models. The kinetics can be defined as the sorption rate. Several factors influence the adsorption rate like the transport of arsenate to the sorbent, the diffusion through the pores and the adsorption on the surface of the sorbent. The initial adsorption is commonly fast, due to the accessibility of external sites of adsorption.
The equation of the pseudo-first order kinetic model is [24, 26]: 1 1 exp ( k t) t e q q= − − ⋅ (2) where qt is the sorbed amount (mg g−1) at time t (min), q
e is the sorbed amount (mg g−1) at equilibrium and k1
is the pseudo-first order rate constant (min−1). A fitting to a pseudo-first order kinetic model indicates that
the reaction limiting step is governed mainly by physisorption. This model suggests that the sorption rate is proportional to the difference between the amount of adsorbed sorbate at time t and the amount of adsorbed sorbate at equilibrium. Eventually, the sorption is reversible and reaches the equilibrium.
Pseudo-second order kinetic model
The pseudo-second order kinetic model is defined by the following equation [24, 26]:
2 2 2 1 e t e q k t q q k t ⋅ ⋅ = + ⋅ ⋅ (3)
where qt is the capacity (mg g−1) at time t (min), q
e is the capacity (mg g−1) at equilibrium and k2 is the
pseudo-second order rate constant (mg mg−1 min−1). This model suggests that the adsorption capacity is proportional
to the active sites occupied by the sorbate. A fitting to a pseudo-second order kinetic model indicates that the reaction is governed principally by chemisorption, as the limiting step.
Diffusion or mass transfer models
Sorption is frequently the mixing of surface diffusion and pores diffusion. The intraparticle diffusion model is defined by [27]:
0.5
( )
t ip i
q = k t⋅ + (4)C
where qt is the capacity (mg g−1) at time t (min), k
ip is the constant of intraparticular diffusion rate or pores
diffusion and Ci is indicating the boundary layer thickness. Thus, the higher the intercept is, the more the adhesion on the surface contributes to limiting the sorption rate. In this model, the limiting step is the diffu-sion in the pores.
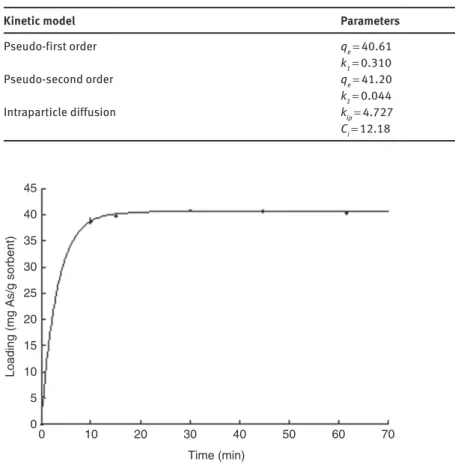
Table 3 summarizes the results obtained from the fitting of the kinetic experiments using those three models. The kinetics is established very quickly (i.e. less than 10 min), this makes experimental data collec-tion difficult especially in shorter sorpcollec-tion times. Kinetic experimental data fit very well with a pseudo-first order kinetic model (R2 = 0.9999, Fig. 4) and a pseudo-second order model (R2 = 0.9997) due to the lack of data
below 10 min. The results fit well up to 60 min because a slight decrease (around 2 %) of capacity occurs after that time. This decrease was observed from two independent kinetic experiments and cannot be taken into account by kinetic models. Fast kinetics are very interesting for further applications of this sorbent in water treatment.
Adsorption isotherms
The sorption results were fitted with typical isotherm models such as Langmuir, Freundlich and Dubinin-Radushkevich (D-R) based on physical phenomena, and with a three-variable empirical model, the Redlich-Peterson model. The sorption behavior was also analyzed by the Scatchard isotherm model.
Langmuir isotherm
The Langmuir model assumes that the adsorption process is a monolayer on the sorbent and that all binding sites are homogenous, the number of binding sites is constant and the sorption occurs without interference. The sorption equilibrium is described by equation 5. The equilibrium constant b is defined by equation 6 where [Sorbent−M] is the concentration of product adsorbed (mg L−1), [Sorbent−*] is the concentration of
the sorbent (mg L−1), and [M] is the concentration of the sorbate (mg L−1) [27].
Sorbent * M Sorbent M− + = − (5) [Sorbent ] [Sorbent *][ ]M b M − = − (6)
From equation 6, equation 7 can be obtained by substituting [Sorbent−M] by qe, [Sorbent-*] by (qmax − qe), and [M] by Ce, where qe is the amount of adsorbate at equilibrium (mg g−1), C
e is the concentration at
equilib-rium (mg L−1) and q
max is the maximal capacity of the sorbate (mg L−1).
45 40 35 30 25 20 15 10 5 0 Time (min)
Loading (mg As/g sorbent)
0 10 20 30 40 50 60 70
Fig. 4: Kinetic data points fitted with the pseudo-first order kinetic model.
Table 3: Kinetic models tested for the removal of arsenate using the chitosan sorbent.
Kinetic model Parameters R2
Pseudo-first order qe = 40.61 0.9999 k1 = 0.310 Pseudo-second order qe = 41.20 0.9997 k2 = 0.044 Intraparticle diffusion kip = 4.727 0.6513 Ci = 12.18
max ( e e) e q b q q C = − (7)
Equation 8 is obtained from equation 7 by simple mathematical modification and represents the Lang-muir isotherm model [16, 28, 29].
max 1 e e e bq C q bC = + (8)
Equation 9 allows calculating the variation in Gibbs energy due to the adsorption process where R is the ideal gas constant (8.314 J K−1 mol−1) and T is the temperature (K). The unit of the equilibrium constant b (L mg−1) must be prior converted in mol L−1 to be used in equation 9 as mentioned by Liu [30].
( )
G RT ln b
∆ = − (9)
Freundlich isotherm
The Freundlich model is a special case of the Langmuir model that corresponds to a heterogeneous multilayer sorption. Besides, this model expresses a non-ideal physical adsorption. The Freundlich model is described by equation 10 where K is the adsorption coefficient (defining the strength of adsorption) and n is a coeffi-cient related to the energy of interaction and its variation [16, 28, 29].
n
e e
q KC= (10)
Dubinin-Radushkevich (D-R) and Dubinin-Astakhov (D-A) isotherms
The D-R isotherm is based on the theory of volume filling of micropores. The adsorption potential (ε) is given by equation 11 [29, 31, 32]. Ce and qe were calculated from molarity in the fitting and qmax was reported in mg g−1
in Table 4. 1 1 e RTln C ε= + (11)
The D-R isotherm equation is defined by equation 12, where β is related to the free energy of adsorption. In the D-R isotherm, the exponent (nd) has a fixed value of 2, but for the D-A isotherm, the exponent is a
Table 4: Isotherm models and their parameters at 21, 45 and 65 °C.
Isotherm model 21 °C 45 °C 65 °C
Langmuir qmax = 44.08 qmax = 34.64 qmax = 29.12
b = 0.158 b = 0.104 b = 0.059
R2 = 0.9973 R2 = 0.9899 R2 = 0.9975
Freundlich K = 13.46 K = 9.15 K = 5.59
n = 0.256 n = 0.275 n = 0.328
R2 = 0.9290 R2 = 0.9792 R2 = 0.9703
Dubinin-Radushkevich qmax = 87.53 qmax = 70.21 qmax = 65.43
β = −2.67x10⁻⁹ β = −2.94 × 10⁻⁹ β = −3.63 × 10⁻⁹
E = 13 700 E = 13 000 E = 11 700
R2 = 0.9245 R2 = 0.9800 R2 = 0.9011
Redlich-Peterson qmax = 48.78 qmax = 22.71 qmax = 29.18
b = 0.128 b = 0.256 b = 0.059
n = 1.042 n = 0.876 n = 1.001
variable that is determined by fitting the isotherm [33]. The value of nd provides information about the uni-formity of the sorbent. A value near the unity indicates that the binding sites are heterogeneous, whereas a value around three or more is an indication of homogeneity.
max
nd e
q q e= βε
(12) The free energy of adsorption (J mol−1) is determined by the following equation [28, 29, 34, 35]:
1 2 E β = − (13)
The process is a physisorption if the free energy is below 8 kJ mol−1, an anion exchange if the free energy
is between 8 and 16 kJ mol−1 and a chemisorption when the free energy is above 20 kJ mol−1.
Redlich-Peterson (R-P) isotherm
Contrary to previous two-parameter isotherms, the Redlich-Peterson model is a three-parameter model used to represent the adsorption equilibrium on a large range, which is described by equation 14, where qmax is the maximum loading, Ce is the concentration at equilibrium and b (L mg−1) and n are the isotherm parameters as
in the Langmuir and Freundlich models, respectively. This equation can be used in homogeneous systems as well as in heterogeneous system, and is a hybrid between Langmuir and Freundlich models [36]:
max 1 ( )e e n e q bC q bC = + (14)
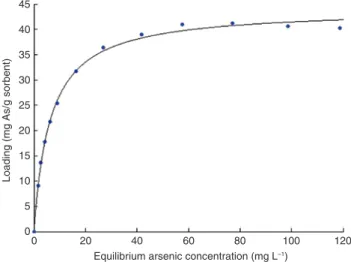
Maximum capacity is reached very rapidly (less than 10 min) but to ensure a thermodynamic equilibrium, a settling time of 2 h was chosen for isotherm experiments. Four common models were tested to fit the iso-therm defined by 12 independent experiments. At the three studied temperatures, the Redlich-Peterson model (R2 = 0.9982 at 21 °C) is the most representative model. The Redlich-Peterson model uses three parameters
instead of two like the Langmuir and Freundlich models (Table 4). Considering the lower degree of freedom, the Langmuir model is also excellent (R2 = 0.9973 at 21 °C) at all temperatures and is shown in Fig. 5. The
het-erogeneity factor (1/n) in the Freundlich model is indicative of the intensity of interaction. If the value of n is above the unity, this implies that the sorption is a favorable physical process (physisorption). If the value of n is
45 40 35 30 25 20
Loading (mg As/g sorbent)
Equilibrium arsenic concentration (mg L–1)
15 10 5 0
0 20 40 60 80 100 120
below the unity, the sorption is a chemisorption. The value of n is 0.256 (Table 4) indicating that the sorption is a chemical process. From the D-R isotherm, the binding energy between the sorbent and arsenate ions can be determined, allowing also the determination of sorption mode (physisorption or chemisorption). In the studied system, this free energy is 13.7 kJ mol−1 corresponding to ion exchange (chemisorption), which is consistent
with the proposed mode of action. From the isotherm experiments realized at a concentration up to 200 mg L−1,
the maximum sorption capacity obtained experimentally is 42 mg g−1 at 21 °C, which is close to the theoretical
maximum capacity determined from the Langmuir isotherm (44.08 mg g−1). Table 4 shows that the theoretical
maximum capacity determined from the Langmuir isotherm decreases from 21 to 65 °C, which can be explained by the effect of temperature on the sorption equilibrium constant. The D-A isotherm shows very high nd values (6.8 at 21 °C and 5.7 at 65 °C) demonstrating that the binding sites of the sorbent are very homogeneous. Scatchard isotherm
The Scatchard isotherm, defined by equation 15, is an indication of the nature of the binding sites, where kb is the Scatchard isotherm constant determined from a graph of e
e q
C versus qe [32, 37]. Deviation from linearity
usually pointed out the presence of more than one type of binding sites.
e
m b e b
e
q Q k q k
C = − (15)
At 21 °C and 65 °C, Scatchard isotherm is linear with R2 of 0.9933 and 0.9860, respectively, showing that the
sorbent have one type of binding sites. However, at 45 °C, the Scatchard isotherm is not linear (R2 of 0.9332) on the
entire range of qe. The isotherm is better described by two linear lines. In literature, a linear form of the Scatchard isotherm confirms the eligibility of the Langmuir model as a good choice to describe the adsorption model. Thermodynamic results
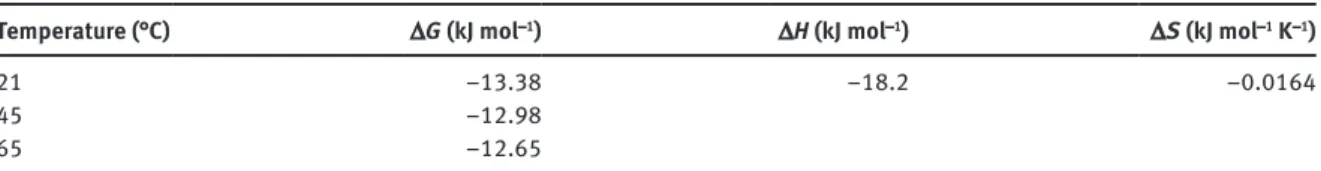
The thermodynamic parameters obtained from the van’t Hoff equation and the sorptions of arsenate at three temperatures are presented in Table 5. The variation of Gibbs energy is negative at all studied temperatures demonstrating that the sorption process is spontaneous and exothermic where the major variation comes from enthalpic factors (ΔH = −18.2 kJ mol−1). The entropy of the system slightly decreases during the process, which is
consistent with an anion exchange between acetate/chloride ion and a divalent anion such as arsenate in water. Dynamic results
The breakthrough curve (BTC) was determined experimentally, instead of constructing a mathematical model. The dynamic results allow verifying the applicability of the sorbent in fixed-bed columns, to compare with batch adsorption and to predict the behavior of such columns at a larger scale [38].
Fixed-beds were filled with the chitosan sorbent and contaminated water (120 mg L−1 of arsenic) was fed
through the top of the column, leading to clean water until the maximum capacity of the bed was achieved.
Table 5: Thermodynamic parameters from sorption experiments at different temperatures.
Temperature (°C) ΔG (kJ mol−1) ΔH (kJ mol−1) ΔS (kJ mol−1 K−1)
21 −13.38 −18.2 −0.0164
45 −12.98
BTC were acquired in real-time with a fast protein liquid chromatography (FPLC) that possesses several advantages such as continuous monitoring of arsenate concentration at the exit of the column, a high data acquisition rate (at least one point per second), a constant flow of contaminated water and the applied pres-sures were monitored through the experiments. Thus, each BTC (sorption and desorption) was described with approximately thirteen hundred points and the pressure was always between 0.10 and 0.30 MPa.
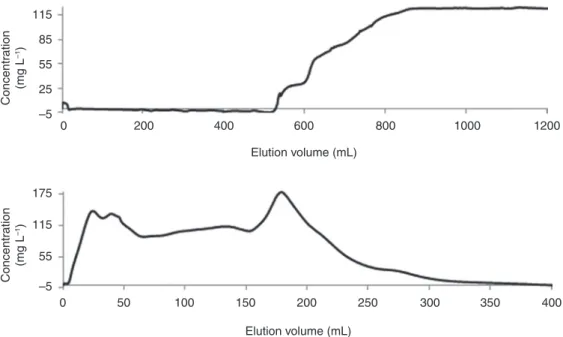
As shown in Fig. 6, the BTC progresses inconstantly, signifying that the packing of the column is not totally homogenous (channeling) despite experimental precautions or that more than one binding sites could be present. From the Scatchard isotherm, the latter hypothesis should be excluded due to highly linearity of the fit at 21 °C (R2 = 0.9933) that suggests the presence of only one type of binding sites. With the 16 mm
dia-meter fixed-bed column, it was possible to filter the contaminated water to obtain clean water without any trace of arsenate until 520 mL with an arsenic feeding concentration of 120 mg L−1. The column adsorption
demonstrates a maximum capacity of 36 mg arsenic per gram of support. However, the retention time in the column was less than 10 min, which explains partially the lower capacity of the column compared to adsorp-tion isotherm models.
The sorbent can be regenerated with sodium chloride solutions like seawater or diluted seawater. However, for technical reasons, sodium fluoride (5 g L−1) was used instead of sodium chloride, which
inter-feres with the arsenate UV signal at 200 nm and lower. Sodium fluoride does not compete with arsenate ions absorption at 200 nm. As comparison, with this chitosan fixed-bed, working with arsenic contaminated water at a concentration of 0.1 mg L−1, 1500 L of clean water could be provided, producing one liter of
waste-water during the column regeneration. Those results are therefore very promising for large scale applications. The same experiment was also done with an up-flow configuration that is commonly used in laboratory scale. The up-flow configuration allows a more constant flow and avoids channeling. This experiment may be compared with the down-flow configuration (Table 6). The density of the fixed-bed for the up-flow experi-ment (Table 1) could explain the lower capacity. And, as for the down-flow experiexperi-ment, the residence time of the adsorbate in the column was less than 10 min. Moreover, three sorption and three desorption experiments were realized to study the regeneration capacity. Desorption trials were carried out with 30 ‰ sodium chlo-ride solution (synthetic seawater) and the fixed-bed capacity was constant over five regenerations. Table 6 shows that the capacity decreases after regeneration with sodium fluoride. As stated previously, sodium fluo-ride was used to avoid competitive UV absorption with arsenate. NaF has a negative impact on the capacity
0 115 85 55 Concentration (mg L –1) Concentration (mg L –1) 25 –5 175 115 55 –5 200 400 600 Elution volume (mL) 800 1000 1200 0 50 100 150 Elution volume (mL) 200 250 300 350 400
of the column. This could be attributed to stronger binding affinity of fluoride ions on the sorbent compared to chloride ions.
The Thomas, Yoon-Nelson and Adams-Bohart models are used to fit the BTC of the down-flow experi-ment. The BTC were fitted between 0.05 and 0.9 of the inlet concentration (C0). Results from batch and column adsorption are significantly different that is due to the lack of agitation, the difference in water volume and competition between anions.
The Thomas model is based on the Langmuir and the pseudo-second order kinetic models. This model considers that no axial dispersion occurs in the system. Equation 16 shows the linearized equation of this model [39–42]: 0 max 0 ln 1 t c t t C k q m kC t C Q − = − (16)
where C0 is the inlet concentration of arsenic (mg L−1), C
t is the concentration (mg L−1) at time t (min), kt is
the Thomas rate constant (L min−1 mg−1), q
max is the equilibrium uptake of arsenic (mg g−1), mc is the mass of
sorbent (g) and Q is the flow rate (L min−1).
The Yoon-Nelson model is a second interesting model for dynamic experiments. The basic hypothesis of this model is that there is proportionality between the decreasing rate of adsorption for every single molecule of adsorbate and the probability of adsorption of the adsorbate on the sorbent and the probability of adsorb-ate breakthrough on the sorbent.
The linearized equation of the Yoon-Nelson model is [39–42]:
0 0 ln YN YN t C k t k C C τ = − − (17)
where C0 is the inlet concentration of arsenic (mg L−1), C
t is the concentration (mg L−1) at time t (min), kYN is the
Yoon-Nelson rate constant (min−1) and τ is the time required for half of adsorbate breakthrough (min).
The Adams-Bohart model is based on the relation existing in the surface reaction theory (Fick’s law). The model shows that the equilibrium is not instantaneous because the sorption is proportional to the concentra-tion of the sorbate and the residual capacity of the sorbent. The linearized model is presented by [39–42]:
0 0 0 0 ln t AB AB C k C t k N z C U = − (18)
where C0 is the inlet concentration of arsenic (mg L−1), C
t is the arsenic concentration (mg L−1) at time t (s), z is
the bed height (cm), U0 is the superficial velocity (cm min−1), N
0 is the saturation concentration of the column
(mg L−1) and k
AB is the mass transfer coefficient (L mg−1 min−1).
The fitted parameters of dynamic models are presented in Table 7. The dynamic behavior of the fixed-bed is best described by the Thomas and Yoon-Nelson models (R2 of 0.9738). When the Thomas model is applied
to the sorption BTC, the result is not completely linear especially in the beginning of the BTC. Some non-linear phenomena can happen in column adsorption. At the end of the column, a higher concentration in counter-ions (acetate or fluoride ions) is formed, which could affect the linearity of the Thomas model.
Table 6: Capacity for the dynamic tests.
Direction of the flow Down-flow Up-flow
Adsorption 1st 1st 2nd 3rd
Breakthrough time (tb; min) 260 250 168 77
Exhaustion time (te; min) 425 450 340 300
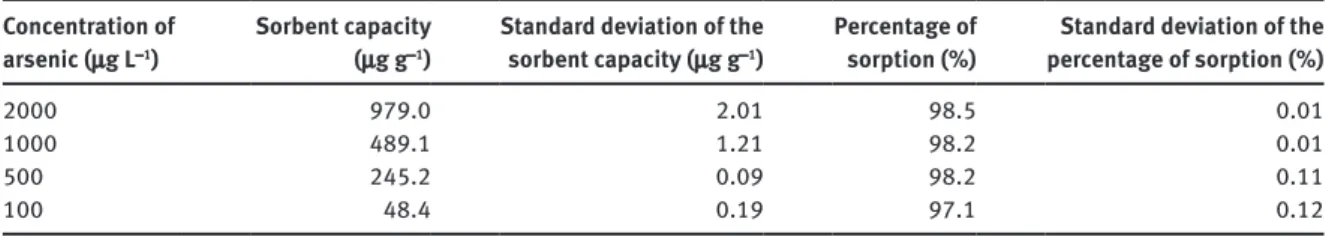
Efficiency at low concentrations
In the previous section, experiments were realized at a high arsenic concentration (120 mg L−1) to avoid the
utilization of large volume of solutions and to decrease the experiment time. To demonstrate the efficiency of chitosan sorbent at low concentrations, batch adsorption experiments (50 mL) were conducted at low arsenic concentrations from 100 to 2000 μg L−1. Table 8 summarizes the results obtained at low concentrations where
removal efficiencies higher than 97 % are reached. These results indicate the high removal efficiency of the chitosan sorbent leading to a final arsenic concentration lower than 3 μg L−1, reaching the limit set by the
WHO.
Conclusions
This new sorbent material is obtained from a renewable product and from a green and cost-effective meth-odology that does not involve organic solvents during its synthesis. The adsorption of arsenate by chitosan sorbent occurs in few minutes by anion exchange and the kinetics can be described by pseudo-first and second order models. The sorbent presents a high experimental maximum capacity of 42 mg g−1 that is near
the theoretical maximum capacity determined by the Langmuir isotherm. The sorbent is also very efficient at low concentrations for arsenate sorption and is able to reach the target defined by the WHO. The sorbent can be regenerated by desorption with sodium chloride solutions leading to little waste. Fixed-bed columns allow an arsenic concentration factor of 1500. The BTC prediction is better described by the Thomas and Yoon-Nelson models.
Water is a natural resource that is not available in sufficient quality for human consumption in all coun-tries around the world. Our results proved that this sorbent is promising for large scale applications notably for arsenic removal, which is interesting for development of sustainable water treatment. The synthesis of this chitosan sorbent will be optimized for sorption of anions. The effect of competitive ions and scale-up of this sorption process will be studied in future works.
Acknowledgements: The authors gratefully acknowledge the Natural Sciences and Engineering Research Council of Canada (NSERC), the Fonds de recherche du Québec – Nature et technologies (FRQNT) and the Centre québécois sur les matériaux fonctionnels (CQMF) for their financial support. We thank Mr. Claude Belzile (SEM) and Mr. Steeven Ouellet (FPLC and MP-AES) from UQAR, and also Mr. Benoit Bideau (BET) from UQTR for their technical assistance.
Table 7: Parameters from three dynamic models describing the BTC.
Dynamic model Parameters R2
Thomas kt = 0.000258 qmax = 34.43 0.9738
Yoon-Nelson kYN = 0.0309 τ = 323.4 0.9738 Adams-Bohart kAB = 0.000124 N0 = 3702 0.8848
Table 8: Capacity and percentage of sorption at low concentrations for chitosan sorbent. Concentration of
arsenic (μg L−1)
Sorbent capacity (μg g−1)
Standard deviation of the sorbent capacity (μg g−1)
Percentage of
sorption (%) percentage of sorption (%)Standard deviation of the
2000 979.0 2.01 98.5 0.01
1000 489.1 1.21 98.2 0.01
500 245.2 0.09 98.2 0.11
References
[1] World Water Assessment Programme. in The United Nations World Water Development Report 3: Water in a Changing
World, p. 139. UNESCO and Earthscan, Paris and London (2009).
[2] S. Chowdhury, M. A. J. Mazumder, O. Al-Attas, T. Husain. Sci. Total Environ. 569, 476 (2016). [3] C. Chen, Y. Chung. J. Environ. Sci. Health. Part A. 41, 645 (2006).
[4] X. Wang, Y. Liu, J. Zheng. Environ. Sci. Pollut. Res. 23, 789 (2016).
[5] B. Hendry, J. Bundschuh, K. Yoshizuka, M. Bryjak, N. Kabay, P. Bhattacharya, S. Anaç. in The Global Arsenic Problem:
Challenges for Safe Water Production, Vol. 2, pp. 3–20. CRC Press, Boca Raton (2010).
[6] A. Sarkar, B. Paul. Chemosphere. 158, 37 (2016).
[7] N. Ricci Nicomel, K. Leus, K. Folens, P. Van Der Voort, G. Du Laing. Int. J. Environ. Res. Public Health. 13, 62 (2015). [8] R. Singh, S. Singh, P. Parihar, V. P. Singh, S. M. Prasad. Ecotoxicol. Environ. Saf. 112, 247 (2015).
[9] M. Habuda Stanié, M. Nujié. Environ. Sci. Pollut. Res. 22, 8094 (2015). [10] D. Sud, G. Mahajan, M. P. Kaur. Bioresour. Technol. 99, 6017 (2008).
[11] J. M. Dias, M. C. M. Alvim-Ferraz, M. F. Almeida, J. Rivera-Utrilla, M. Sanchez-Polo. J. Environ. Manage. 85, 833 (2007). [12] Y. Zhao. Environ. Eng. Sci. 33, 443 (2016).
[13] H.J. Prado, M. C. Matulewicz. Eur. Polym. J. 52, 53 (2014). [14] L. Zhang, Y. Zeng, Z. Cheng. J. Mol. Liq. 214, 175 (2016).
[15] V. M. Boddu, K. Abburi, J. L. Talbott, E. D. Smith. Environ. Sci. Technol. 37, 4449 (2003). [16] L. Pontoni, M. Fabbricino. Carbohydr. Res. 356, 86 (2012).
[17] I. Hamed, F. Özogul, J. M. Regenstein. Trends Food Sci. Technol. 48, 40 (2016). [18] A. Bhatnagar, M. Sillanpää. Adv. Colloid Interface Sci. 152, 26 (2009).
[19] F. Zhao, E. Repo, M. Sillanpää, Y. Meng, D. Yin, W. Z. Tang. Ind. Eng. Chem. Res. 54, 1271 (2015). [20] S. Saha, P. Sarkar. J. Hazard. Mater. 227, 68 (2012).
[21] C. W. Xiao, X. J. Liu, S. M. Mao, L. J. Zhang, J. Lu. Appl. Surf. Sci. 394, 378 (2017). [22] K. Z. Elwakeel, G. O. El-Sayed, S. M. Abo El-Nassr. Desalin. Water Treat. 55, 471 (2015). [23] P. J. Quinlan, N. Grishkewich, K. C. Tam. Can. J. Chem. Eng. 95, 21 (2017).
[24] D. I. Mendoza Castillo, C. K. Rojas Mayorga, I. P. Garcìa Martinez, M. A. Pérez Cruz, V. Hernández Montoya, A. Bonilla Petriciolet, M. A. Montes Moràn. Int. J. Environ. Sci. Technol. 12, 1657 (2014).
[25] W. S. W. Ngah, M. A. K. M. Hanafiah. Biochem. Eng. J. 39, 521 (2008).
[26] C. G. Lee, P. J. J. Alvarez, A. Nam, S. J. Park, T. Do, U. S. Choi, S. H. Lee. J. Hazard. Mater. 325, 223 (2017). [27] A. Adamczuk, D. Kołodyńska. Chem. Eng. J. (Amsterdam, Neth.) 274, 200 (2015).
[28] E. Worch. in Adsorption technology in water treatment: fundamentals, processes, and modeling, pp. 41–76. De Gruyter, Berlin (2012).
[29] W. Ma, F. Q. Ya, M. Han, R. Wang. J. Hazard. Mater. 143, 296 (2007). [30] Y. Liu. Colloid Surface A. 274, 34 (2006).
[31] I. Lakhdhar, D. Belosinschi, P. Mangin, B. Chabot. J. Environ. Chem. Eng. 4, 3159 (2016). [32] A. Islam, S. Kumar, N. Zaidi, H. Ahmad. Food Chem. 213, 775 (2016).
[33] D. R. Hutson, R. T. Yang. Adsorption. 3, 189 (1997). [34] A. Dodi, J. Dron. J. Hazard. Mater. 190, 300 (2011).
[35] R. Laus, T. G. Costa, B. Szpoganicz, V. T. Fàvere. J. Hazard. Mater. 183, 233 (2010). [36] E. Guibal. Sep. Purif. Technol. 38, 43 (2004).
[37] C. Hinz. Geoderma. 99, 225 (2001).
[38] B. B. Mehari, A. O. Mayabi, B. K. Kakoi. Int. J. Eng. Technol. 3, 512 (2014). [39] Z. Xu, J. G. Cai, B. C. Pan. J. Zhejiang Univ. Sci. A. 14, 155 (2013).
[40] Z. Z. Chowdhury, S. B. Abd Hamid, S. M. Zain. BioResources. 10, 732 (2015).
[41] T. A. H. Nguyen, H. H. Ngo, W. S. Guo, T. Q. Pham, F. M. Li, T. V. Nguyen, X. T. Bui. Sci. Total Environ. 523, 40 (2015). [42] Y. Ge, X. Cui, C. Liao, Z. Li. Chem. Eng. J. 311, 126 (2017).