The labor supply of baby-boomers and
low-flation
Benoit Mojon
Xavier Ragot
The labor supply of baby-boomers and low-flation
121. Introduction
The post 2013 recovery of advanced economies has not yet translated into “normal” levels of inflation. Inflation remains surprisingly weak in the euro area, Japan, the US and most other advanced economies, the UK being the exception. Core CPI inflation, the GDP deflator inflation and wage inflation adjusted for productivity have all remained closer to 1 % than to 2%, their pre-crisis nominal anchor (see Figure 1, the IMF WEO and Ciccarelli and Osbat, 2017). In the case of the euro area, we observe lowflation in spite of the creation of over 7 million jobs and 18 quarters in a row of growth above the euro area 1.2 to 1.3 % yoy growth potential.
As shown in Figure 2, unemployment has also declined steadily from its peak that followed either the great recession (outside Europe) or the euro area 2012 sovereign debt crisis for euro area countries. It is very tempting for some to conclude that “the Phillips curve may be broken for good” (The Economist, 1 nov. 2017) or that it now depends, to a growing extent, on a global economy slack3. Many economists (see Auer et al., 2017 and references therein) argue that global value chains deprive central banks from a transmission of monetary policy through domestic labor and goods markets. This analytical debate on the transmission from monetary policy to inflation is crucial.
Another major transformation of advanced economies is the ageing of baby boomers (Cahuc, Hairault and Prost, 2016). What is less known, at least to inflation analysts, it that it has led to a tremendous increase in the participation of older workers to the labor market4. For instance, 6 of the 7 million jobs created in the euro area since 2013 are above 50. The participation rates of workers aged 55 to 64 has increased from 33% to 55%, on average across OECD countries in the last decade. In Germany it increased from around 40% until 2003 to above 70% in 2016. This major transformation of the work force coincides with the setting up of pension reforms that became implemented as baby-boomers cohorts approached the age of retirement. As shown in for instance in Schiemder, von Wachter and Bender (2015) and in Schwandt and von Wachter (2017) such demographic conditions may influence the determination of wages drastically.
1 This paper reflects the views of the authors and not necessarily the views of Banque de France, the
Eurosystem or OFCE.
2 We thank Jocelyne Tanguy (Banque de France) for outstanding research assistance and Andrea Bassanini,
Claudio Borio, Olivier Blanchard, Pierre Cahuc, Gilbert Cette, Jordi Gali, Olivier Garnier and Yannick Kalantzis for comments and suggestions. All remaining errors are ours.
3 For a recent overviews of this debate see Blanchard (2017) and Blanchard et al. (2016), Borio (2017),
Constancio (2017) as well as the IMF WEO (2015, 2017) and Ciccarelli and Osbat (2017).
4 Several papers have analyzed the relation between ageing and inflation. See for instance Bobeica et al. (2017)
and references therein. However, to the best of our knowledge, none have stressed the role of labor supply of elderly workers. On the effects of ageing on asset prices see also Takats (2010).
In principle, this increase in participation may however also reflect an increase in labor demand, in which case we expect it would have pushed wages up. The fact of the matter is that, as we show in this paper, wages have responded negatively to increased participation of older workers.
This change in the composition of the workforce is akin to a major labor supply shock by ageing workers. Most likely these aim to preserve their lifetime purchasing power through postponing their retirement. Ceteris paribus, this positive labor supply shock is likely to push down wage inflation and unit labor costs. The data show that this conjecture cannot be rejected. And the effects on wage inflation are large. The participation rates of the elderly have a significant negative effect on wage inflation for G7 countries, in the euro area and more broadly in the OECD. For instance, in Germany, this accounts for - 1% per annum on average over the last 5 years. Our estimates indicate that there is something special about the participation of the elderly, compared to other age group. Indeed, as Hairault et al. (2014) note, the shorter time-horizon of job tenures reduce the outside value of the elderly. Hence they have less incentive to search for other jobs. Due to this effect, the increase of the participation of the elderly workers may decrease wage pressure5, what is consistent with our estimates.
Our second result is that wage Phillips curve find very strong support in the data. Looking either across each of our three panels of countries (the G7, 8 EA member states or 19 OECD countries) we find that, from 1996 to 2016, wages respond positively to past CPI inflation and to productivity while they respond negatively to unemployment. The response to unemployment is highly significant both statistically and economically. Henceforth, wage inflation still responds very strongly to by (measures of) labor market slack. A one percent decline in the unemployment rate increases wage inflation by 0.5-0.6% on average in the G7 panel, 0.4% for the OECD panel and 0.25% in the 8 EA member states panel. Post 2009, this effect is slightly lower (0.3) for either the G7 or OECD wide panels but it is stable in the panel of euro area countries.
Third, we also find that mark ups are not diminished by the participation of workers older than 55. Hence, what we uncover is more likely to reflect labor market developments than a deflationary slowdown of aggregate demand, which, for instance, could reflect that elder workers have higher savings rates.
2. Data
We assembled annual data on wage inflation, CPI inflation, labor productivity, the rate of unemployment and the participation to labor markets for 19 OECD countries: the US, Japan, Germany, France, the UK, Italy, Canada, Australia, Spain, the
Netherlands, Belgium, Austria, Finland, Denmark, Norway, Sweden, Switzerland and Portugalr and Ireland. Our panel is balanced from 1996 to 2016.
All variables are plotted in Figure 1 to 3.
First, all measures of inflation (core CPI, the GDP deflator and nominal unit labor cost) are inferior post 2010 than in the decade before the great recession (Figure 1). Figure 2 shows the unemployment rates for workers above and below 55. Figure 3 shows the dramatic increase in the participation rate of older workers in all countries. However, the timing of changes in the participation rates is somewhat different across countries. Most of the increase takes place between 1996 and 2008 in the US, while in Germany and Austria it starts in 2003 and in Japan, we observe steps before 2000 and from 2008 to 2012 before a sharp increase thereafter. In other countries we observe a more steady increase of participation by elder workers from 1996 to 2016. However, even in countries where the increase is steady, the levels of participation differ. In contrast, the participation rate of workers aged 25 to 54 varies less and is more uniform across countries.
An important aspect of the changing composition of workers is whether older worker keep their jobs or if they also compete for new vacancies. To get a first sense of this, we show in Figure 4 the proportion among 55-64 workers whose job tenure is less than 12 months, and Figure 5 the product of participation times the proportion of tenure inferior to 12 months. The most striking is the heterogeneity across countries. In some (Canada, Spain), older workers have less and less short-term contracts. In others (Netherlands) this proportion increases. In most, it fluctuates. At least, we see no systematic pattern that higher participation is overwhelmingly due, across the countries in our panel, to keeping stable jobs.
It should be stressed, however, that whether older workers quit their former job later than was previously the case or that they compete for the new vacancies should both increase the supply of labor.
3. Estimation results 3.1 wage Phillips curves
We report the panel estimates6 of standard backward looking wage Phillips curves first for G7 countries (in Table 1), then for 8 "large" EA member states, EA8 thereafter (in Table 2) and finally for 19 OECD countries (in Table 3). As shown in the first column, wage inflation is highly responsive to its three traditional determinants: lagged CPI inflation, productivity and the unemployment rate. The T-stat of the unemployment rate is around 8 for the G7 or the EA8 and 12 for the panel of 19 OECD countries. The notion that wage inflation is not responding to labor market slack appears extremely unlikely. Of course, the sample we consider here, which
6 The estimates reported here correspond to fixed effects regressions. Given the narrow cross section of the
sample we also estimated the same equations with the Mean Group Estimators. Results, which are not reported for the sake of space, are very similar to the ones reported here.
includes the Great recession, is one with a high degree of co-movement between local labor market conditions and the global business cycle. Hence, some of the effects of the national unemployment rate may imbed the effects of a global slack à la Borio and Filardo (2007). However, while it may be difficult to disentangle the role of the global slack and the local one, our estimate show that labor market slack influence wages.
Turning to the period after 2009, for which estimates are reported in the last column of Table 1, 2 and 3, the effects of the unemployment on wage inflation are still estimated to be negative. However, given the reduction of the degrees of freedom we have over these seven years, these effects are somewhat less precisely estimated, especially among G7 countries.
3.2 Does the participation of baby-boomers impact wage inflation?
The second column reports the panel estimates of a specification augmented with three additional variables:
1. the difference in the unemployment rates of two categories of workers, the ones aged 55 to 64 and the ones aged 25 to 54;
2. the rate of participation to the labor market; and,
3. the difference in the participation rates workers aged 55 to 64 and the ones aged 25 to 54.
Our aim is to assess whether the increased participation of older worker impact wages. However, we also want to disentangle this effect from forces that can drive overall participation rates. And we also want to assess whether changes in age composition of unemployed impact wages or the overall effects of the unemployment rate on wages. Therefore we include both the overall unemployment and participation rates as well as differences of these rates above 55 and below 55 to test for a specific effect of the proportion of workers above 55 on wage developments.
Among these three variables, only the last one has an effect on wage inflation. An increased participation of older workers has a negative effect on wages either for the G7, the EA8 or across the OECD. We also note that the coefficient of unemployment is hardly affected by including these additional coefficients.
In columns 3 and 5 we include the yearly changes in the difference in participation rates instead of their level. This is to check that our result is not “spurious” given that participation of the elderly shows a trend in many countries while wage inflation tends to decline for the sample period. With this specification, we still find a negative effect of participation on wage inflation. However this effect is no more statistically significant for the EA8 countries and for the OECD sample it is statistically significant only with the more parsimonious specification that does not include the overall participation rate not the differential in unemployment rates.
We also note that all coefficients are less precisely estimated when we focus on the post 2009 sample. However, in the case of the 8 EA countries sample, we have only 56 observations…
In column 6, we add to our baseline regression the proportion of elderly workers with job tenure inferior to 12 month. And in column 7, the product of elderly participation rate to this proportion of tenures inferior to 12 months. We find that these two variables have a positive effect on wage inflation, though these effects are not statistically significant in the EA8 sample. Hence, more “recent” hires of elderly workers seem to reflect cyclical swings in labor demand. Interestingly, though, they hardly change the effect of the participation differentials between older than 55 and 25 to 54 workers, which still pushes wages down.
3.3 Mark ups
We consider an alternative mechanism whereby older workers may push inflation down. Indeed, especially if they care about their future purchasing power, that a higher share of income accrue to them could imply a less vibrant demand.
We actually found7 that unemployment has a positive and significant effect on mark ups and but participation differentials don’t. These results suggest that more elder workers impact inflation through the labor market, via wages.
4. The case of Germany
In this section, we report a decomposition of wage inflation for Germany. This is a very interesting case because, unlike the other large EA economies, German wages are subdued in spite of an apparently tight labor market (see the fall in the German unemployment rate in Figure 3). Figure 6 reports the decomposition of wage inflation based on an estimate of a standard backward looking wage Phillips curve (in the top panel) and the one augmented with the participation rate of workers ages 55 to 64 (in the bottom panel).
The contribution of this “labor supply shock” appears to account for as much as -1% on average since 2013.
5. Policy conclusions
Altogether the results reported in this paper are reassuring about our understanding of recent labour market dynamics.
First, we observe major adjustments of labor supply in response to the ageing of the population. In this respect, the persistent call of central banks for reforms has been either anticipated or answered to by politicians, labor market institutions, employers and workers. This increase in participation implies that potential output should have increased. If the participation of 20% of the working population (population aged 55 to 64 over population aged 20 to 64) has nearly doubled, it means that aggregate output potential has increased by roughly 10% if the productivity of older worker grows in line with the one of other workers. It should increase by less than 10% if the productivity of older workers is slower but it will grow as long as their productivity growth is not too negative.
Second, (wage) inflation remains very much driven by cyclical forces and therefore it can be influenced by monetary policies. This result should be taken into account by those who fear that the “Phillips curve” transmission of monetary policy to inflation is broken. Central banks who spur activity and employment will eventually harvest domestic wage inflation, and, in all likelihood, inflation of goods and services.
Third, it is not clear yet how high participation rates of older workers will go. We are probably undergoing a very long transition and we don't know when it will end. But as long as this transition implies a larger slack than measured by the unemployment rate, the economy operates below its "NAIRU" potential.
Fourth, we should hope that after undergoing this major increase in the participation of older workers, economic policies should focus on reducing youth unemployment.
References
AGBAYANI Cassandra, Bruno GASPERINI, James MOORE, Neha NANDA, Luke PATTERSON and Stephen WANDER (2016) « Literature review report : labor Market and DOL – Funded Employment Assistance for Older Worker » , US Department of Labor.
AUER, Raphael A., Claudio EV BORIO, and Andrew J. FILARDO, The globalisation of inflation: the growing importance of global value chains. BIS Working paper 602, 2017.
BLANCHARD Olivier, Should we Reject the Natural Rate Hypothesis?, 31 October 2017 prepared for the Journal of Economic Perspectives
BLANCHARD Olivier, Eugenio CERUTTI and Lawrence SUMMERS, Inflation and activity, Two explorations and their monetary policy implications ECB E-Book, "Inflation and Unemployment in Europe" 2015, ECB Forum on central banking, www.ecb.europa.eu/pub/pdf/other/ecbforumoncentralbanking2015en.pdf
BOBEICA, Elena and LIS, Eliza M. and NICKEL, Christiane and SUN, Yiqiao, Demographics and Inflation (January 2017). ECB Working Paper No. 2006. BORIO, Claudio EV and FILARDO, Andrew J. Globalisation and inflation: New
cross-country evidence on the global determinants of domestic inflation. 2007. BIS working paper.
BUTI Marco and Alessandro TURRINI, Overcoming Eurozone wage inertia, 6 October 2017 CEPR's Policy Portal
CAHUC Pierre, Jean-Olivier HAIRAULT and Corinne PROST, L'emploi des séniors : un choix à éclairer et à personnaliser, May 2016, Conseil d'analyse
économique
CONSTANCIO, Vitor, Understanding and overcoming low inflation, remarks at the Conference on “Understanding inflation: lessons from the past, lessons for the future?”, Frankfurt am Main, 21 and 22 September 2017
CICCARELLI Matteo and Chiara OSBAT, Low inflation in the euro area, causes and consequences, Occasional paper series 181, ECB, 2017
GALI Jordi, Insider-outsider labor markets, hysteresis and monetary policy, April 2016 Universitat Pompeu Fabra working paper 1506
GNOCCHI Stefano, LAGERBORG Andresa, PAPPA Evi, Do labor market institutions matter for business cycles? Journal of Economic Dynamics and Control, volume 51, February 2015, Pages 299–317
HAIRAULT Jean-Olivier and LANGOT François and SOPRASEUTH Theptida (2014) “Why is Old Wokers Labor Market More Volatile? Unemployment fluctuations vor the life-Cycle”, IZA Working paper 8076
IMF world economic outlook (2017), Recent Wage Dynamics in Advanced Economies: Drivers and Implications, Chapter 2, October.
SCHWANDT Hannes and VON WACHTER, Till, Unlucky Cohorts: Earnings, Income and Mortality Effects from Entering the Labor Market in a Recession, mimeo, Avril 2017.
SCHMIEDER, Johannes F., VON WACHTER, Till and BENDER, Stefan. The effects of extended unemployment insurance over the business cycle: Evidence from regression discontinuity estimates over 20 years. The Quarterly Journal of Economics, 2012, vol. 127, no 2, p. 701-752.
TAKATS, Előd, Ageing and Asset Prices (August 2010). BIS Working Paper No. 318, August 2010.
1996-2016 1996-2016 1996-2016 1996-2016 1996-2016 1996-2016 1996-2016 2010-2016 Lagged CPI inflation 0.548*** 0.459*** 0.525*** 0.504*** 0.532*** 0.360*** 0.358** 0.0656
(6.62) (5.23) (6.31) (5.97) (6.49) (3.41) (3.35) (0.50) Labor productivity gr 0.573*** 0.536*** 0.563*** 0.541*** 0.557*** 0.452*** 0.457*** 0.290* (9.28) (8.37) (8.94) (8.56) (9.07) (5.65) (5.66) (2.04) Unemployment rate -0.454*** -0.464*** -0.450*** -0.473*** -0.456*** -0.372*** -0.349*** -0.195 (-8.20) (-7.63) (-7.38) (-8.52) (-8.35) (-6.05) (-5.14) (-1.81) -0.156 -0.0709 (-1.48) (-0.73) Participation rate 0.0782 0.0243 (1.13) (0.38) -0.0591** -0.0357* -0.0238 -0.0601** -0.0195 (-2.78) (-2.08) (-1.35) (-2.99) (-0.44) -0.199* -0.179* (-2.39) (-2.24) 30.42* (2.55) 0.596* (2.10) _cons 3.967*** -2.306 2.588 3.181*** 4.123*** 1.589 0.129 2.356 (9.05) (-0.50) (0.63) (5.53) (9.41) (1.59) (0.07) (1.66) # countries 7 7 7 7 7 7 7 7 # observations 162 162 162 162 162 116 116 47
The dependent variable is wage inflation. Wages are measured as the compensation of empoyees. (T Stats). All regressions include a country fixed effect.
Participation * Tenure<12m for 55-64
Table 1: Estimates of wage Phillips curves in a panel of G7 countries
U. Rate differential above 55 - below 55 P. Rate differential above 55 - below 55 dP. Rate differential above 55 - below 55 Tenure <12 months for 55-64
1996-2016 1996-2016 1996-2016 1996-2016 1996-2016 1996-2016 1996-2016 2010-2016 Lagged CPI inflation 0.417*** 0.335*** 0.402*** 0.351*** 0.417*** 0.329*** 0.331*** 0.275
(5.41) (4.25) (5.12) (4.48) (5.43) (3.79) (3.81) (1.98) Labor productivity gr 0.305*** 0.263*** 0.308*** 0.256*** 0.300*** 0.276*** 0.278*** 0.164 (5.90) (4.95) (5.91) (4.84) (5.81) (5.00) (5.03) (1.21) Unemployment rate -0.257*** -0.277*** -0.272*** -0.264*** -0.258*** -0.272*** -0.271*** -0.241* (-8.77) (-9.14) (-8.73) (-9.20) (-8.84) (-8.86) (-8.84) (-2.14) (1.04) -0.0918 -0.0608 (-1.73) (-1.14) 0.0126 -0.00873 Participation rate (0.48) (-0.33) -0.0347** -0.0309** -0.0323** -0.0425* -0.0180 (-3.02) (-2.99) (-2.95) (-2.58) (-0.42) -0.0690 -0.0803 (-1.21) (-1.56) 5.367 (0.72) 0.183 (0.94) _cons 3.362*** 1.490 4.004* 2.345*** 3.442*** 2.253** 1.685 2.656 (10.19) (0.81) (2.43) (5.01) (10.36) (3.22) (1.53) (1.34) # countries 8 8 8 8 8 8 8 8 # observations 172 172 172 172 172 153 153 56
The dependent variable is wage inflation. Wages are measured as the compensation of empoyees. (T Stats). All regressions include a country fixed effect.
Countries included in the sample: Germany, France, Italy, Spain, Netherlands, Austria, Belgium and Finland. Participation *
Tenure<12m for 55-64
Table 2: Estimates of wage Phillips curves in a panel of 8 "large" EA economies
U. Rate differential above 55 - below 55 P. Rate differential above 55 - below 55 dP. differential above 55 - below 55 Tenure <12 months for 55-64
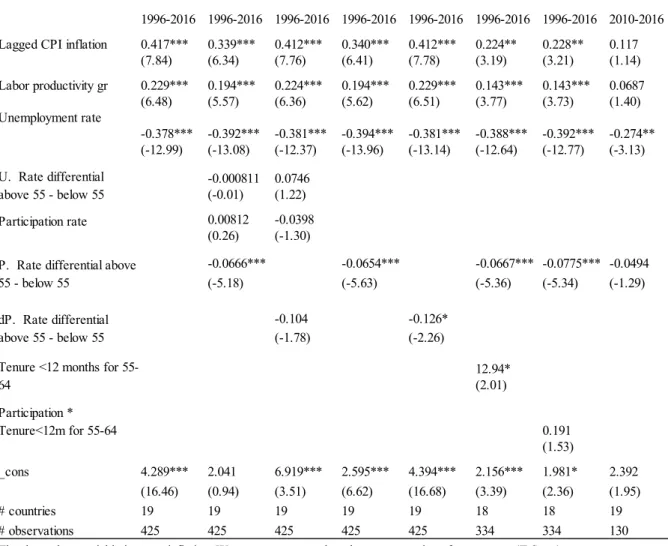
1996-2016 1996-2016 1996-2016 1996-2016 1996-2016 1996-2016 1996-2016 2010-2016 Lagged CPI inflation 0.417*** 0.339*** 0.412*** 0.340*** 0.412*** 0.224** 0.228** 0.117
(7.84) (6.34) (7.76) (6.41) (7.78) (3.19) (3.21) (1.14) Labor productivity gr 0.229*** 0.194*** 0.224*** 0.194*** 0.229*** 0.143*** 0.143*** 0.0687 (6.48) (5.57) (6.36) (5.62) (6.51) (3.77) (3.73) (1.40) Unemployment rate -0.378*** -0.392*** -0.381*** -0.394*** -0.381*** -0.388*** -0.392*** -0.274** (-12.99) (-13.08) (-12.37) (-13.96) (-13.14) (-12.64) (-12.77) (-3.13) -0.000811 0.0746 (-0.01) (1.22) Participation rate 0.00812 -0.0398 (0.26) (-1.30) -0.0666*** -0.0654*** -0.0667*** -0.0775*** -0.0494 (-5.18) (-5.63) (-5.36) (-5.34) (-1.29) -0.104 -0.126* (-1.78) (-2.26) 12.94* (2.01) Participation * Tenure<12m for 55-64 0.191 (1.53) _cons 4.289*** 2.041 6.919*** 2.595*** 4.394*** 2.156*** 1.981* 2.392 (16.46) (0.94) (3.51) (6.62) (16.68) (3.39) (2.36) (1.95) # countries 19 19 19 19 19 18 18 19 # observations 425 425 425 425 425 334 334 130
The dependent variable is wage inflation. Wages are measured as the compensation of empoyees. (T Stats). All regressions include a country fixed effect.
Table 3: Estimates of wage Phillips curves in a panel of 19 OECD countries
Countries included in the sample: G7 countries, Spain, Netherlands, Austria, Belgium and Finland, Australia, Denmark, Norway, Sweden, Switzerland and Ireland and Portugal.
U. Rate differential above 55 - below 55
P. Rate differential above 55 - below 55
dP. Rate differential above 55 - below 55 Tenure <12 months for 55-64
Figure 6: Decompositions of wage inflation in Germany