Grande Ecole – Majeure Finance
R
ESEARCH
P
APER
Academic Year 2017 - 2018
How to value brands properly?
A case study on Huawei Technologies
Xiaoqi YANG
Yinghao CHEN
Under the supervision of Professor Patrick LEGLAND
1
Abstract
Brand, showing the identity of an object, has a long history in human life. As the consumption market develops in the modern society, it has been commonly acknowledged that brands constitute a significant part of the value of a business and bring added value to different parties including various stakeholders of the company, potential investors, and of course, consumers.
Thus, the valuation of brands, for both commercial and financial purposes, is becoming an increasingly interesting topic. Although the valuation of such intangible asset is not easy to identify due to the nature of asset, various methods have been developed by both the academic world and specialized professionals in the field.
This research paper will try to define the concept of a “brand” and “brand equity”, assess the major brand valuation methods and discuss different approaches, comparing their scope of application, assumptions, major features, advantages and shortcomings. A case study on the brand equity valuation of Huawei Technologies brand will be presented as a practical application of brand valuation methods, where specific studies on its business, market evolution and business projections will also be included.
In the end, we presented our recommendation on the design of appropriate methodology, estimation of key assumptions and comparison of results, as well as specification on the valuation of private company-owned brands.
2
Acknowledgement
We would like to express our gratefulness to those who have contributed to the completion of this research paper and those who have helped us achieve our academic goals throughout our studies in HEC.
First, we would like to thank Professor Patrick LEGLAND, who has directly instructed us on this research paper. He introduced us to this interesting topic of brand valuation during his courses, advised us on the overall structure of the research paper, and supervised the whole process, especially when we need guidance.
Second, we would like to thank all the professors and staff in HEC, who have equipped us with solid knowledge on finance and business management through insightful lectures. At the same time, the analytical mindsets and approaches on which we have been trained in practical case studies are indispensable for the completion of our research paper.
Third, we would like to extend our gratitude to all the people and institutions who have supported our studies in France: our family and friends, who love and care about us all the time; our home university Peking University, who has trained us as quick-learning and open-minded bachelor’s graduates who are adaptable in an international environment; Campus France, who has supported our studies and followed our projects; and the French community, who have shown welcome and kindness.
3
Table of Contents
1 Introduction: Brand and brand equity ... 8
1.1 What is a brand? ... 8
1.2 What is brand equity? ... 11
1.3 The importance of brand valuation ... 12
1.3.1 Valuation framework... 12
1.3.2 Commercial brand valuation ... 13
1.3.3 Technical brand valuation ... 14
1.4 Accounting standards for brand valuation ... 15
1.4.1 US GAAP accounting methods ... 16
1.4.2 IFRS accounting methods ... 17
2 Literature review of major brand valuation methods ... 19
2.1 Costs-based approach ... 19
2.1.1 Historical cost method ... 20
2.1.2 Replacement cost method... 23
2.2 Market-based approach ... 25
2.3 Income-based approach ... 27
2.3.1 General considerations ... 27
2.3.2 Price premium method ... 30
2.3.3 Royalty savings method ... 31
2.3.4 Demand drivers / brand strength method ... 35
2.3.5 Margin / profitability comparison ... 37
2.4 Real option method ... 38
2.5 Alternative valuation methods ... 42
2.5.1 Interbrand valuation method ... 43
4
2.5.3 Residual Method ... 47
3 Case study: Brand equity valuation of Huawei Technologies ... 48
3.1 Introduction ... 48
3.1.1 Presentation of Huawei Technologies ... 48
3.1.2 Choice of brand ... 53
3.1.3 Market analysis and strategies... 54
3.1.4 Financial analysis ... 58
3.2 Key assumptions and financial projection ... 60
3.2.1 Key assumptions ... 61
3.2.2 Financial projection ... 65
3.2.3 Enterprise Value (EV) estimation ... 67
3.3 Brand equity valuation... 68
3.3.1 Choice of valuation methods ... 68
3.3.2 Cost-based approach ... 69
3.3.3 Income-based approach ... 71
3.3.4 Real option method ... 77
3.4 Summary of valuation results and comments ... 81
3.4.1 Comparison with benchmark ... 82
3.4.2 Comments on high-level approaches ... 87
3.4.3 Comments on specific methods... 89
4 Recommendation on brand equity valuation ... 93
4.1 Design of appropriate valuation methods ... 93
4.2 Estimation of key assumptions ... 94
4.3 Results comparison ... 95
4.4 Specification for private company-owned brands ... 96
5 Conclusion ... 98
5
Appendices ... 102
Appendix 1 – Huawei Balance Sheet (Accounting View) ... 102
Appendix 2 – Huawei Operating Working Capital Projection ... 103
Appendix 3 – Huawei Discount Rate for Impairment Test on Intangible Assets ... 103
Appendix 4 – Global Mobile Phone Market Size ... 104
Appendix 5 – Factors Affecting Purchasing Decisions of Mobile Phones ... 105
List of Tables
Table 1 Huawei Income Statement (2013-2017) ... 58Table 2 Huawei Balance Sheet - Economic View (2013-2017) ... 59
Table 3 Huawei Cash Flow Statement (2013-2017) ... 60
Table 4 Huawei Comparable Brands ... 62
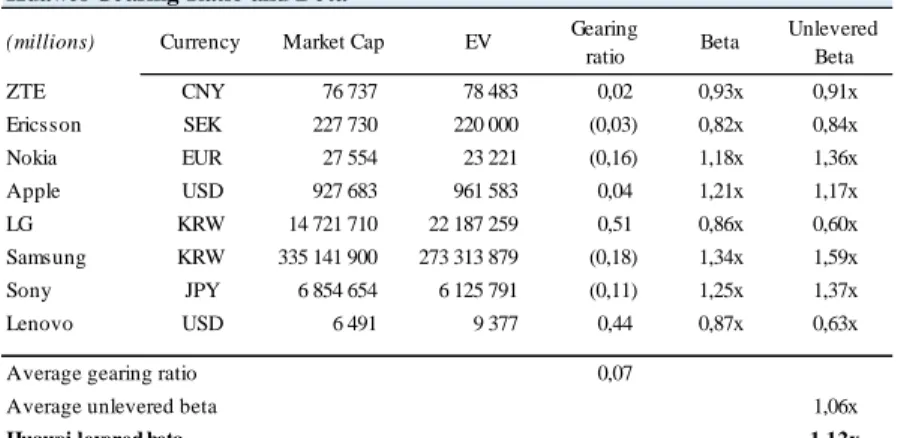
Table 5 Huawei Gearing Ratio and Beta ... 63
Table 6 Huawei Equity Risk Premium ... 63
Table 7 Huawei Cost of Debt (pre-tax) ... 64
Table 8 Huawei Effective Tax Rate ... 64
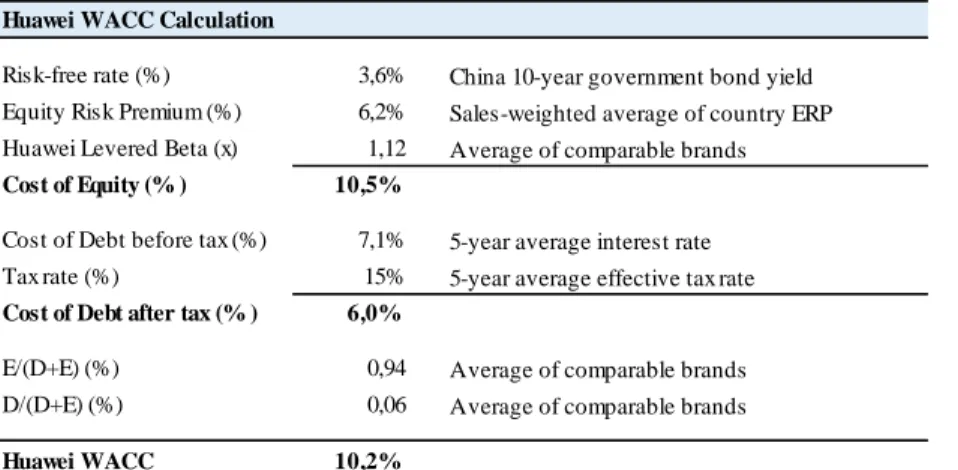
Table 9 Huawei WACC Calculation... 64
Table 10 Huawei Discount Rate for Intangible Assets ... 64
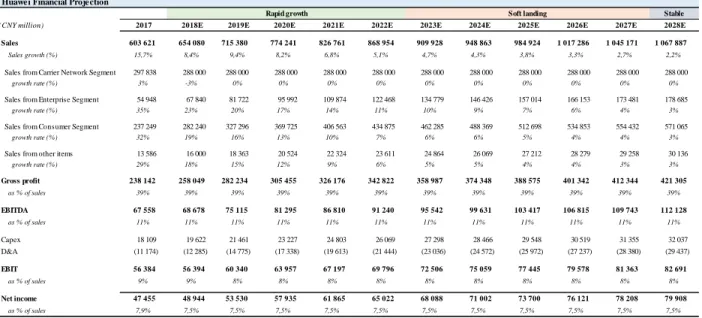
Table 11 Huawei Financial Projection (2018-2028) ... 66
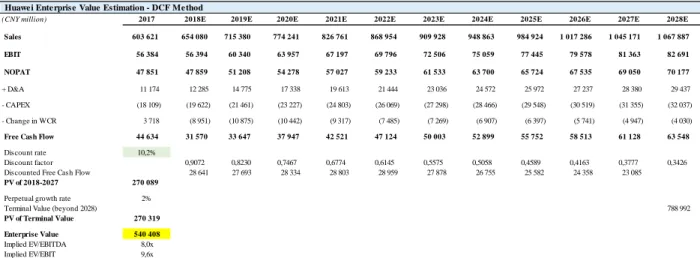
Table 12 Huawei Enterprise Value Estimation – DCF Method ... 67
Table 13 Huawei Enterprise Value Estimation - Multiples Method... 67
Table 14 Huawei Brand Equity Valuation – Historical Cost Method ... 70
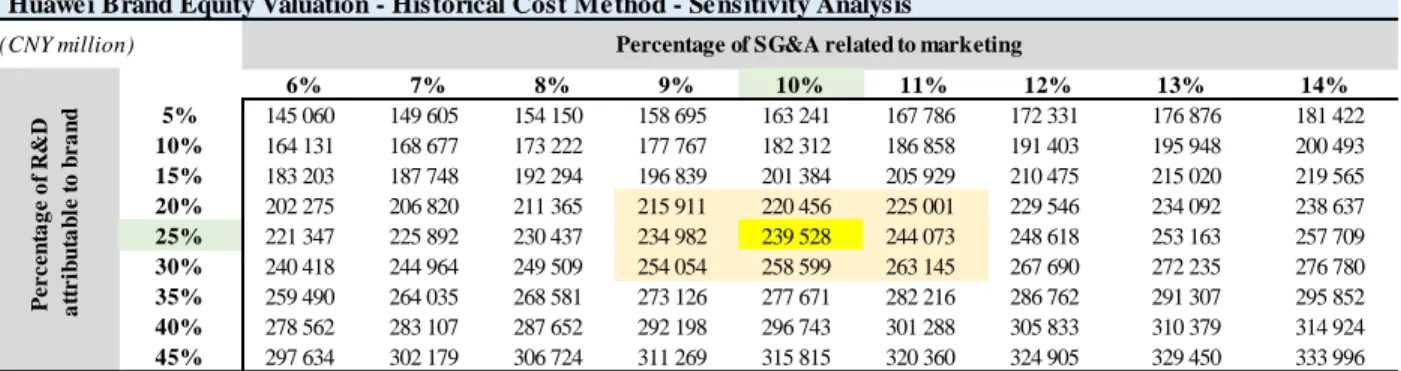
Table 15 Huawei Brand Equity Valuation – Historical Cost Method – Sensitivity Analysis ... 70
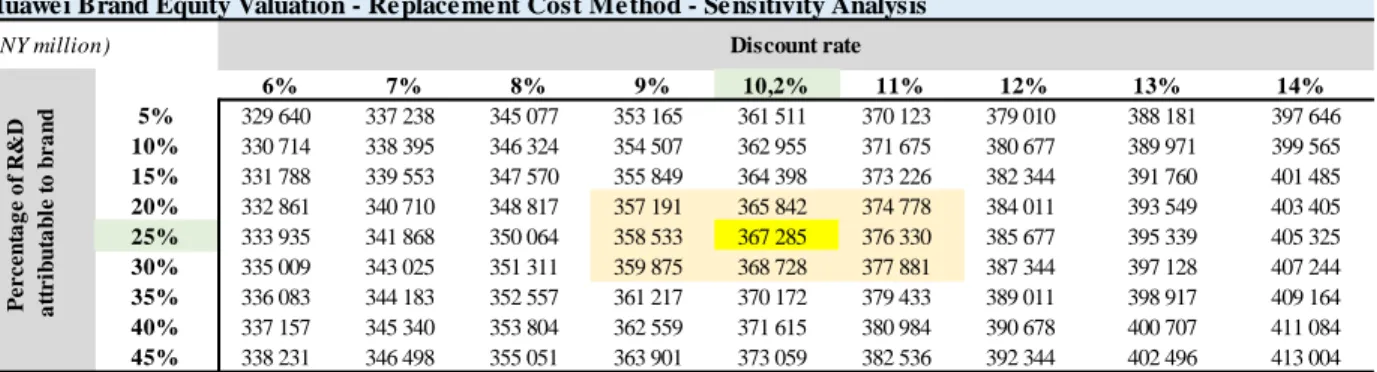
Table 16 Huawei Brand Equity Valuation – Replacement Cost Method ... 71 Table 17 Huawei Brand Equity Valuation – Replacement Cost Method – Sensitivity Analysis . 71
6
Table 18 Huawei Mobile Phone Price Premium... 72
Table 19 Huawei Brand Equity Valuation - Price Premium Method ... 73
Table 20 Huawei Brand Equity Valuation – Price Premium Method – Sensitivity Analysis ... 73
Table 21 Huawei Brand Equity Valuation – Royalty Savings Method ... 74
Table 22 Huawei Brand Equity Valuation – Royalty Savings Method ... 75
Table 23 Huawei Demand Drivers / Brand Strength ... 76
Table 24 Huawei Brand Equity Valuation – Demand Drivers / Brand Strength Method ... 76
Table 25 Huawei Brand Equity Valuation – Demand Drivers / Brand Strength Method – Sensitivity Analysis... 77
Table 26 Huawei Brand Equity Valuation – Real Option Method (1/3) ... 78
Table 27 Huawei Brand Equity Valuation – Real Option Method (2/3) ... 79
Table 28 Huawei Brand Equity Valuation – Real Option Method (3/3) ... 80
Table 29 Huawei Brand Equity Valuation – Real Option Method – Sensitivity Analysis (1/2) .. 81
Table 30 Huawei Brand Equity Valuation – Real Option Method – Sensitivity Analysis (2/2) .. 81
Table 31 Huawei Brand Equity Valuation – Summary of Results ... 81
Table 32 Huawei Brand Equity Valuation – Benchmark ... 83
Table 33 Comparison of brand valuation methods on reliability and efficiency ... 94
Table 34 Huawei Balance Sheet – Accounting View (2013-2017) ... 102
Table 35 Huawei Operating Working Capital Projection (2018-2028) ... 103
Table 36 Huawei Discount Rate for Impairment Test on Intangible Assets (2012-2014) ... 103
Table 37 Global Mobile Phones Market Value (2013-2017) ... 104
Table 38 Global Mobile Phones Market Value Projection (2017-2022) ... 104
7
List of Figures
Figure 1 Interbrand's Brand Valuation Methodology ... 43
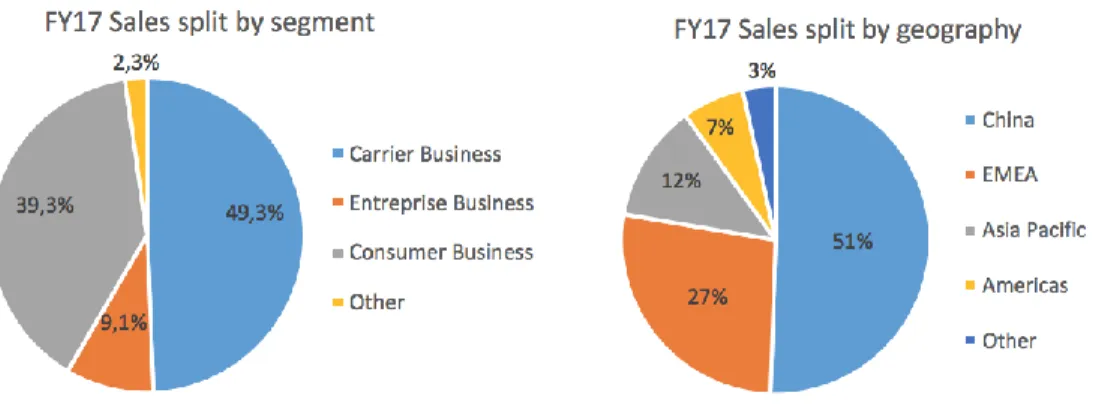
Figure 2 Huawei FY17 Sales Split by Segment / Geography ... 49
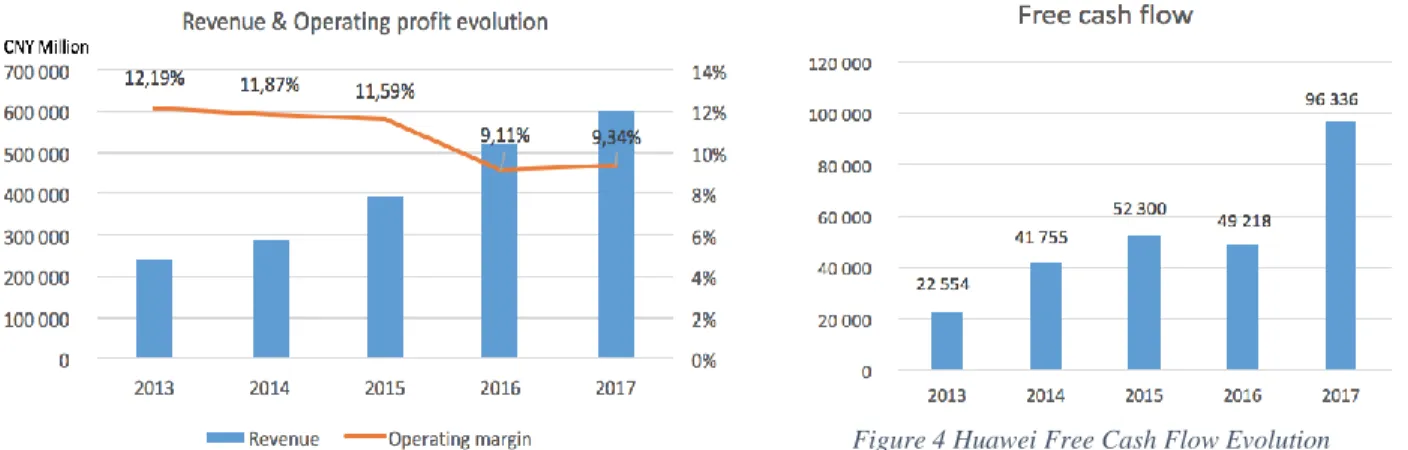
Figure 3 Huawei Revenue and Operating Profit Evolution ... 51
8
1 Introduction: Brand and brand equity
1.1 What is a brand?
A product is something that is made in a factory; a brand is something that is bought by a customer. A product can be copied by a competitor; a brand is unique. A product can be quickly outdated; a successful brand is timeless.
--Stephan King, WPP Group, London
Although the modern concept of “brand” has only been widely discussed and debated as an interesting marketing topic since decades ago, there is no doubt that brand is as ancient a concept as civilization itself. In fact, the word “brand” is derived from the Old Norse word brandr, meaning “to burn”, as a traditional means to mark the ownership on livestock with a hot iron, a method still used until today (Keller, 2003a). While since late nineteenth-century, due to the significant trends of industrialization and therefore the accompanied disruption of mass-production and development of mass-distribution, large manufacturers felt threatened by the emergence of a large number of competitors’ products circulating in the open market and were looking for a way to distinguish one’s products from another in order to earn customers’ long run loyalty with their specific brand. The modern concept of brand was introduced and gaining more and more power as a marketing tool in light of the emergence of intense competition among a huge number of players as well as a much easier access to various products in the market.
As the concept of “brand” evolves through years, however, the original idea which consists in defining the ownership has switched to emphasizing the quality of products (Yang et al., 2012) and communicating information (Moore and Reid, 2008). Today in the consumption society, brands are already everywhere and penetrate nearly all aspects of our daily life: food, clothing, electronic devices, nearly everything for daily uses are tagged with a brand. In the meantime, for any product, we find a flood of different brands which can sometimes really bring a headache to consumers when they make up their choice. One interesting question to bring up is, why consumers
9
would choose one brand over another? It’s true that people might choose Mercedes-Benz over some other car brands because of the high quality and better customer experience from technical aspects, but for some other commodity products, it’s sometimes hard for consumers to even tell the difference (Coca-Cola vs. Pepsi, for example). This is common within many industries today as companies invest huge money on product development and improvement, so that the functional differences can be lowered to nearly invisible for most common customers. Then why, among similar offers, many people still have preference for a certain brand name even sometimes that means a much higher price? The magic lies in the brand: as an article on Forbes points out, “People don’t have relationships with products, they are loyal to brands” (Why Brand Building Is Important, Scott Goodson).
In recent years, more and more research has been focusing on brand management and brand valuation and to start with this topic, we need to first look at the different roles a brand serves for both customers and companies and then we’ll explain why it’s gaining important attention for academic and practical reasons.
As the origin of the word suggests, a successful brand should first serve as a powerful tool of identification for the brand owner, that is to say, a differentiation factor which is well designed to create awareness among consumers about one or several specific products or service, then even better, about the company itself. For example, when we think of big names like Coca-Cola, Disney, Google, etc., it’s not only the red-bottle soft drink, cute cartoon characters or the searching engine that pop up in our head, but also the company’s founding history, rich cultural heritage and strong emotional liaison which turn out to be more powerful and sustainable with consumers. If we went through the history of modern brands, it is not hard to realize that the development of modern brands has been closely related to that of trademark and copyright laws. These increasing needs of identification or differentiation not only show the idea that a brand name can help customers rapidly find what they prefer in a sea of brands, but also emphasize the fact that the confidence or attachment of customers towards a brand comes firstly from the embedded brand identity. In the meantime, from customers’ perspective, a brand represents also an image of their personality. As more and more people in today’s society are willing to attach a “label” or a name to their
10
consumption, brands to some extent help demonstrate the personal image of the consumer through his or her act of choosing a certain brand over another.
Another important function of brands is the role as information carrier. A successful brand should tell a customer a huge quantity of information about its product: What is the nature of the product? How about the quality? What is the level of the price? etc. Furthermore, companies use brands as an implicit way to promise a consistent quality because customers will generally expect a certain quality level associated with a specific brand. For example, when we talk about Apple, we spontaneously link it to a wide range of innovative, high-tech electronic devices as well as high-quality after-sale customer services. This also partially explains why people would be willing to line up or order new iPhones online even before all the information of the new products are released by the company, that is, customers already form their understanding of the new products even before information is available. Brand itself communicates, stores and builds information which in turn affects customers’ confidence and lets them know what to expect when they place an order.
Brands also play an important role particularly for enterprises due to its potential of bringing added value, generating profits and fostering future growth of the business. A research conducted by Brand Finance shows that under the new economy, the total intangible assets would account for, on average, more than half of global enterprise value, replacing the tangible assets as the most important source of added value to a company. In certain sectors like software, internet and pharmaceuticals, intangible assets can even amount to around 90% of total value, which is significant in terms of value creation for a business. Brand, first of all as an intangible asset, shares the cash flow-generating feature like any other assets and impacts a business’s value through its influence on customer acquisition and business strength, thus it is significantly important to analyze a brand and arrive at a numeric valuation in order to better understand the growth perspectives of a company in the long run. In addition, getting a range of brand valuation can help the company position its brand among the peers through comparison.
However, one interesting point to be mentioned is that although in general, brand should be the most powerful base for the business value creation, it can at the same time play as a liability which in some way destroys the value of a business. For example, during the summer of 2010, Foxconn,
11
the China-based technology producer which manufactures iPhones and iPads, was labeled “the suicide factory” as a result of nine incidents involving employees leaping to death due to overly tough working conditions. This in turn led to a brand crisis for Foxconn who enjoyed little brand identity before and who suddenly needed a global PR to manage the brand image crisis and find a way to tell their story. What’s worth noting is that under such condition, Apple, the main customer of Foxconn, was afraid that their brand image could in turn be impaired by these incidents and had to step in and fix the problem.
1.2 What is brand equity?
As we already discussed the definition and main functions of brands above, we now move to the concept of brand equity, which was first used by advertising practitioners and marketing researchers in the 1980s and then became a popular topic with the introduction of David A. Aaker’s most important work, Managing Brand Equity, in 1991. In his book, Aaker defines brand equity as “a set of brand assets and liabilities linked to a brand, its name and symbol, that add to or
subtract from the value provided by a product or service to a firm and/or to that firm’s customers”.
To put it another way, brand equity refers to the aggregate of customers’ belief on the products or services. This concept of connecting brand with “equity” sets a milestone for studies on brands because it describes how brand helps to generate value for firms and that brands can actually expand its impacts beyond marketing tactics and become a decisive factor at the executive table.
One main reason why brand equity is gaining great interests stands at a strategic point of view that a company with a strong brand will be more capable of expanding their business, putting a price premium, gaining more market share and improving operating performance even within a fierce competitive landscape in the market. Brand equity is closely related to the longevity of the business and represents a powerful driver to influence the decision-making process of different parties like consumers, executives and investors. Thus, it is important to understand how the brand equity can be created, in other words, how the brand’s assets are integrated and strengthened to create value for both customers and companies.
12
As David A. Aaker introduced in his book, brand equity consists of five foundations: brand loyalty, brand name awareness, perceived brand quality, brand associations, and other proprietary brand assets like patents and trademarks. We will not go into details on the five factors since we do not focus on the marketing techniques in this paper, but it is necessary to understand that each of the five dimensions is interrelated with each other and collectively reinforce the strength of brand equity; in the meantime, more than being the inputs of brand equity model, the five dimensions can also act as outputs which result from an enhanced brand equity of the company. For example, if a company manages to enhance its customer loyalty by successful marketing strategies, the brand equity will be increased, while in turn the stronger brand should enhance customers’ stickiness to it. Since brand equity is largely based on the conceptual customer perceptions and experiences, it is not hard to find out that a strong brand equity then brings about value to consumers through various ways as we’ve discussed in the first part of this chapter.
Another reason for growing interests surrounding brand equity is financially based. For example, under the context of mergers, acquisitions and divestitures, there is often need for attaching a numeric value to the assets for accounting purposes and valuation justification. Thus, in the following part, we will discuss how brand valuation is useful under different contexts and its impacts on financial aspects of the company.
1.3 The importance of brand valuation
1.3.1 Valuation framework
Before we go into details on brand valuation methodologies, it is essential to first answer the question: what exactly is being valued when we speak of brand valuation? In fact, all brands first naturally come up with a certain business, so it is important to firs view a brand within its context of business when we conduct the valuation, and then as a brand matures, it separates itself from the product and becomes a more transferable asset.
The brand valuation framework consists of three scopes which, from the largest to the narrowest, are branded business value, brand contribution and brand value.
13
- Branded business value refers to the value of business operating under a certain brand name. In case of a mono-brand company such as Hermès and Nike, the branded business value should equal the total Enterprise Value.
- Brand contribution refers to the overall economic benefits derived from a brand. A company with one or several strong brands benefits from stronger bargaining power with stakeholders like consumers, suppliers and investors, thus enhance their value creation through higher price premiums, larger sales volumes, combined with lower operating and/or financing costs over other generic products or weaker brand products.
- Brand value captures a more specific valuation of the brand as an intangible asset, which by definition in International Accounting Standard (IAS) 38, refer to “identifiable non-monetary asset without physical substance”. Under such scope, we usually assume that the brand can be sold or transferred and arrive at a value directly linked to the transferable element of the brand, which generally is the trademark. Brand value measures how much operating income and free cash flow are generated by the brand, taking into account the brand’s power on sales and cost control as well as consumer purchase decisions.
1.3.2 Commercial brand valuation
For brand managers or advertising practitioners, their definition of brand valuation is more often focused on the first two scopes, that is, branded business value and brand contribution. Since companies can realize significant economic value generated from their brands, there have been increasing needs for effective brand management, making sure the alignment of brand image with other tangible and intangible assets of the business. In this case, brand valuation is mostly used for commercial purposes and managerial decisions, including but not limited to:
- Brand architecture: to strategically build up a “family tree” of brands and better define the relationship between the parent brand and various child brands.
- Market strategy: to create a long-term strategic plan for marketing campaigns and other commercial activities.
- Resource and budget allocation: to efficiently allocate resources among different business units based on their brand power.
14
- Performance quantification: to measure the return on brand investment and compare key metrics with other peers in the market, or to quantify and discuss the marketing results at the board meetings. In addition, brand valuation provides a way to explain financial performance of the firm through qualitative metrics such as consumer satisfaction, brand awareness, etc. - Risk mitigation: strong brands can create steady if not increasing demand into the future, thus
ensuring less risky returns on investment.
Thus, marketing people often highlight the broader impacts of brand brought to the business and don’t go calculate the “trademark” value since it is of little commercial interest for them.
1.3.3 Technical brand valuation
However, what interests us in this paper is the so-called brand valuation for “technical” purposes or financial uses. Instead of showing the total value of a branded business, the term “brand valuation” in the rest of this paper will refer to the value created by a brand as a separate asset or as an asset arising from contractual or legal rights.
For financial-linked purposes, brand valuation can be useful in the following contexts:
- Licensing Arrangements: to decide the optimal royalty rate that the company can exploit for a licensing agreement, or alternatively, co-branding opportunities. Also used for any transfer of brands between two subsidiaries of the consolidated group.
- Merger and Acquisition Planning: to evaluate mergers or acquisitions opportunities using brand valuation to help price the arm’s-length sale of the target’s brand assets and identifying how the acquisition brand would add or destroy value post-transaction.
- Joint Venture analysis: to maximize the value creation contributed by brands in case of joint ventures or partnership relations by measuring the equity allocations and establishing optimal profit sharing mechanism between different parties.
- Tax purposes: to establish a most tax-efficient strategy regarding a certain brand. For example, if the company operates globally and is able to locate the brand ownership in a low-tax rate country and increase the proportion of profits generated from that jurisdiction, then the firm can benefit from less tax payment.
15
- Accounting compliance: to capitalize brand assets on the balance sheet for internal and/or external financial reporting uses, according to different accounting standards such as US GAAP, IAS and other country-specific requirements. Useful for preparing the acquisition accounting, the derived value first recorded on the balance sheet can later be tested periodically for impairment needs. Although there are still a lot of debates on whether to put brand on the Balance Sheet to better narrow the discrepancy between the company’s stock price and their tangible assets, most companies do include discussions on their brand value in a separate section of the financial report if they would love to inform their shareholders of such information.
- Litigations: to quantify the asset lost profits, impacts on royalty rate or other economic damages arising out of legal defense or any disputes involving trademark violation.
- Securitization: to leverage the brand’s economic value and use it as a financing collateral for cash flow-based for asset-based debt facilities.
- Investor relations: to better communicate the performance and growth perspectives of the company since academic research has shown evidence that strong brand value contributes to shareholder’s return.
- Regulatory compliance and corporate governance
From the uses of brand valuation listed above, we can conclude that brand valuation can serve from many different perspectives and bring added value to different parties including the company, its employees, investors and customers. Thus, brand valuation is a very important topic for both academic and practical reasons.
1.4 Accounting standards for brand valuation
In this section, we will briefly introduce the brand recognition methods under the main accounting frameworks: US GAAP (Generally Accepted Accounting Principles) and IFRS (International Financial Reporting Standards).
16
1.4.1 US GAAP accounting methods
In general, the company can develop its brand in two ways: it can simply purchase an existing brand from another company which incurs a purchase price or it can build and develop a brand internally which generates historical costs in advertising, marketing, etc.
For the acquired brands, the amount recorded on the book is recognized as the goodwill which is usually derived using Purchase Price Allocation methods. The idea is when acquiring a company, the purchase price is often higher than the net asset value of the target and this premium is due to the fact that the brand account for a large portion of the market value of the company, and goodwill is thus recorded on the balance sheet to reflect the exceeding amount over the book value. For internally developed brands, the value of the intangible assets is not recorded on the book, only the costs associated with the creation, development, maintaining of brand are recognized as expenses. Such expenses as hard material costs, research investment, advertising costs, etc. can be used for calculating the brand value because they are directly linked to the brand development and contribute to the brand value enhancement.
Normally, as the value is initially recognized on the book at the historical cost, there should be no revaluation of such intangible assets, and the asset value would remain at the historical level (that is, the purchase price) unless there are amortization or impairment adjustments.
For intangible assets with limited life of use, according to the accounting methods, the accountant should choose an appropriate amortization schedule which assumes the value of the asset will reduced to a certain residual value in a certain period of time. However, brand assets are usually considered as having indefinite lives, thus there should be goodwill impairment testing during the lifetime of the assets. The impairment is incurred when the carrying value of assets are superior than the market fair value. In such case, when the value on the book is actually inflated, there should be an asset write-down of the amount which equals to the difference between fair value and carrying amount, that is, the impairment of goodwill. Such impairment loss can happen due to several reasons: perhaps the initial premium was too high which overpriced the brand value of the acquired business, or there was a market downturn or negative economic impact which in turn impacted the brand value, etc. The main idea of such impairment is to check if the value of
17
the brand is broadly in line with the market. However, it is true that assessing fair value of a brand can be difficult due to lack of enough transactions, yet existing market data and brand analysis from consulting agencies and valuation service providers will give a good estimation for comparison.
Once the impairment is done, the reversal of such loss is not allowed under GAAP accounting standard. Also, revaluation of intangible assets can only allow a write-down of asset value, which means that if the fair value is actually higher than the historical cost recorded, there should be no according adjustments.
Since brand value is not a mandatory information to release to public in the annual financial report, the company can decide if or not to include the brand valuation in their notes or how detailed they would love to publish relevant information. However, today more and more large-scale companies with a well-recognized brand would love to include in their financial reports a discussion of their brand assets, because as stated in the previous parts of this chapter, brand assets are of great value to the company, and is a good signal for investors to understand the key drivers of the business’s future growth.
1.4.2 IFRS accounting methods
Under IFRS accounting standards, some differences are introduced while most of the general rules for recognizing intangible assets under GAAP still apply.
For most of the time, internally developed brands shall not be recognized on the balance sheet unless the brand is acquired from another company or from a merger transaction. When recognizing costs, however, IFRS categorizes the “research phase” and “development phase” based on the stage and purpose of activities. Costs generated in the “development phase” which satisfy certain criteria will then be capitalized, while other costs such as advertising will be recognized as expenses when incurred.
When conducting impairment testing, IFRS uses the concept Cash-Generating Unit (CGU), which is the defined in the IAS 36 as “the smallest identifiable group of assets that generates cash inflows”. Similar to GAAP, IFRS then compares the recoverable amount of the CGU with the
18
carrying amount, if the latter is higher, then the difference of two amounts will be recognized as an impairment loss.
19
2 Literature review of major brand valuation methods
Chapter 2 presents a literature review of the major brand valuation methods. We focus on both academic research papers and methodologies developed by practitioners in the market, in order to understand the rationales of each approach and method and how they are used in practice.
We categorize the brand valuation methods into higher-level approaches: cost-based approach, market-based approach, income-based approach and other approaches.
1) The cost-based approach, as the name suggest, focuses on what has been spent to create the brand equity value estimates brand equity value by calculating past investment in R&D and marketing activities. Major methods include historical cost method and replacement cost method.
2) The market-based approach believes in the power of “market pricing” and estimates the brand equity value based on comparable transactions of brands.
3) The income-based approach focuses on how the brand creates value and estimates bran equity value based on future financial benefits generated by the brand. This approach is the most commonly used in practice. Major methods include price premium method, royalty savings method, demand drivers / brand strength analysis method and margin / profitability comparison method.
4) Other approaches include real option, CAPM model and residual method.
2.1 Costs-based approach
The cost method could be derived from an old value concept “Labor Theory of Value” advocated by some early economists like Adam Smith, who argues that instead of the demand and supply curve that we usually use to find the optimal market price of a product, the economic value of a good or service could be measured by the average number of necessary labor hours required to produce it. The principle of this method is quite straightforward: as companies are willing to invest huge amount of money, time as well as human capital into the brand creation and development, we could create a direct link between the whole investment amount and the eventual
20
brand value, and then we calculate how much to spend in order to build or reproduce a brand of equivalent strength and utility to the company by the given valuation date (Anson, Noble, Samala, 2014).
In the BSI ISO: 10668, the cost method is defined as follow:
“The cost approach measures the value of a brand based on the cost invested in building the brand, or its replacement or reproduction costs […] it is based on the premise that a prudent investor would not pay more for a brand than the cost to replace or reproduce the brand. The actual cost invested in the brand shall encompass all costs spent on building the brand up to the value date.”
As stated above, usually the cost-based approach can be further divided into two sub-methods, historical cost method and replacement cost method.
2.1.1 Historical cost method
Using historical cost method, one takes into account all the historical costs spent in creating and developing the brand if it is built internally from inception or the costs spent since the recognition of the brand if it was acquired from outside.
Identifying the costs that should be incorporated in the calculation is crucial to this method. Theoretically, all the costs which contribute to the brand building should be considered. As Anson, Noble and Samala presented in their paper “IP Valuation: What methods are used to value
intellectual property and intangible assets?”, there are mainly three categories of costs:
- Hard costs which refer to purchase of materials and relevant asset
- Soft costs which refer to immaterialized expenses like personnel expenses, engineering time, designs, etc.
- Market costs which refer to general advertising, marketing, market testing and communication expenses for the purpose of enhancing brand strength
21
One interesting point that Anson, Nobel and Samala brought up in their paper is, apart from the direct costs generated from branding activities, opportunity costs should also be taken into account. Imagine that there is suddenly an unexpected strategic shift of the Management or fierce market competitive landscape which in turn cause a delay or even failure of market entry, that means there are opportunity costs related to such event. In their example showed in the paper, the authors used a “multiplier for opportunity cost” which is above 100% and then multiplied by the sum of costs on the book to arrive at the total brand value today.
Pros and Cons
The main advantage of historical cost method lies in the simplicity or the ease to conduct and the fact that it is objective despite who conducts the valuation. As straightforward it is, there is no need for any assumptions to make in this approach, although one might argue that there would be differences regarding the appropriate accounting items chosen for the valuation, yet it is simply a sum of accounting numbers and gives a quick global idea of the brand value. Even different parties should arrive at similar results and when there’s disagreements, it’s also easy to put it on the table, check numbers and clarify the differences. By nature, it generally provides a floor value for the brand (Anson, Nobel & Samala, 2014), so it is good for valuator to have an idea on the minimum value represents the brand. In addition, historical cost method can be effectively used at the very early stage of brand building because as business grows and matures, some specific market application or benefits can be identified, and the initial costs on the book related to technology investment will be likely to far differ from its true value (Anson, Nobel & Samala, 2014).
In terms of shortfalls, however, historical cost method does suffer from a couple of problems: Firstly, the process to aggregating the costs can be a time-consuming and troublesome matter. To sum up all the historical costs that are invested in brand creation and development, one should carefully review the financial statements and related notes of all past years since inception of brand and identify which expenses or cash flows are attributable to brand building. The question is, should all periods be included for the calculation, and if yes, how to deal with all the old brands with perhaps a hundred of years’ history and the earlier financial accounts might not be found?
22
Then, even though the step of identifying and classifying costs can be already quite tricky because it is hard to sort out all the expenses that directly or indirectly contribute to brand, the next step of telling how much percentage of each item should we take into account should not be any easier. Furthermore, after we capitalize marketing costs, we have to decide a way to schedule the amortization during brand’s expected life, which can also make a difference to the valuation.
Secondly, Past costs cannot be a good guide for current value. The method ignores the time value of money and any impacts caused by inflation. This shortcoming can be partially offset by the method proposed by Reilly and Schweihs, who suggest adjusting the actual cost of launching the brand by inflation every year. Another fact explaining this shortcoming is that even costs for same activities can actually vary a lot in different times and situations. For example, marketing campaigns could cost less if they were conducted several decades ago or given the context that there existed fewer competitors in the market, but imagine today if we want to create a brand with the same market power and position, is it still possible to spend the same amount of money to build up image and acquire clients? Not realistic. For example, if we only look at the historical marketing costs of Coca-Cola, since it is an old brand established long time ago, it benefited from the lower level of costs previously and thus leads us to a much lower brand value.
Thirdly, recapture of all historic costs can be difficult and as a company develops its brand, it also generated long-term non-cash investments which cannot be accurately recorded on the financial reports with an exact number. For example, professional training and evolvement of employees, the quality control of products, the development of team culture and spirit, specific professional expertise built through time, etc. All these items do affect the true brand value because they strengthen client’s confidence and build brand image and trust over time. Another example should be the opportunity cost in brand building which is linked to giving up the price premium in order to gain more customer loyalty (Kapferer, 2012). Kapferer points out that sometimes companies compensate a higher price for an upgraded product compared to their peers just to be more attractive and enhance the brand’s market power. However, according to the historical cost method, all such effects are not taken into consideration.
In addition, is there necessarily a direct link between the financial investment amount and the brand value of the company? It is reasonable to think of a case where the company spent loads of
23
money but still failed to build up a brand, and what if the brands that we are evaluating also face the same problem? Since the company can make bad decisions, the marketing team could be not competent enough or that the expenses were not used efficiently, we can never know how much proportion of the financial investment are in fact working and contributing to the brand.
Moreover, the competitive position of the brand is also neglected in this method. In addition to all the costs recorded on the financial statements, management plays an essential role in bringing about value and enhancing or destroying reputation of the brand. Marketers whose work is focused on adding value to the brand through strategic plannings would definitely reject the historical cost approach because it doesn’t reflect all the results from improved brand management in the book account. Thus, even if we imagine two companies with exactly same expenses on brand, they can arrive at considerably different value if one managed and ran the brand well and the other managed it poorly.
Finally, since the method is only using past figures on the book, it fails to evaluate the brand earnings potential in the future. This, by nature, is probably the most important flaw of cost method because when we value a brand or company, we are always supposed to focus on the future rather than historical results. The efficiency of money spent with brand development can be a concerning issue and consequently, the costs incurred in the past tell us nothing about the brand’s future potential even when they are fairly adjusted to current price levels.
In a word, historical cost method should generally deliver the most conservative value compared to other methods (Seetharaman, Nadzir & Gunanlan, 2001), but it has several flaws which make it an impractical method taken in real life.
2.1.2 Replacement cost method
Like historical cost method stated above, replacement cost method is also based on the sum of relevant costs attributable to brand building, however, the difference is instead of summing up the past figure, we look at how much to spend today in order to recreate or purchase a brand of an equivalent utility to the company (Anson, Nobel & Samala, 2014), that is to say, with similar brand image, value proposition, market visibility, etc.
24
Pros and Cons
In terms of advantages, replacement cost method can be seen as an improvement of historical cost method because it is valuing the brand using the cost level today thus considering the time value of money.
Kapferer (2012) stated that when we consider recreating a brand today, we should depart from a number of characteristics of the brand including market share vs. competitors, brand awareness and image, geographic coverage, distribution channels, etc. While then when it comes to do practice, this method is only way more complicated. It cannot overcome all the problems of historical cost method while at the same time raising some new concerns. Kapferer (2012) pointed out that for some old giant brands, it is impossible to recreate them because the context of brand building is not even similar anymore today.
Firstly, some brands were first created in a period when the marketing expenses were small enough and brands counted more on word-of-mouth marketing. While today it won’t work anymore because of the huge customer base and fierce competition. Kapferer argues that the only possibility to make “unaided awareness” happen is kicking out a competitor in the field due to the effect of memory blocks. However, no one would be willing to leave the ground in this case. Secondly, this method neglects the already established success of the brand. Who has the confidence to recreate the brand Coca-Cola today with the same performance? Brands who are first-movers or early players definitely have a competitive advantage over others and if they turn out to be successful, it is hard for others to imitate. The specific know-how, brand image and a strong culture are all cumulated through time and impossible to be recreated from scratch. Kapferer (2012) also points out that purchasing an existing strong brand is way more safer and more preferred than recreating a brand. We’ve seen several failures in new product launches and companies more favor takeover bids to get other brands under their umbrella.
Compared to historical cost method, replacement cost method is more subjective since it requires opinions from different parties and the procedures are ambiguous (Kapferer, 2012). However, although the cost methods are not really practical in real world, it is a methodology which offers us a minimum value which can help construct the valuation range.
25
2.2 Market-based approach
The market-based method, as defined, is based on the market transactions of brands. It is defined under BSI ISO:10668 as follow:
“The market approach measures value based on what other purchasers in the market have paid for assets that can be considered reasonably similar to those being valued. […] Data on the price paid for reasonably comparable brands shall be collected and adjustments shall be made to compensate for differences between those assets and the brand under analysis. For selected comparables, multiples shall be computed on the basis of their acquisition price. Those multiples shall then be applied to the aggregates of the subject brand.”
According to this definition, it is not hard to conclude that market approach is based on the idea when a brand is sold, the price can be defined using comparable transactions in the market assuming that the asset in question is not unique. Just like using the transaction multiples in merger and acquisition deals for corporate valuation, we can also use multiples to derive a proper brand value. The process is similar:
- First, search for all the recent sales and transaction that involve similar brand assets operating in same or similar business, geography, of similar size and market position. The more similarity between the assets, the more representative the comparables are.
- Then, choose the multiple metric. The core step of this method is to find an appropriate multiple metric, that is, the price divided by an accounting item such as EBITDA, sales or net income. These are the most commonly used metrics, but other metrics can also be useful depending on the industry. For example, for hotels, we might find RevPar (Revenue per average room) a more interesting key metric when conducting analysis. Furthermore, we should use multiples that are relatively consistent within the industry, that is to say, if we find a lot of variations through our sample, the corresponding one might not be a good indicator.
- Calculate the sample average of the multiple or use the median of the sample. - Finally, apply the multiple to the target’s accounting metric and get the value.
The assumption behind this method is that the open market is efficient enough that the transaction price can correctly reflect the value of the assets, or at least, fall in right range of the
26
value. In general, the open market transactions often reflect the highest value at which the purchaser and seller are willing to enter the transaction. When one party would love to sell the brand, it is logical to get reference on recent similar transactions, given that enough similarity between brands should suggest similar multiples, and the two parties will both act in their best interests to get a fair enough price. Brealey and Meyers (1991) suggest that when the price proposed is higher than the net present value of the profits generated by the brand in the future, the buyer should accept the price.
Pros and Cons
The big advantage of market transaction multiple method is that it is reliable and useful when there’s enough data available, because the market transactions are generally assumed to be rational and objective. Simply as the name puts, the market approach should be used when there’s an active market environment where truly comparable transactions and relevant data can be found. However, when applying the multiple, it is important to make adjustment depending on the differences of transactions (strategic buyer, embedded future options, etc.).
Although market approach should be useful for valuation, the lack of data can make it not applicable in real life. Unlike tangible assets which are more frequently exchanged in the market where public information can be found, intangible assets are not often bought and sold, and among the transactions in the market, often we do not find true comparables because the market position of brands in the same industry can be very different, or we fail to get access to data because of the fact that company do not always disclose relevant brand value in the transaction. In addition, as discussed above, the market approach is based on the assumption of market efficiency, so that if there has been a brand mispricing in certain industries due to bubbles or temporary recessions, the brand will be mispriced and this effect will still to be carried on to the future. Especially for brand assets which have a relatively short history of transaction and smaller pool of data available, the market might not have a good sense of the right valuation which reflect the features of the company’s intangibles. In this case, the market method can also be complicated because there’s a need for evaluating the features of the target’s brands rather than simply taking the average (Bojraj and Lee, 2002).
27
2.3 Income-based approach
The value of a brand lies in its capability to generate future financial benefits, and therefore equals the present value of these future financial benefits linked to the brand. The income-based approaches assess the value of brands by estimating the value of future revenues, profits or cash flows that are attributable to the brand through its useful lifetime, which are then converted to a present value by discounting or applying a multiplier (capitalization factor).
The income-based approaches give a rather intrinsic estimation of the brand value because they follow the origins of the value of brands, while it usually requires a large number of inputs and assumptions and time-consuming modelling process. Salinas and Ambler (2009) groups the major income-based methods into 12 groups. We focus on the four major income-based methods most commonly used in practice: price premium method, royalty savings method, demand driver / brand strength analysis method and margin / profitability comparison method.
2.3.1 General considerations
Generally, there are two methods to factor the risk level into the valuation: discount rates and multiples. According to Salinas and Ambler (2009), 57% of income-based methodologies use discount rates to deal with risk.
2.3.1.1 Discount rate
The discount rate is the rate at which a future value is converted to present value. It reflects the time value of money at a certain level of risk, and therefore equals to the required rate of return specific to the brand.
Some practitioners use WACC (weighted average cost of capital) of the firm who owns the brand as the discount rate in calculating brand equity value. This method is easy to apply, and could be suitable when the firm owns and manages a single brand, as the WACC of a firm is highly accessible and confirmed by auditors if the firm is public. Some argue that the risk of intangible assets is generally higher than that of tangible assets, and therefore that of average business risk,
28
and that appraisers should apply a discount rate higher than the WACC of the firm who owns the brand even if the brand is the single brand that the firm owns and manages.
According to the analysis by Salinas and Ambler (2009), 55% of the methods that use discount rate as treatment of risk adjust the discount according to the specific brand risk, while 45% of them apply either WACC or CAPM (Capital Asset Pricing Model) model.
For example, The Advanced Brand Valuation (ABV) model of GfK-PwC-Sattler proposes to calculate brand-specific risk premiums in relation to a “brand risk score” based on six risk factors (psychological strength according to BPI, historical development, market share, distribution, repurchase rate and aided awareness).
The choice of discount rate significantly impacts the outcomes of income-based brand valuation methodologies. However, choice of an appropriate discount rate that fairly reflect the brand-specific-risk is “more of an art than a science”.
2.3.1.2 Multiplier
An alternative method that deals with risks is to apply a “multiplier”, also called a “capitalization factor”, to the value of a reference period. Using a multiplier is based on the assumption that the ratio between brand equity value and the estimated cashflow or profits of a certain period can be forecast. A higher multiplier represents lower volatility of future cashflows and profits from a stronger brand, while a lower multiplier represents higher uncertainty of future cashflows and profits from a weaker brand. This method requires a single value of a certain reference period, which can be of either one year or average of multiple periods and therefore, either actual historic or estimated future value, and therefore is quick and flexible to apply.
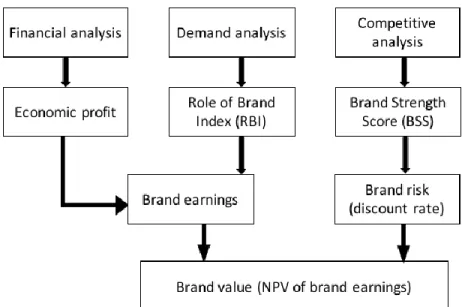
For example, Interbrand developed in 1988 the multiplier model (“Annuity Model”), where brand equity value is calculated by three-year weighted average earnings attributable to the brand multiplied by a “brand strength multiplier”. This multiplier is similar to a P/E ratio (Price-to-Earnings ratio) and reflects the position of the brand among its competitors and an outlook of its future performance in the market. The multiplier (ranging from 0 to 20) is determined by the brand’s brand strength score (ranging from 0 to 100) on seven aspects, including leadership,
29
stability, market, international image, trend, support and protection. The relationship between the multiplier and the brand strength score is S-shaped, which takes into consideration the weak position of a completely new brand, rapid growth after a brand gains awareness and low or even stagnating growth of a dominant brand.
2.3.1.3 Brand useful life
Another consideration is the remaining useful life of a brand. It is widely assumed that a brand has indeterminate life, but there are factors that can impact the useful life of a brand.
Lifecycle: A brand typically goes through five phases – development, introduction, growth, maturity and decline. It is necessary to understand which stage the brand is currently positioned in order to determine the appropriate remaining useful life of the brand.
Functional versatility / technological innovation: Products could suffer from functional or technological obsolescence with the introduction of new generations of products or substitutes, while brand life is not limited if products develop and keep up with customers’ changing needs and technological innovation. Therefore, it is important to take into account the brand’s capacity in research and development of technology and new products.
Generality: An umbrella brand generally has longer life than its sub-brands, because the risk of sub-brands being obsolete is diversified at the umbrella brand level.
Termination events: A brand’s life can go to an end and will hardly recover when certain events occur, for example, a deadly scandal or government bans.
2.3.1.4 Projection period
The projection period is determined in relation to the brand’s lifecycle, and should theoretically cover development, introduction and growth stages, as projection parameters vary significantly during these stages and therefore should be carefully treated respectively. Maturity and decline stages are more stable and could be captured by a terminal value.
30
2.3.2 Price premium method
2.3.2.1 Presentation of price premium method
The price premium method estimates the brand equity value by calculating the incremental profits or cashflows generated from the price premium, the difference in price of a branded product compared to that of an unbranded, weakly branded or generic equivalent product. The assumption of the price premium method is that brands provide additional value for customers and therefore are able to charge a price higher than that of an unbranded equivalent product. Brand equity value equals the present value of the after-tax extra profits from the price premium attributable to the brand.
The volume premium method estimates the brand equity value by calculating the incremental profits or cashflows generated from the volume premium, by reference to an analysis of the relative market shares. The assumption of the volume premium method is that brands contribute to gaining larger market share compared to an unbranded product at the same price level.
These two methods are typically used in conjunction to determine the full impact of brands on generating demand.
2.3.2.2 Conjoint analysis
The conjoint analysis studies how much brands impact customers’ purchasing decisions by customer survey. Customers are asked to specify their preferences between different combinations of attributes (for example, brand and price) of their purchasing decisions, which allows the appraiser to understand how much the brand attribute to customers’ purchasing decision, and further the brand’s ability to charge a price premium.
Ferjani, Jedidi and Jagpal (2009) proposes a conjoint approach for consumer- and firm-level brand valuation, which captures the four components of brand equity identified by Keller and Lehmann (2006): biased perceptions, image associations, incremental value and inertia value. This approach starts with establishing the customer’s utility function and examining the case in which the customer transforms attribute information into perceived benefits. Given the budget constraint,
31
market prices, perceived and objective attribute value for each brand and brand image associations, the indirect utility function provides the impact of each of the four brand equity components. A simpler alternative is to work with objective attribute values and infer the impact of attribute perception bias and image associations on brand values from the model.
2.3.2.3 Hedonic pricing model
Hedonic pricing model is a statistical model presented by Sherwin Rosen in 1974 in order to identify price factors and how price factors impact the price. In this model, price p is a function of a package of price factors z, and coefficients 𝛽 denote the impact of each price factor on the price
𝑝(𝑧) = 𝑝(𝑧1, 𝑧2, 𝑧3… 𝑧𝑛) = 𝛽0+ 𝛽1∗ 𝑧1+ 𝛽2∗ 𝑧2+ ⋯ + 𝛽𝑛∗ 𝑧𝑛 + 𝜀
This method has been used in setting the transfer price of intangible assets, and could be useful in brand equity valuation. In the context of brand equity valuation, brand is considered as a price factor, and its corresponding coefficient is the impact of brand on price. It allows appraisers to calculate the price premium - the difference in price with and without brand.
2.3.2.4 Advantages and disadvantages of price premium method
The advantage of this method is that it uses statistical techniques, which reduces subjectivity. The disadvantage of this method is that it is usually complicated to apply and requires tremendous work in data collection. At the same time, it introduces subjectivity at a different level: the conjoint analysis introduces unreliable elements; the Hedonic pricing model requires selection of price factors, which could be subjective.
2.3.3 Royalty savings method
2.3.3.1 Presentation of the royalty savings method
The royal savings approach determines the brand equity value by estimating the “royalty cost” payable in order to use the brand as if the company did not own the brand and had to get a license
32
from a third party. The brand equity value is therefore the sum of the present value of royalty savings after taxes over the lifetime of the brand.
Royalty relief method is one of the most commonly used income-based brand valuation methods. It has been developed by various brand valuation providers, yet with the least variation, compared to price premium method and the demand drivers / brand strength method.
Five steps are to be followed:
1) Estimate future revenues (net sales) for a given forecast period 2) Establish the royalty rate range
3) Assess the brand strength 4) Determine the discount rate 5) Calculate brand equity value
𝐵𝑟𝑎𝑛𝑑 𝑒𝑞𝑢𝑖𝑡𝑦 𝑣𝑎𝑙𝑢𝑒 = ∑𝑅𝑒𝑣𝑒𝑛𝑢𝑒𝑡∗ 𝑅𝑜𝑦𝑎𝑙𝑡𝑦 𝑟𝑎𝑡𝑒 ∗ (1 − 𝑡𝑎𝑥) (1 + 𝑑𝑖𝑠𝑐𝑜𝑢𝑛𝑡 𝑟𝑎𝑡𝑒)𝑡
𝑇
𝑡=1
2.3.3.2 Determination of royalty rate
The key element in this method is the “royalty rate”, which generally takes appraisers the most time and effort. The royalty rate should be set as the transfer price of two unrelated parties, according to the assumption of this method, and could be estimated by referring to similar brands and existing licensing contracts.
There exist various methodological options to determine the royalty rate.
2.3.3.2.1 Method based on brand strength and market comparables
Firstly, a range of the royalty rate can be established from comparable licensing agreements of relevant products in the same industry. It requires detailed analysis of the key clauses of the contracts, such as duration and termination provisions of the agreement, the license’s exclusivity, negotiating power of the parties, the product’s life cycle, market conditions and the level of operating margin.
33
Secondly, the brand strength is analyzed relative to the brand’s competitors. This analysis is usually starts with certain elements and characteristics of brand strengths, and could be quantified by applying scores to each element, weighted by the importance and relevance of the elements. This analysis gives a relative outcome of the strength of the brand in question compared to that of its competitors, which could impact the royalty rate level of the brand in relation to the industry royalty rate range.
Thirdly, a specific royalty rate is determined for the brand in question taking into consideration of the industry royalty rate range, key clauses of licensing contracts of comparable brands and the brand’s relative strength.
2.3.3.2.2 Rules of thumb
An alternative to a detailed brand-by-brand calculation is to apply rules of thumb that are generic to all cases. Rules of thumb is quick to apply and gives a control check that complements the royalty rates given by other methods, while further use is not recommended given the generic nature of this method.
Two general guidelines in determining the royalty rate are 25% of operating profit and 5% of sales. These rules were identified by Robert Goldsheider in 1971, who empirically studied this method on commercial licenses and found out that the royalty rate effectively represents 25% of the license’s profits. The percentages can vary for industries, according to the experience of the appraiser.
A German version of rule of thumb is the Knoppe formula. Developed by Helmut Knoppe in 1967, this formula is based on German administrative principle on royalty rates, and could be used as another simple control check.
𝑅𝑜𝑦𝑎𝑙𝑡𝑦 𝑟𝑎𝑡𝑒 𝑖𝑛 % =𝑃𝑟𝑜𝑓𝑖𝑡 𝑜𝑓 𝑙𝑖𝑐𝑒𝑛𝑠𝑒𝑑 𝑝𝑟𝑜𝑑𝑢𝑐𝑡 ∗ 100 𝑆𝑎𝑙𝑒𝑠 𝑜𝑓 𝑙𝑖𝑐𝑒𝑛𝑠𝑒𝑑 𝑝𝑟𝑜𝑑𝑢𝑐𝑡 ∗ 3
2.3.3.2.3 Cluster analysis
34
Similar to the method based on brand strength and market comparables, this analysis starts from detailed review of contractual characteristics of comparable licensing agreements and profitability measures of the brands. Each of these characteristics represent a variable in the cluster analysis. With agglomerative hierarchical clustering method, the optimal number of clusters that maximizes within-cluster similarity and minimizes among-cluster similarity. The cluster that contain the brand in question is considered as the most comparable group, then the median royalty rate of the brands in this cluster is taken as the royalty rate for the brand in question.
This method is helpful when the number of comparables and factors of comparability is huge. It is applicable for intangible assets with low profitability, while not suitable for high-profit assets.
2.3.3.2.4 Kleineidam, Kuebart and Contractor benchmarks
This method focuses on analysis of negotiation on licensing agreements between licensors and licensees.
2.3.3.3 Advantages and disadvantages of the royalty savings method
The advantages of this method include objectivity, industry specificity and theoretical rationality.
1) The result of the royalty savings method is objective as it refers to real transactions between unrelated parties on comparable brands in the same industry, which gives a result that is specific to the industry.
2) This method is theoretically rational as it creates a hypothetical scenario where one company manages the brand and transfers it to the other in exchange for royalty payment, and therefore the brand value is only related to royalties and not related to the production, distribution and selling process of the products under the brand name. The disadvantages of this method lie in that brands are not comparable due to its nature of uniqueness, and that the royalty savings method systematically undervalues the brand equity.
1) Each brand is unique by definition, which naturally determines the limited number of comparable brands.
35
2) In the hypothetic scenario assumed by this method, the royalty rate represents only the portion of the brand value that is transferred from the company who owns and manages the brand to the company who uses the brand under license agreement, while the portion of brand value retained by the brand-owning company is not taken into account. The value of owning and taking control of a brand typically consists in the upside value, for example, the right to develop the brand and increase the brand value. Therefore, the royalty savings method systematically undervalues the brand equity and provides a minimum estimation of brand equity value.
In summary, the royalty savings method, widely used in practice, provides a minimum value of what a brand is worth, on a comparable, objective and industry-specific basis.
2.3.4 Demand drivers / brand strength method
2.3.4.1 Presentation of the demand drivers / brand strength method
The demand drivers / brand strength analysis determines the brand value by the level of impact or influence that a brand has on customer’s decision to purchase the product, also known as “reasons-to-buy”. This method is based on the hypothesis that customers base their purchasing decisions on certain demand drivers, of which some are related to the brand of the product, and that the proportion related to brand is identifiable.
The key of this method is to determine the brand-related portion in the demand drivers, and typically yields a percentage or index that could be applied to revenues, profits or cashflows in order to calculate the brand-related portion in these financial values.
34% of the income-based models identified by Salinas and Ambler (2009) analyze demand drivers and brand strength in order to determine the percentage of brand’s contribution to revenues or profits.