Morphometric variation in the forest rodent
Malacomys edwardsi (Rodentia: Muridae) in Côte
d’Ivoire
Hilaire Kouakou BOHOUSSOU1,2*, Bertin Kouamé AKPATOU1,2, Blaise KADJO1, Ouattara
SOULEMANE1, Eliézer Kouakou N’GORAN1, Violaine NICOLAS3
1 Laboratoire de Zoologie et Biologie Animale, UFR Biosciences, Université Félix Houphouët-Boigny, Côte d’Ivoire, 22 BP 582 Abidjan 22.
2 Centre Suisse de Recherches Scientifiques (CSRS) en Côte d’Ivoire, 01 BP 1303 Abidjan 01.
3 Muséum National d’Histoire Naturelle, Département de Systématique et Évolution, UMR ISYEB 7205 MNHN CNRS EPHE Paris VI, 57 rue Cuvier, CP 51, 75005 Paris, France
*Corresponding author: Cel: (+225) 08 16 38 60, E-mail: kbohoussouhil@yahoo.fr
Original submitted in on 14th May 2014. Published online at www.m.elewa.org on 31st August 2014.
http://dx.doi.org/10.4314/jab.v80i1.7 ABSTRACT
Objective: This study examined the intra-specific cranial morphometric variability between populations of Malacomys edwardsi from three distinct localities in Côte d’Ivoire.
Methodology and results: The data set focused on 23 cranial measurements recorded on 158 skulls of M. edwardsi from Adiopodoumé (n = 43), Bolo (n = 34) and Taï (n = 81). Sexual and geographical variations were investigated using univariate and multivariate statistics. No sexual dimorphism was recorded. However highly significant morphometric differences were observed between the three populations. This study observed a longitudinal clinal size variation for five measurements. Moreover, populations from the left bank of the Sassandra River are morphometrically closer to one another than to those found on the right bank.
Conclusions and application of findings: This study reveals that the three populations of M.edwardsi exhibited local morphological differentiation. Additional studies are needed to better explain the determinants of this variation (local adaptation, phylogenetic history). This is important for both the systematics and conservation of this endemic species of the West African forests.
Key words: Muridae, Malacomys edwardsi, Geographic variation, Traditional morphometric, Côte d’Ivoire. INTRODUCTION
The genus Malacomys (Milne-Edwards, 1877) is composed of small rodent belonging to the family Muridae. This genus only occurs in tropical regions of Africa. The taxonomy at the species level of this genus has been highly debated for a long time (Hayman, 1935; Bellier & Gautun, 1968; Rosevear, 1969; Van Der Straeten & Verheyen, 1979; Musser
& Carleton, 1993, 2005). Indeed, nine species were described (Malacomys longipes, M. centralis, M. wilsoni, M. edwardsi, M. autralis, M. cansdalei, M. giganteus, M. verschureni and M. lukolelae), but this number of species has been controversial. In their general taxonomic review of the Murids of the world, Musser & Carleton (2005) put many of
Journal of Applied Biosciences 80:7014 – 7023
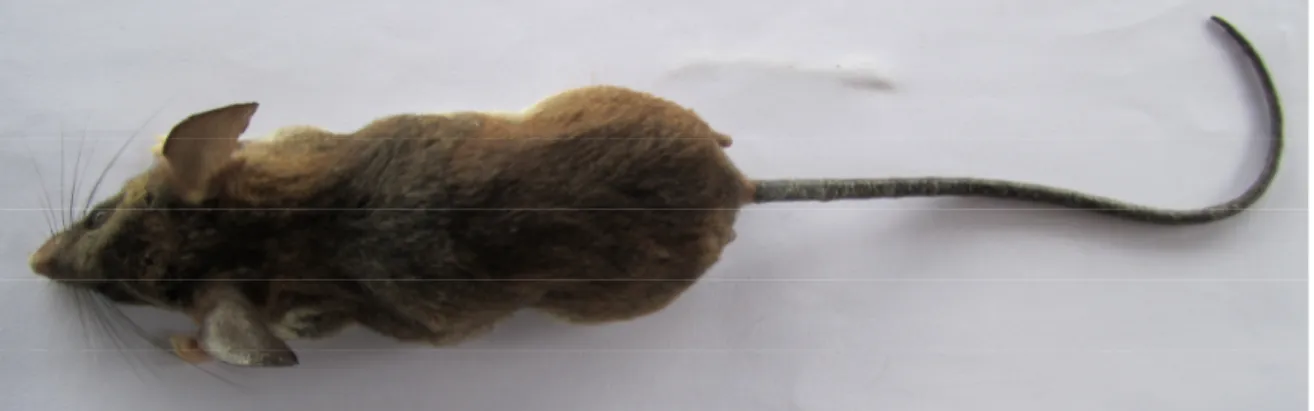
these species in synonymy and only retained 3 species: M. longipes, M. edwardsi and M. cansdalei. More recently, Elgoyen (2009) performed molecular phylogenetic analyses that confirm the existence of two distinct species in West Africa (M. edwardsi and M. cansdalei) and a third species in Central and East Africa (M. longipes). Very few studies investigated intra-specific morphometric variability within Malacomys species (Cole, 1972, Rautenbach & Schlitter 1978, Van der Straeten & Verheyen 1979). However, a good knowledge of intra-specific variability is an important pre-request before any systematic or taxonomic revision. Moreover, phenotypic traits are under selection; thus, the study of phenotypic variation is important to test the strength and impact of selection in differentiation processes. Concerning the species M. edwardsi (Figure 1) only three studies investigated morphometric differences within or between populations. Indeed, Rautenbach & Schlitter (1978) examined geographic variation in M. edwardsi from Côte d’Ivoire and Ghana, and concluded that geographic samples were generally homogeneous; and that little individual variation was noticed. Cole
(1972) and Van der Straeten & Verheyen (1979) did not show significant sexual dimorphism in M. edwardsi based on external or cranial measurements. However, these studies were conducted while the taxonomy of the genus Malacomys was still debated. In Côte d’Ivoire, the Sassandra River is an important geographic barrier between the Western and Eastern Guinean lowlands forests (Underwood et al., 1998). Several studies have already shown that the Sassandra River is a barrier that has contributed to the speciation of numerous West African vertebrates, mainly primates (Kingdon, 1997; Koné, 2004; Gonedele Bi et al., 2006). Moreover, distinct genetic clades were observed on both sides of the Sassandra River in several small mammal species (e.g. the rodent Praomys rostratus, Nicolas et al., 2010; or shrews of the Crocidura obscurior species complex, Jacquet et al., 2014). Morphometric differentiation between populations from both sides of this river was also recorded in the species Praomys rostratus (Akpatou, 2009). This study seeks to investigate sexual and geographic morphometric variation in M. edwardsi in Côte d’Ivoire.
Figure 1 . Specimen of Malacomys edwardsi MATERIAL AND METHODS
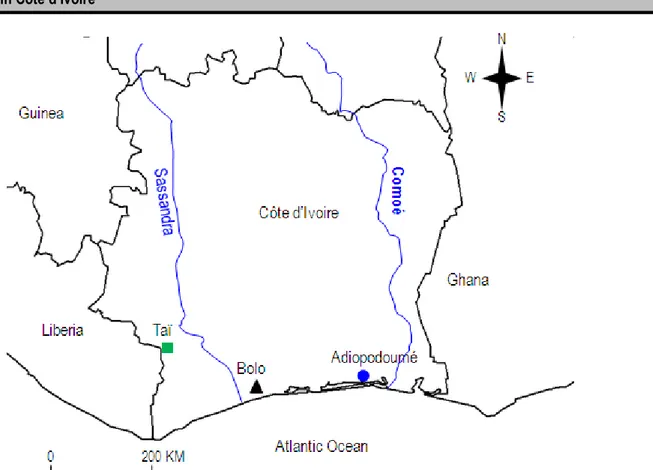
This study focus on M. edwardsi collected in 3 localities of Côte d’Ivoire (Figure 2). A total of 158 specimens from Adiopodoumé (n = 43), Bolo (n = 34) and Taï (n = 81) were included in our analyses (Appendix). All the skulls examined in this study are available at the ‘Laboratoire de Zoologie et Biologie Animale (UFR Biosciences, Université Félix Houphouët-Boigny)’, the
‘Muséum National d’Histoire Naturelle de Paris (MNHN, Paris, France)’ and the Royal Museum for Central Africa (RMCA, Tervuren, Belgium). Specimen identification at species level was confirmed through molecular analysis (DNA sequencing of 16S rRNA and/or Cytochrome b genes). Data from these molecular analyses are not shown here.
Figure 2: Map showing the geographical localities from which the specimens of M. edwardsi were collected in Côte d’Ivoire.
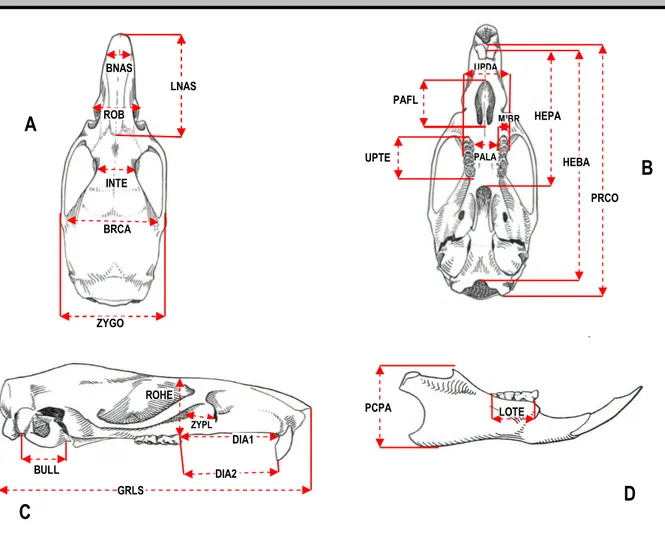
For each specimen, we recorded 23 craniodental measurements (in mm; Figure 3) that included greatest length of skull (GRLS), condylobasal length (PRCO), henselion-basion length (HEBA), henselion-palation length (HEPA), length of palatal foramen (PAFL), length of diastema (DIA1), distance between M1 alveolus and cutting edge of the upper incisor (DIA2), smallest interorbital breadth (INTE), zygomatic breadth on the zygomatic process of the squamosal (ZYGO), smallest palatal breadth between 1st upper molars (PALA), length of maxillary cheek tooth row (UPTE), breadth of upper dental arch (UPDA), greatest breadth of M1 (M1BR), smallest breadth of zygomatic plate (ZYPL), greatest breadth of nasals (BNAS), greatest length of nasals (LNAS), length of mandible tooth row (LOTE),
length of auditory bulla (BULL), greatest breadth of braincase (BRCA), depth of upper incisor (DINC), mediosagittal projection of rostrum height at anterior border of the first upper molars (ROHE), greatest rostrum breadth (ROBR), and distance between the extreme points of the coronoid and the angular processes of the mandibula (PCPA). All the measurements were recorded by H.K.B using hand-held calipers (precision of 0.01 mm) while viewing crania under a stereomicroscope. Body mass and external measurements (head and body length, tail length, hind-foot length, and ear length) were not included in this study, because these variables were collected by several field collectors, which could represent a bias in statistic analyses.
Figure 3: Localization of the 23-craniodental measurements recorded in this study. Abbreviations for variables are defined in materiel and methods. Dorsal = A; ventral = B; lateral = C; mandible = D.
Only adult specimens with approximately similar tooth wear were used for morphometric analyzes (i.e. tooth wear class 2 and 3 of Nicolas et al. (2008)). Sexual dimorphism was investigated in the population with greater sample size (i.e. Taï; 42 males and 39 females). We performed standard descriptive statistics (mean, range and standard deviation) for each group. Analysis of variance (ANOVA) and multiple analyses of variance (MANOVA) were used to test for statistically significant differences between sexes and localities. Where statistically significant differences were
detected, Scheffé post hoc tests were used to determine statistically non-significant subsets. Discriminant analysis was used to assess morphometric differences between localities. Statistically significant differences between geographic variables group centroids were evaluated by means of Mahalanobis distances and Wilks’ lambda statistics (Klecka, 1980). All multivariate analyses were based on Log10-transformed cranial morphometric data. The statistical analyses were performed using statistica 7.1.
RESULTS
Sexual dimorphism: One way analysis of variance showed no statistically significant differences between sexes in craniodental (wilks’ lambda = 0.730; P = 0.579) measurements. Consequently, males and females were treated jointly in all subsequent morphometric analyses.
Morphometric variation between localities: ANOVA indicated highly statistically significant differences between specimens from Adiopodoumé, Bolo and Taï localities (wilks’ lambda = 0.201; p < 0.0001). Specimens from Adiopodoumé differ statistically significantly from those of Bolo and Taï by 6 and 11
PCPA LOTE ZYPL DIA2 DIA1 BULL ROHE GRLS PRCO HEBA HEPA UPTE PAFL UPDA PALA M¹BR ZYGO BRCA LNAS INTE BNAS ROB
A
C
B
D
ZYGO BRCA LNAS INTE BNAS ROBmeasurements, respectively (Table 1 and 2). Eight out of the 23 craniodental measurements varied also significantly between Bolo and Taï specimens (Table 1 and 2). There is a size gradient between specimens from Taï, Bolo and Adiopodoumé for UPDA, PCPA, BULL, LOTE (largest values at Taï, lowest values at Adiopodoumé), UPTE (lowest values at Taï, largest values at Adiopodoumé) and M1BR (lowest values at
Bolo, largest values at Taï) measurements (Table 1). Specimens from Taï have significantly greater BRCA, ZYPL and PALA measurements, and lower INTE measurements than those from Adiopodoumé. Taï specimens also have a greater ZYGO than Bolo or Adiopodoumé specimens. Finally, Bolo specimens have a wider BNAS than specimens from Adiopodoumé and Taï.
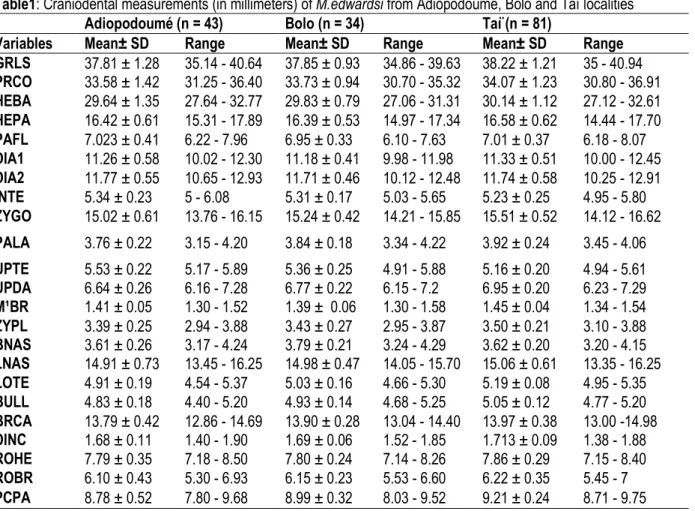
Table1: Craniodental measurements (in millimeters) of M.edwardsi from Adiopodoumé, Bolo and Taï localities
Adiopodoumé (n = 43) Bolo (n = 34) Taï (n = 81)
Variables Mean± SD Range Mean± SD Range Mean± SD Range
GRLS 37.81 ± 1.28 35.14 - 40.64 37.85 ± 0.93 34.86 - 39.63 38.22 ± 1.21 35 - 40.94 PRCO 33.58 ± 1.42 31.25 - 36.40 33.73 ± 0.94 30.70 - 35.32 34.07 ± 1.23 30.80 - 36.91 HEBA 29.64 ± 1.35 27.64 - 32.77 29.83 ± 0.79 27.06 - 31.31 30.14 ± 1.12 27.12 - 32.61 HEPA 16.42 ± 0.61 15.31 - 17.89 16.39 ± 0.53 14.97 - 17.34 16.58 ± 0.62 14.44 - 17.70 PAFL 7.023 ± 0.41 6.22 - 7.96 6.95 ± 0.33 6.10 - 7.63 7.01 ± 0.37 6.18 - 8.07 DIA1 11.26 ± 0.58 10.02 - 12.30 11.18 ± 0.41 9.98 - 11.98 11.33 ± 0.51 10.00 - 12.45 DIA2 11.77 ± 0.55 10.65 - 12.93 11.71 ± 0.46 10.12 - 12.48 11.74 ± 0.58 10.25 - 12.91 INTE 5.34 ± 0.23 5 - 6.08 5.31 ± 0.17 5.03 - 5.65 5.23 ± 0.25 4.95 - 5.80 ZYGO 15.02 ± 0.61 13.76 - 16.15 15.24 ± 0.42 14.21 - 15.85 15.51 ± 0.52 14.12 - 16.62 PALA 3.76 ± 0.22 3.15 - 4.20 3.84 ± 0.18 3.34 - 4.22 3.92 ± 0.24 3.45 - 4.06 UPTE 5.53 ± 0.22 5.17 - 5.89 5.36 ± 0.25 4.91 - 5.88 5.16 ± 0.20 4.94 - 5.61 UPDA 6.64 ± 0.26 6.16 - 7.28 6.77 ± 0.22 6.15 - 7.2 6.95 ± 0.20 6.23 - 7.29 M¹BR 1.41 ± 0.05 1.30 - 1.52 1.39 ± 0.06 1.30 - 1.58 1.45 ± 0.04 1.34 - 1.54 ZYPL 3.39 ± 0.25 2.94 - 3.88 3.43 ± 0.27 2.95 - 3.87 3.50 ± 0.21 3.10 - 3.88 BNAS 3.61 ± 0.26 3.17 - 4.24 3.79 ± 0.21 3.24 - 4.29 3.62 ± 0.20 3.20 - 4.15 LNAS 14.91 ± 0.73 13.45 - 16.25 14.98 ± 0.47 14.05 - 15.70 15.06 ± 0.61 13.35 - 16.25 LOTE 4.91 ± 0.19 4.54 - 5.37 5.03 ± 0.16 4.66 - 5.30 5.19 ± 0.08 4.95 - 5.35 BULL 4.83 ± 0.18 4.40 - 5.20 4.93 ± 0.14 4.68 - 5.25 5.05 ± 0.12 4.77 - 5.20 BRCA 13.79 ± 0.42 12.86 - 14.69 13.90 ± 0.28 13.04 - 14.40 13.97 ± 0.38 13.00 -14.98 DINC 1.68 ± 0.11 1.40 - 1.90 1.69 ± 0.06 1.52 - 1.85 1.713 ± 0.09 1.38 - 1.88 ROHE 7.79 ± 0.35 7.18 - 8.50 7.80 ± 0.24 7.14 - 8.26 7.86 ± 0.29 7.15 - 8.40 ROBR 6.10 ± 0.43 5.30 - 6.93 6.15 ± 0.23 5.53 - 6.60 6.22 ± 0.35 5.45 - 7 PCPA 8.78 ± 0.52 7.80 - 9.68 8.99 ± 0.32 8.03 - 9.52 9.21 ± 0.24 8.71 - 9.75 Standard univariate statistics (n = sample size, mean, SD = standard deviation, and range) are given for each locality.
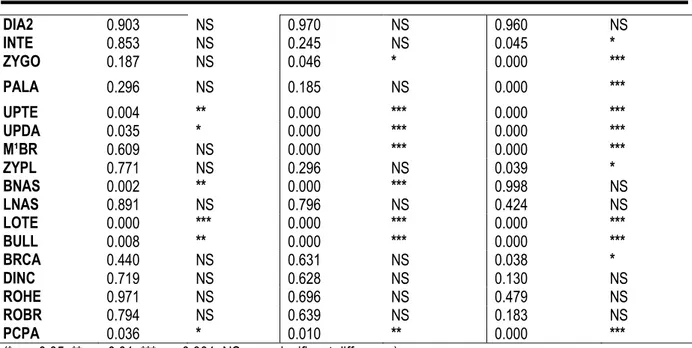
Table 2: Results of the ANOVA analyses. The a posteriori Scheffé test was used to evaluate significant differences between M. edwardsi from Adiopodoumé, Bolo and Taï localities
Result of Scheffé test
Adiopodoumé & Bolo Bolo & Taï Taï & Adiopodoumé
Variables p p p GRLS 0.988 NS 0.310 NS 0.185 NS PRCO 0.871 NS 0.400 NS 0.112 NS HEBA 0.776 NS 0.405 NS 0.069 NS HEPA 0.992 NS 0.346 NS 0.361 NS PAFL 0.668 NS 0.697 NS 0.984 NS DIA1 0.802 NS 0.454 NS 0.856 NS
DIA2 0.903 NS 0.970 NS 0.960 NS INTE 0.853 NS 0.245 NS 0.045 * ZYGO 0.187 NS 0.046 * 0.000 *** PALA 0.296 NS 0.185 NS 0.000 *** UPTE 0.004 ** 0.000 *** 0.000 *** UPDA 0.035 * 0.000 *** 0.000 *** M¹BR 0.609 NS 0.000 *** 0.000 *** ZYPL 0.771 NS 0.296 NS 0.039 * BNAS 0.002 ** 0.000 *** 0.998 NS LNAS 0.891 NS 0.796 NS 0.424 NS LOTE 0.000 *** 0.000 *** 0.000 *** BULL 0.008 ** 0.000 *** 0.000 *** BRCA 0.440 NS 0.631 NS 0.038 * DINC 0.719 NS 0.628 NS 0.130 NS ROHE 0.971 NS 0.696 NS 0.479 NS ROBR 0.794 NS 0.639 NS 0.183 NS PCPA 0.036 * 0.010 ** 0.000 *** (* p < 0.05; ** p < 0.01; *** p < 0.001; NS = no significant difference). In the discriminant analysis, 90 % and 10% of the total
variation is explained by the first and second canonical variates axes, respectively (Figure 4; Table 3). Differences among specimens from separate areas are highly statistically significant (wilks’ lambda = 0.201; P < 0.0001). Squared Mahalanobis distances between specimens are 4.28 between specimens from Adiopodoumé and Bolo, 6.97 between specimens from Bolo and Taï, and 14.58 between specimens from Adiopodoumé and Taï. The scattergram shows some differences between specimens from Taï and those
from Bolo and Adiopodoumé localities on the first canonical variates axis. However, there is no obvious separation between specimens from Bolo and Adiopodoume localities on this axis. There is no good discrimination between specimens from the 3 localities on the 2nd canonical variates axis (Figure 4). The factor
structure matrix indicates that LOTE, BULL, UPDA and PCPA are the most negatively correlated variables on the first canonical variates axis, whereas UPTE is the most positively correlated variable on this canonical variates axis (Table 3).
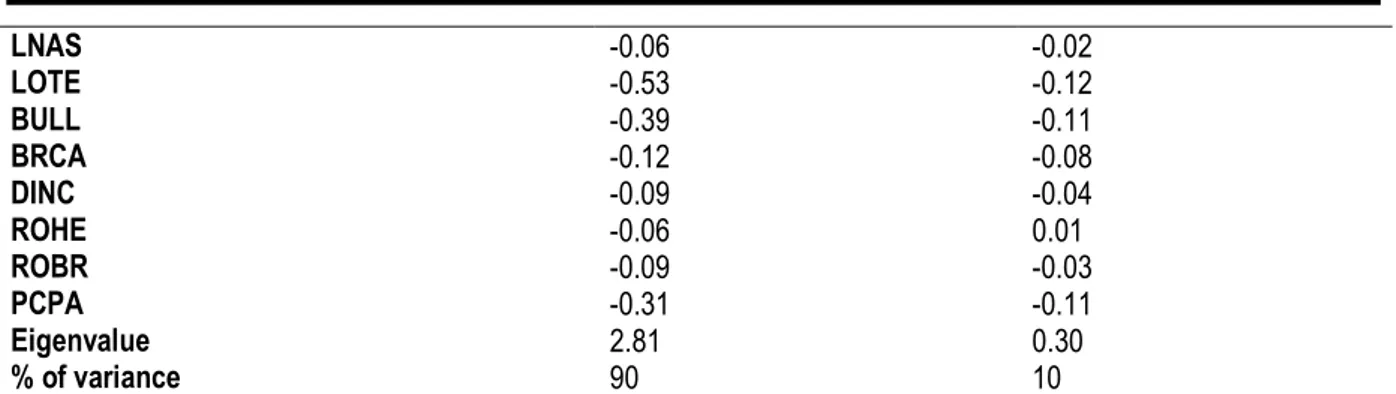
Table 3: Discriminant analysis performed on craniodental measurements of M. edwardsi from Adiopodoumé (n = 43), Bolo (n = 34) and Taï (n = 81) localities.
Variables CV1 CV2 GRLS -0.09 0.06 PRCO -0.10 0.01 HEBA -0.11 -0.00 HEPA -0.07 0.09 PAFL -0.00 0.13 DIA1 -0.04 0.13 DIA2 0.01 0.05 INTE 0.13 -0.04 ZYGO -0.24 -0.06 PALA -0.18 -0.07 UPTE 0.43 0.08 UPDA -0.36 -0.05 M¹BR -0.25 0.40 ZYPL -0.13 0.01 BNAS 0.04 -0.59
LNAS -0.06 -0.02 LOTE -0.53 -0.12 BULL -0.39 -0.11 BRCA -0.12 -0.08 DINC -0.09 -0.04 ROHE -0.06 0.01 ROBR -0.09 -0.03 PCPA -0.31 -0.11 Eigenvalue 2.81 0.30 % of variance 90 10
Correlation between selected variables and canonical variate axis. CV = canonical variate.
Figure 4: Discriminant analysis performed on craniodental measurements of M. edwardsi from Adiopodoumé (n = 43), Bolo (n = 34) and Taï (n = 81) localities.
DISCUSSION
This study results confirm the lack of sexual morphometric dimorphism in M. edwardsi, already noted by Cole (1972) in Ghana and by Van Der Straeten & Vereyen (1979) in Adiopodoumé (Côte d’Ivoire). The multivariate analyses demonstrate that the three populations of M. edwardsi exhibit important differences in craniodental measurements. This result is not congruent with those of Rautenbach & Schlitter (1978) who find little variation between populations of
M. edwardsi from different localities in Côte d’Ivoire. Discrepancies between our results and those of Rautenbach & Schlitter (1978) could be explained by differences in sample size (very few specimens in their study, with 6 to 8 specimens per operational taxonomic units) and the number of craniodental measurements involved. In this study, we used 23 craniodental measurements against only 8 (GRLS, PAFL, INTE, ZYGO, UPDA, LOTE, BRCA and LOB (not included in
this study)) in the study of Rautenbach & Schlitter (1978). Our results show that these measurements do not differ significantly (GRLS and PAFL) or weakly (INTE and BRCA) between populations. This study reveals that M. edwardsi exhibits geographical morphological differentiation, which may be explained by local adaptation. Indeed, several studies have shown the presence of local population level differentiation in the size and shape variation of skull, molars and mandibles in mammals (Cardini et al., 2007; Polly, 2007; Caceres et al., 2014). These structures covary with many environmental factors, such as latitude, longitude, altitude, temperature, vegetation and precipitation (Cardini et al., 2007; Faleh et al., 2013; Caceres et al., 2014). A longitudinal clinal size variation was observed between our three localities for 5 out of the 23 morphometrical variables. Longitudinal clinal size variation was also observed in other African mammal species (e.g. Cardini & Elton, 2009, Cardini et al., 2007), but on a larger geographical scale, and was partly explained by differences in rainfall. Determinants of the longitudinal size variation observed in M. edwardsi should be further explored. Additionally to this clinal variation, our data show that the two populations from the left bank of the Sassandra River (Bolo and Adiopodoumé) are more similar to one another than to the one found on the right bank (Taï). A similar pattern of morphometric and/or genetic variation
between populations from both sides of this river was observed in other small mammal species (Nicolas et al., 2008; Akpatou, 2009, Jacquet et al., 2014). However, this result is surprising for Malacomys since this rodent is known to be a very good swimmer (Nicolas & Colyn, 2006) and to be commonest near streams or swampy areas (Happold, 2013). It is important to note that it is possible that the patterns observed in this study today not only reflect adaptations to the environment in the present or in the recent past but also events that took place earlier in the evolutionary history of M. edwardsi. For a better understanding of the morphometric intra-specific variation in M. edwardsi from Côte d’Ivoire, it would be very interesting to include more populations and to compare our morphometric results with additional markers, such as molecular markers, in order to infer its evolutionary history. Malacomys edwardsi is one of the remaining representatives of endemic West African forest small mammal species. This species is one of the most abundant rodent species in forest habitats (Decher et al., 2005). Its conservation and survival is closely related to the challenge of African tropical forests, which are disappearing at an alarming rate. A better understanding of intra-specific variation and evolutionary history of this ecologically important species is important not only for systematics, but also for its conservation.
ACKNOWLEDGMENTS
We would like to thank the ‘Laboratoire de Zoologie et Biologie Animale, UFR Biosciences, Université Félix Houphouët-Boigny’ and the ‘Centre Suisse de Recherches Scientifiques (CSRS) en Côte d’Ivoire’, for support and laboratory work. We wish to express our gratitude to the curators of the mammal collections of the ‘Muséum National d’Histoire Naturelle (MNHN) de Paris’, the ‘Royal Museum for Central Africa (RMCA)’ of Tervuren, Belgium, who allowed us to study the collections in their care. Molecular analyses were
conducted at the ‘Service de Systématique Moléculaire’ of the MNHN (UMS 2700, Paris, France). We are grateful to Inza koné (CSRS) and Wim Wendelen (RMCA) for their successful contribution in this work. We wish also to thank all field work participants, particulary TIEDE Gnepa Lucien for his assistance in the Taï National Park. Field studies were supported by PNUD project ‘Rehabilitation des infrastructures touristiques et de recherches du Parc National de Taï (CIV 00070610)’.
REFERENCES
Akpatou KB, 2009. Systématique et phylogéographie des espèces du genre Praomys Thomas 1915 (Rodentia, Muridae) des forêts de la Haute Guinée. Thèse unique d’Université de Cocody, 136 pp.
Bellier L and Gautun JC, 1968. A propos des Malacomys longipes en Côte d'Ivoire. Mammalia 32(1): 72-81.
Cardini A, Jansson A-U, Elton S, 2007. Ecomorphology of vervet monkeys: a geometric morphometric approach to the study of clinal variation. Journal of Biogeography, 34, 1663–1678. Cardini A and Elton S, 2009. Geographical and
taxonomic influences on cranial variation in red colobus monkeys (Primates, Colobinae): introducing a new approach to ‘morph’
monkeys. Global Ecology and Biogeography, 18, 248-263.
Caceres N, Meloro C, Carotenuto F, Passaro F, Sponchiado J, Melo GL, Raia P, 2014. Ecogeographical variation in skull shape of capuchin monkeys. Journal of Biogeography 41: 501–512.
Cole LR, 1972. A comparison of Malacomys longipes and Malacomys edwardsi (Rodentia: Muridae) from a single locality in Ghana. Journal of Mammalogy 53: 616-619.
Decher J, Kadjo B, Abedi-Lartey M, Tounkara EO, Kante S, 2005. A rapid survey of small mammals (shrews, rodents, and bats) from the haute dodo and cavally forests, Côte d'Ivoire. A rapid biological assessment of two classified forests in southwestern Côte d'Ivoire (ed. by L.E. Alonso, F. Lauginie and G. Rondeau),101-109. Conservation International, Washington DC.
Elgoyen C. 2009. Phylogéographie du genre Malacomys en Afrique tropicale. Mémoire de Master 2, université de Créteil, 19 pp.
Faleh AB, Cornette R, Annabi A, Said K, Denys C, 2013. Patterns of size and shape skull variability in Tunisian populations of Jaculus jaculus (Rodentia: Dipodidae). Acta Zoologica Bulgarica 65 (2): 217-223.
Gonedele bi, S., Zimer, D., Kone, I., Gone Bi, Z., Akpatou, B., Koffi Bene, J.C., Sangaré, A. & Boesch, C., 2006-A West African black-and-white colobus monkey, Colobus polykomos Dollmani Schartz, 1927, facing extinction. Primate conservation 21: 55-61.
Happold D, 2013. Mammals of Africa, Volume III: Rodents, Hares and Rabbits. Bloomsbury Publishing, London. 784 pp
Hayman RW, 1935. On a collection of mammals from the Gold Coast. Proceedings of the Zoological Society of London. 915-937.
Jacquet F, Nicolas V, Colyn M, Kadjo B, Hutterer R, Decher J, Akpatou B, Cruaud C, Denys C, 2014. Forest refugia and riverine barriers promote diversification in the West African pygmy shrew (Crocidura obscurior complex, Soricomorpha). Zoologica scripta 43: 131–148 Kingdon J, 1997. The kingdom field guide to African
Mammals. Academic Press, London, 464 P. Klecka WR, 1980. Discriminant analysis. Sage
Publications, London, United Kingdom. In Nicolas V, Wendelen W, Barriere P, Dudu A,
Colyn M, 2008. Morphometric Variation in Hylomyscus alleni and H. Stella (Rodentia: Muridae) and Description of a New Species. Journal of Mammalogy 89(1):222-231
Koné I, 2004. Effet du braconnage sur quelques aspects du comportement du Colobe Bai -Procolobus badius (Kerr) et du Cercopithèque diane – Cercopithecus diana diana (L.) – dans le Parc National de Taï, Côte d’Ivoire. Thèse de Doctorat d’Université de Cocody, 122p. Musser GG and Carleton MD, 1993. Family Muridae.
In: Wilson D.E. & Reeder M.D., (Eds.), Mammal species of the world: a taxonomic and geographic reference, 2nd edition. Washington. D.C., Smithsonian Institution Press. 501–755.
Musser GG and Carleton MD, 2005. Superfamily Muridae. In: Wilson, D.E. & Reeder, D.M. (Eds.), Mammal species of the world, 3rd edition. Johns Hopkins University Press, Baltimore. 894–1531.
Nicolas V and Colyn M, 2006. Swimming ability of five species of rainforest african murid rodents in relation to their habitat preferences. Zool Stud, 45, 264-268
Nicolas V, Wendelen W, Barriere P, Dudu A, Colyn M, 2008. Morphometric Variation in Hylomyscus alleni and H. Stella (Rodentia: Muridae) and Description of a New Species. Journal of Mammalogy 89(1):222-231.
Nicolas V, Akpatou B, wendelen W, Peterhans JK, Olayemi A, Decher J, Missoup AD, Denys C, Barrier P, Cruaud C and Colyn M, 2010. Molecular and morphometric variation in two sibling species of the genus Praomys (Rodentia: Muridae): implications for biogeography. Zoological Journal of the Linnean Society 160: 397–419.
Polly PD, 2007. Phylogeographic differentiation in Sorex araneus: morphology in relation to geography and karyotype. Russian Journal of Theriology 6: 73–84.
Rautenbach IL and Schlitter DA, 1978. Revision of Genus Malacomys of Africa (Mammalia: Muridae). Annals of Carnegie Museum of Natural History. Pittsburg, Pennsylvania 47: 385-422
Rosevear DR, 1969. The rodents of West Africa. Trustees of the British Museum (Natural History), London, 604 pp.
Underwood E, Itoua I, Olson D, Dinerstein E, Loucks C, Wettengl W, 1998. Terrestrial ecoregions of Africa. WWF-US conservation Science Program, Washington.
Van der Straeten E and Verheyen WN, 1979. Notes Taxonomiques sur les Malacomys de l’Ouest
Africain avec redescription du patron chromosomique de Malacomys edwardsi (Mammalia: Muridae). Rev. Zoologique Africaine 93(1): 10-35
APPENDIX
List of specimens of M.edwardsi included in the cranial morphometric analyses with reference to sampling localities.
Adiopodoumé (05°19’53’’N, 04°08’02’’O): RMCA 77-54-M-456, RMCA 77-54-M-458, RMCA 77-54-M-459, RMCA 77463, RMCA 77464, RMCA 77465, RMCA 77467, RMCA 77469, RMCA 77 -54-M-471, RMCA 77 -54-M-472, RMCA 77-54-M-473, RMCA 77 -54-M-474, RMCA 77 -54-M-476, RMCA 77 -54-M-477, RMCA 77 -54-M-478, RMCA 77 -54-M-479, RMCA 77 -54-M-480, RMCA 77 -54-M-481, RMCA 77 -54-M-482, RMCA 77 -54-M-483, RMCA 77 -54-M-484, RMCA 77 -54-M-485, RMCA 77 -54-M-487, RMCA M-490, RMCA 77-54-M-493, RMCA 77-54-M-494, RMCA 77-54-M-499, RMCA 77-54-M-500, RMCA 77-54-M-501, RMCA 77-54-M-518, RMCA 78-36-M-1, RMCA 78-36-M-4, RMCA 78-36-M-7, RMCA 78-36-M-12, RMCA 78-36-M-13, RMCA 78-36-M-14, RMCA M-16, RMCA M-17, RMCA M-19, RMCA M-20, RMCA M-21, RMCA 78-36-M-22, RMCA 78-36-M-23.
Bolo (05°20’29’’N, 05°59’07’’O): MNHN-ZM-MO 1997-2256, MNHN-ZM-MO 1997-2262, MNHN-ZM-MO 1997-2266, MNHN-ZM-MO 1997-2269, MNHN-ZM-MO 1997-2270, MNHN-ZM-MO 1997-2271, MNHN-ZM-MO 1997-2272, MNHN-ZM-MO 1997-2299, MNHN-ZM-MO 1997-2300, MNHN-ZM-MO 1997-2303, MNHN-ZM-MO 1997-2314, MNHN-ZM-MO 1997-2328, MNHN-ZM-MO 1997-2367, MNHN-ZM-MO 1997-2368, MNHN-ZM-MO 1997-2382, MNHN-ZM-MO 1997-2403, MNHN-ZM-MO 1997-2404, MNHN-ZM-MO 1997-2405, MNHN-ZM-MO 1997-2428, MNHN-ZM-MO 1997-2432, MNHN-ZM-MO 1997-2436, MNHN-ZM-MO 1997-2442, MNHN-ZM-MO 1997-2443, MNHN-ZM-MO 1998-50, MNHN-ZM-MO 1998-59, MNHN-ZM-MO 1998-62, MNHN-ZM-MO 1998-66, MNHN-ZM-MO 1998-69, MNHN-ZM-MO 1998-73, MNHN-ZM-MO 1998-80, MNHN-ZM-MO 1998-81, MNHN-ZM-MO 1998-83, MNHN-ZM-MO 1998-92. MNHN-ZM-MO 1998-99. Taï (05°51’39’’N, 07°19’14’’O): BHT 03, BHT 07, BHT 08, BHT 12, BHT 15, BHT 16, BHT 27, BHT 28, BHT 29, BHT 33, BHT 34, BHT 38, BHT 45, BHT 46, BHT 48, BHT 49, BHT 51, BHT 52, BHT 64, BHT 69, BHT 78, BHT 79, BHT 80, BHT 82, BHT 87, BHT 88, BHT 93, BHT 94, BHT 107, BHT 124, BHT 134, BHT 141, BHT144, BHT145, BHT152, BHT 157, BHT158, BHT161, BHT 181, BHT 215, BHT 224, BHT 242, BHT 251, BHT 256, BHT 257, BHT 261, BHT 267, BHT269,BHT 271, BHT 299, BHT 300, BHT 303, BHT 309, C2, C6, C17, R24587, R24610, R24662, R24683, R24689, R24707, R24708, R24763, R24778, R24794, R24795, R24833, R24834, R24844, R24852, R24887, R24892, R24894, R24897, R24900, R24938, R24950, R24953, R24954, R24960.