HAL Id: hal-01308058
https://hal.archives-ouvertes.fr/hal-01308058
Submitted on 27 Apr 2016
HAL is a multi-disciplinary open access archive for the deposit and dissemination of sci-entific research documents, whether they are pub-lished or not. The documents may come from teaching and research institutions in France or abroad, or from public or private research centers.
L’archive ouverte pluridisciplinaire HAL, est destinée au dépôt et à la diffusion de documents scientifiques de niveau recherche, publiés ou non, émanant des établissements d’enseignement et de recherche français ou étrangers, des laboratoires publics ou privés.
TSC and Broadband Dielectric Spectroscopy Studies of
the α Relaxation in Phosphorus-Containing Dendrimers
Eric Dantras, Jany Dandurand, Colette Lacabanne, Anne-Marie Caminade, Jean-Pierre Majoral
To cite this version:
Eric Dantras, Jany Dandurand, Colette Lacabanne, Anne-Marie Caminade, Jean-Pierre Majoral. TSC and Broadband Dielectric Spectroscopy Studies of the α Relaxation in Phosphorus-Containing Dendrimers. Macromolecules, American Chemical Society, 2004, vol. 37 (n° 8), pp. 2812-2816. �10.1021/ma049955i�. �hal-01308058�
O
pen
A
rchive
T
OULOUSE
A
rchive
O
uverte (
OATAO
)
OATAO is an open access repository that collects the work of Toulouse researchers and makes it freely available over the web where possible.
This is an author-deposited version published in : http://oatao.univ-toulouse.fr/
Eprints ID : 14315
To link to this article : DOI : 10.1021/ma049955i URL : http://dx.doi.org/10.1021/ma049955i
To cite this version : Dantras, Eric and Dandurand, Jany and Lacabanne, Colette and Caminade, Anne-Marie and Majoral, Jean-Pierre TSC and Broadband Dielectric Spectroscopy Studies of the α Relaxation in Phosphorus-Containing Dendrimers. (2004)
Macromolecules, vol. 37 (n° 8). pp. 2812-2816. ISSN 0024-9297
Any correspondance concerning this service should be sent to the repository administrator: [email protected]
TSC and Broadband Dielectric Spectroscopy Studies of the
RRelaxation
in Phosphorus-Containing Dendrimers
E. Dantras,* J. Dandurand, and C. Lacabanne
Laboratoire de Physique des Polyme`res, CIRIMAT, Universite´ Paul Sabatier, 31062 Toulouse Cedex 04, France
A. M. Caminade and J. P. Majoral
Laboratoire de Chimie de Coordination, 31077 Toulouse Cedex 04, France
ABSTRACT: The aim of this work is to analyze the dielectric manifestation of the glass transition (R
mode) of amorphous dendritic macromolecules as a function of architectural complexity. A set of phosphorus-containing dendrimers involving six generations (g ) 0-5) has been investigated by
thermostimulated currents and broadband dielectric spectroscopy. The dielectric complex permittivity has been obtained as a function of temperature, in a broad frequency range (10-4-106Hz). For frequencies
higher than 1 Hz, the dendrimers show a high temperatureRmode with a Vogel-Tamman-Fulcher
type temperature dependence. For frequencies lower than 1 Hz, theRmode takes place in the vitreous
state; it has been associated with a series of thermally activated cooperative movements free from generation influence. Dielectric and thermal properties are discussed as regards of fractal architecture and chemical modification of end groups.
Introduction
Glass transition,1 physical aging,2 mechanical
stud-ies,3,4 and low-temperature dynamics5 have been
al-ready described in dendrimers literature. However, up to now, the molecular mobility near the glass transition, with a large dendrimer series, remains unexplored due to conductivity phenomenom. In this work, we focus on generation from g)0 to g)5, of amorphous
phospho-rus-containing dendrimers, with chemical modifications of end groups. The phosphorus-containing dendrimers series has been chosen as a complex polymeric model to investigate the relationship between complex R
relaxation modes with a specific architecture. The aim of this work is to analyze the influence of architecture on R molecular mobility upon increasing generation.
Thanks to complementary dielectric techniques as ther-mostimulated currents (TSC) and broadband dielectric spectroscopy (BDS), the mechanism of dipolar polariza-tion and its evolupolariza-tion as a funcpolariza-tion of the generapolariza-tion of dendrimers may be studied. As previously shown for the
βmode,6we follow the shift ofRrelaxation modes on a
wide frequency and temperature range.
Experimental Section
Materials: Phosphorus-Containing Dendrimers. The synthesis of phosphorus-containing dendrimers consists of the repetition of two steps, starting from a core having phosphorus
-chlorine bonds, such as P(S)Cl3. The first step is the
nucleo-philic substitution of chlorine by hydroxy-benzaldehyde leading to a trialdehyde. The second step is the condensation of the aldehydes with H2NMeP(S)Cl2. This reaction induces the
multiplication of the number of end groups, with phosphorus acting as the divergent point. The repetition of these two steps allows us to build the dendrimer. Details of this synthesis and various characterizations of these amorphous polymers were described elsewhere.7-9Numbering of these compounds
here-after will be done as follows: [G′g], where g is the number of
generationshere g)0, ..., 5sand G′corresponds to
dendrim-ers with terminal aldehyde end groups (G corresponds to dendrimers without terminal aldehyde end groups). The 3d molecular structures of phosphorus-containing dendrimers with a cauliflower architecture are illustrated in Figure 1. For sake of simplicity, we limit the figure to g)0 and g)3. All
the studied samples are available as powder. To eliminate the remaining traces of free solvent molecules (THF), the samples have been heated at Tg +30 °C under a pressure of 10-5hPa
for 30 min. The micro-Brownian movements liberated at such temperatures might allow the diffusion of such molecules.Methods: Isothermal Broadband Dielectric
Spectros-copy and Thermostimulated Currents.In the case of BDS, the sample is constituted by a thin layer of powder (100(10 µm). For TSC experiments, slightly compressed pellets of 800 ( 10 µm thick were directly inserted between electrodes.
Broadband dielectric measurements were performed using a NOVOCONTROL BDS400 covering a frequency range of 10-2
Hz/3×106Hz with 10 points per decade. Experiments were
carried out within a temperature range 70 °C/175 °C. Dielectric isotherm spectra were measured every 5 °C. Before each frequency scan, temperature was kept constant to within(0.2
°C. The realǫ′Tand imaginaryǫ′′Tparts of the relative complex
permittivityǫT/, were measured as a function of frequency F
at a given temperature T. Experimental data are fitted by the Havriliak-Negami (HN) function with an additional
conduc-tivity term:10,11
whereǫ∞is the relative real permittivity at infinite frequency, ǫstis the relative real permittivity at null frequency,ǫ0is the
permittivity of vacuum,τHNis the relaxation time,ωis the
angular frequency, and RHN and βHN are the Havriliak
-Negami parameters. To obtain dielectric loss free from ohmic conduction, we calculate from the real part ǫ′T(ω),ǫ′′KK with
Kramers-Kronig relationships (KK):
We have used numerical techniques described in ref 12.
* Corresponding author. E-mail: [email protected].
ǫT / (ω)) ǫ ∞+ ǫst - ǫ∞ [1+(iωτHN)RHN]βHN -i
(
σ0 ǫ0ω)
n (1) ǫ′′KK(ω0))(
σ0 ǫ0ω0)
+2 π∫
0 ∞ ǫ′(ω) ω0 ω2 - ω02dω (2)Complex TSC spectra and fractional polarization analysis were carried out on a TSC/RMA analyzer. For global experi-ments, the sample was polarized by an electrostatic field Ep )400 kV‚m-1during t
p )2 min over a temperature range
from the polarization temperature, Tp, down to the freezing
temperature, T0 )0 °C. Then, the field was turned off and
the depolarization current was recorded with a constant heating rate (qh ) + 7 °C‚min-1), so that the equivalent
frequency of the TSC spectrum was feq ∼10-3-10-4Hz. TSC
experiments are complementary from BDS spectroscopy on the low-frequency side. For windowing experiments (ith elemen-tary peak), the polarizing field was applied for tp )2min at
Tpi. Then, the sample was short-circuited at Tdi )Tpi -∆Tp
and the temperature maintained constant for td )tp. Finally,
the sample was cooled at T0i )Tpi -50 °C, and the
depolar-ization current was recorded in the same way as for the complex mode. Windowing experiments were carried out:13,14
narrow poling windows (∆Tp e5 °C) are used for isolating
elementary processes that can be analyzed with the hypothesis of a single relaxation time. Details of BDS and TSC techniques have been published in ref 15.
Results and Discussion
Isothermal Response. Broadband Dielectric Spectroscopy of r Relaxation Mode.
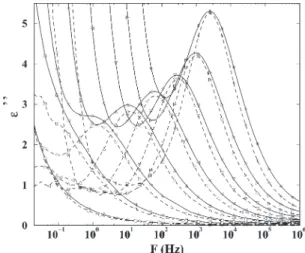
Phosphorus-containing dendrimers exhibit one primary relaxation region labeledR. Figure 2 (solid lines) shows theRmode
for [G′1] as example. The strength of this R mode
increases vs temperature. This dipolar relaxation is associated with the dielectric manifestation of the glass transition observed near Tg([G′1]) ) 69.3 °C by DSC
(obtained during cooling with qc ) -5 °C‚min-1). For
the isotherm T)70 °C, the conductivity contribution
appears on the low frequency tail of ǫ′′T(ω). Note that
dielectric manifestation of glass transition cannot be easily observed for middle and high generation, due to superimposed conductivity phenomenom. We also report in Figure 2 (dashed lines), ǫ′′KK(ω) where the ohmic
conduction has been eliminated. We observe a good agreement betweenǫ′′KK(ω) and measuredǫ′′T(ω) for the R relaxation mode of [G′1] except at low frequencies
when the two curves deviate due to conduction losses
Figure 1. Molecular architecture of [G′0] and [G′3] (yellow sphere, sulfur atom; small yellow sphere, phosphorus atom; dark blue
sphere, nitrogen atom; blue sphere, carbon atom; white sphere, hydrogen atom).
Figure 2. Frequency dependence of the dielectric energy loss
ǫ′′T(ω) (solid lines) for theR-mode of [G′1] andǫ′′KK(ω) (dashed
in ǫ′′T(ω). Experimental and calculated dielectric data
are fitted with HN equation (see eq 1 for experimental data with a conductivity term) and the n,RHN, andβHN
values are reported in Table 1. In the case of experi-mental data, parameter n is quasi-equal to 1, which is characteristic of an ohmic conductivity. The global shape of theRmode is practically independent of temperature.
For calculated data deduced from the Kramers-Kronig
equation, we note the close values for τ, ∆ǫ, and RHN
compared with Havriliak-Negami data extracted from
experimental data. In contrast, a nearly constantβHN ∼1 forǫ′′KK(ω) is obtained over the temperature range. Rmodes of phosphorus-containing dendrimers are well
described by a Cole-Cole phenomenological model. We
note that the relaxation strength of the Rprocess at
various temperatures is higher than typically observed in amorphous polymers. The major architectural differ-ence that might explain this result is the small length of the dendrons (<16 Å for g ) 1) with polar ends.
Consequently the polar species have a much higher molecular mobility, increasing signicantly their contri-bution to the dielectric permittivity.
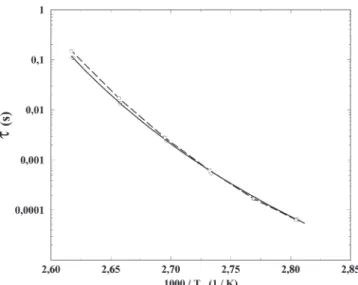
Temperature Dependence of Dielectric Relax-ation Times.Figure 3 compares the relaxation times forǫ′′T(ω) andǫ′′KK(ω) of the Rmode of [G′1] at different
temperatures. Both show the same temperature depen-dence. As for most polymers,16 the primary mode of
phosphorus-containing dendrimers is well described by a Vogel-Tamman-Fulcher (VTF) equation.
The adjustable parameters τ0, Rf, and T∞ depend on
polymer. This equation (or the empirical WLF equation) offers a semiempirical mean of accommodating the nonarrhenian temperature dependence of relaxation times. The parameter τ0 is the value of τHN(T) at
in-finite temperature, and T∞ is the temperature
corre-sponding to an infinite relaxation time. The param-eter Rf designates the free volume expansion
coeffi-cient. VTF parameters are reported in Table 2. We note thatRfparameter is more important (×10) than
com-monly reported values for a wide variety of polymers, which is probably due to the specific architecture of dendrimers.
Thermostimulated Response. TSC Thermogram of therRelaxation Mode.The TSC global spectrum
of dendrimers is shown in Figure 4. The polarizing field of 4 ×10⁵ V‚m-1 was applied at poling temperatures
indicated by small arrows. Then the sample was quenched to 0 °C and heated again at 7 °C‚min-1.
Dielectric manifestation of the glass transition are recorded between 60 °C/150 °C with 10 pAeImax e30
pA. Imaxis quasi-independent from generation since the
dipole’s number/volume ratio is constant due to self-similarity. Contrarily, TR([G′g]) is dependent from
gen-eration. One hypothesis that might explain this evolu-tion is the presence of solvent molecules trapped during synthesis. Indeed such trapping has been recently shown by Majoral et al.17To permit the elimination of
such a molecule, we need to heat the sample at a temperature where the global molecule is mobile: by analogy with polymers we might think that at some Tg +50 °C, we reach such mobility. So the sample has been
heated at such temperature under vacuum as shown in Figure 5. A shift of TSC peaks toward higher temperatures indicate the departure of trapped
mol-Table 1. Havriliak-Negami Parameters Deduced from
the Fit for [G′1] T (°C) (S‚cmσ0-1) n τ (s) ǫst∆ǫ )- ǫ∞ RHN βHN ǫ′′T(ω) 80 1.5×10⁻¹³ 0.89 1.1 ×10⁻¹ 10.5 0.6 0.8 ǫ′′KK(ω) 1.5×10⁻¹ 10.7 0.5 1 ǫ′′T(ω) 85 5×10-13 0.99 1.4×10⁻² 12.4 0.6 1 ǫ′′KK(ω) 1.7×10⁻² 10.6 0.6 0.9 ǫ′′T(ω) 90 2.5×10⁻¹² 0.94 2.5×10⁻³ 12.6 0.7 0.7 ǫ′′KK(ω) 2.8×10⁻³ 11.5 0.7 0.9 ǫ′′T(ω) 95 9×10-12 0.95 5.6×10⁻⁴ 14 0.7 0.8 ǫ′′KK(ω) 6.2×10⁻⁴ 12.6 0.7 0.9 ǫ′′T(ω) 100 3.1×10⁻¹¹ 0.91 1.7×10⁻⁴ 15.6 0.7 0.7 ǫ′′KK(ω) 1.7×10⁻⁴ 15 0.6 1 ǫ′′T(ω) 105 8.5×10⁻¹¹ 0.91 6.6×10⁻⁵ 19.6 0.7 0.75 ǫ′′KK(ω) 6.4×10⁻⁵ 18 0.7 1 τHN(T))τ0exp
(
1 Rf(T-T∞))
(3)Figure 3. Vogel dependence of τHNfor theR-mode of [G′1]:
experimental points (O) with fit shown by the solid line and
calculated points from KK (0) with fit shown by the dashed
line.
Figure 4. Depolarization currents vs temperature for [G′1] to
[G′5]: [G′1] indicated byO, [G′23] by0, [G′3] by], [G′4] by4, and
[G′5] by3.
Table 2. Vogel-Tammann-Fulcher Parameters for the
Generation [G′1] Deduced from the Fit
τ0(s) Rf(K-1) T
∞(K) 1.25×10⁻¹⁰ 1.1
ecules. Such an antiplasticization effect under extraction of the solvent molecule validates the contribution of the cage molecule in the evolution of TSC peaks upon generation. This experimental behavior illustrates cage molecule properties (facilities for trapping) of dendrim-ers architecture. In the case of [G′1], a second
contribu-tion is pointed out: a conductivity phenomena calledσ.
This electronic disturbance is probably responsible for Imaxincreases (until 30 pA).
Discrete Distribution of Relaxation Times forr
Relaxation ModeThe resolution of the fine structure of complex spectra has been performed by using frac-tional polarizations. Elementary spectra are reported in Figure 6 for [G′3] as example. The polarization
window of 5 °C was shifted along the temperature axis by 5 °C for theRmode. These elementary spectra can
be analyzed by assuming the existence of a single relaxation time. This allows us to define the activation enthalpy variation as a function of the activation entropy for each isolated process. Activation parameters deduced from each elementary spectrum analysis are reported in Table 3 for the series from [G′1] to [G′5].
According to the usual behavior of activation parameters isolated in theRmode of polymeric materials, we have
plotted ∆S and ∆H on a compensation diagram as
shown in Figure 7. We note that the compensation temperature Tc is slightly above the glass transition
temperature Tgfor the series of dendrimers. This point
is consistent with previous works18 on a poly(methyl
methacrylate) series with increasing Mw. A
compensa-tion law, also called the Meyer-Neldel law, is observed.
It is characteristic of the cooperativity of theRmode in
phosphorus-containing dendrimers. We note also that enthalpy range is independent from generation (Figure 7 and Table 3): ∆H always increases, and it is
multi-plied by a factor ranging from 5 to 2.7. It was already shown19 that the enthalpy range (∆Hmax, ∆Hmin) is
characteristic of the dispersion of the relaxing units length. This enthalpy range∆Hmax - ∆Hminremains of
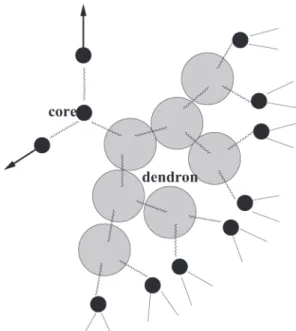
the same order of magnitude independently from gen-eration: it means that cooperatively rearranging regions having the same size distribution are explored. As phosphorus-containing dendrimers are characterized by a fractal architecture (Cayley tree): it means that the
Rrelaxation mode takes place in self-similar
neighbor-ing domains (Figure 8). Experiments carried out on [G′1] (dendrimers with aldehyde end groups) and [G1]
(dendrimers without aldehyde end groups) show thatR
mode is quasi-independent from the aldehyde groups. This comparative study shows that end groups are not implied inRrelaxation mode. In a previous work,6we
have shown that the aldehyde end groups are respon-sible for the low-temperatureβrelaxation mode. When
the number of generations increases, glass transition temperatures increase with topological interactions. The same shift is observed for the R relaxation mode
associated with the dielectric manifestation of the glass transition. Broad compensation phenomena analogous with those observed in polymers indicated the existence of a wide distribution of cooperatively rearranging regions (CRR), where molecular mobility takes place.
Figure 5. Antiplasticization phenomenon for [G′3]: the first
annealing (Tg +50 °C) and pumping indicated byO, the second
one indicated by0, and the third one indicated by4.
Figure 6. Elementary spectra obtained for [G′3].
Figure 7. Meyer-Neldel law for [G′1] to [G′5]: [G′1] indicated
byO, [G′2] by0, [G′3] by], [G′4] by4, and [G′5] by3.
Table 3. Activation Parameters Deduced fromElementary Spectra Analysis
generation g)1 g)2 g)3 g)4 g)5 Tg(°C) 69 124 125 149 159 Tc(°C) 74 138 125 140 163 |∆(Tc-Tg)|(°C) 5 14 0 9 4 ∆Hmax(kJ‚mol-1) 606 609 534 581 378 ∆Hmin(kJ‚mol-1) 121 186 146 119 138 r)(∆Hmax/∆Hmin) 5 3.3 3.7 5 2.7
It is important to note that neither the mobility of end groups nor the generation of dendrimers is implied.
Conclusion
The synergy of isothermal dielectric spectroscopy with thermostimulated currents analysis, underlined in a previous work,20has allowed us to explore the
coopera-tive molecular mobility liberated around the glass transition in dendrimers. To achieve a more complete analysis of the dynamics of theRrelaxation mode, the
Kramers-Kronig transform has been used. The
molec-ular mobility observed for frequencies higher than 1 Hz, exhibits a VTF behavior indicating an increase of the “apparent activation enthalpy” as the temperatures approach Tg. Then, following Donth’s model,21,22 this
behavior can be assigned to an increase of the size of domains where molecular mobility takes place. For frequency of some 10-2 Hz, the R relaxation mode is
observed below Tgi.e., in the vitreous state. Then, the R relaxation mode is due to a series of thermally
activated processes involving various dendrons se-quences: the domains where the molecular mobility takes place are frozen, and their size distribution is reflected by the width of the distribution of activation enthalpy. The metastability of the vitreous state is
responsible for structural relaxation. Some 100 °C below Tg, those domains behave as rigid hard spheres. A
localized molecular mobility is responsible for a β
re-laxation mode described elsewhere.6 It has been
as-signed to the local mobility of aldehydes situated at dendron ends. Such mobility of dendron ends has been related to a peculiar surface reactivity of dendrimers.
References and Notes
(1) Wooley, K. L.; Hawker, C. J.; Pochan, J. M.; Fre´chet, J. M.J. Macromolecules1993, 26, 1514 -1519.
(2) Dantras, E.; Dandurand, J.; Caminade, A. M.; Majoral, J. P.;Lacabanne, C. Macromolecules2002, 35, 2090 -2094. (3) Sendijarevic, I.; McHugh, A. J. Macromolecules2000, 33,
590-596.
(4) Uppulari, S.; Morrison, F. A.; Dvornic, P. R. Macromolecules2000 , 33, 2551-2560.
(5) Huwe, A.; Appelhans, D.; Prigann, J.; Voit, B. I.; Kremer, F. Macromolecules2000, 33, 3762-3766.
(6) Dantras, E.; Caminade, A. M.; Majoral, J. P.; Lacabanne, C. Macromolecules2001, 34, 3808-3811.
(7) Lartigue, M. L.; Donnadieu, B.; Galliot, G.; Caminade, A.-M.; Majoral, J.-P.; Fayet, J.-P. Macromolecules 1997, 30, 7335-7337.
(8) Majoral, J.-P.; Caminade, A.-M. Top. Curr. Chem.1998, 197, 79-124.
(9) Turrin, C.-O.; Maraval, V.; Leclaire, J.; Dantras, E.; Laca-banne, C.; Caminade, A.-M; Majoral, J.-P. Tetrahedron2003, 59, 3965-3973.
(10) Havriliak, S.; Negami, S. J. Polym. Sci., Part C1966, 14, 99 -117.
(11) Havriliak, S.; Negami, S. J. Polymer1967, 8, 161-210. (12) Steeman, P. A. M.; van Turnhout, J. Colloid Polym. Sci.1997,
275, 106-115.
(13) Chatain, D.; Gautier, P.; Lacabanne, C. J. Polym. Sci., Phys. Ed.1973, 11, 1631-1640.
(14) Teysse`dre, G.; Lacabanne, C. J. Phys. D, Appl. Phys.1995, 28, 1478-1487.
(15) Runt, J. P.; Fitzgerald, J. J. Dielectric spectroscopy of polymeric materials: Fundamentals and Applications; Ameri-can Chemical Society: Washington, DC, 1997; p 8. (16) McCrum, N.; G.; Read, B.; E.; Williams, G. Anelastic and
dielectric effects in polymeric solids; J. Wiley: New York, 1991.
(17) Leclaire, J.; Coppel, Y.; Caminade, A.-M.; Majoral, J.-P., submitted for publication in J. Am. Chem. Soc.2004. (18) Doulut, S.; Bacharan, C.; Demont, P.; Berne`s, A.; Lacabanne,
C. J. Non-Cryst. Solids1998, 235-237, 645-651.
(19) Samouillan, V.; Lamure, A.; Maurel, E.; Lacabanne, L.; Hornebeck, W. Biopolymers2001, 58, 175-185.
(20) Dantras, E.; Dudognon, E.; Samouillan, V.; Menegotto, J.; Berne`s, A.; Demont, P.; Lacabanne, C. J. Non-Cryst. Solids
2002, 307-310, 671-678.
(21) Donth, E. J. Non-Cryst. Solids1982, 53, 325-330. (22) Fischer, E. W.; Donth, E.; Steffen, W. Phys. Rev. Lett.68, 2344 1992,
-2346.
Figure 8. Schematic representation of a dendron with relaxation domains (shaded areas).
![Figure 6. Elementary spectra obtained for [G ′3 ].](https://thumb-eu.123doks.com/thumbv2/123doknet/2342937.34216/6.892.71.425.105.396/figure-elementary-spectra-obtained-g.webp)