.
Spatial Distribution
Blending of Radial HF Radar Surface Current and Model
Using ETKF Scheme For The Sunda Strait
Subekti Mujiasih
(1,2),
Mochammad Riyadi
(2), Dr Wandono
(2), I Wayan Suardana
(2),
I Nyoman Gede Wiryajaya
(2), I Nyoman Suarsa
(2), Dwi Hartanto
(2),
Alexander Barth
(1), and Jean-Marie Beckers
(1)Introduction
• HF Radar measures the radial surface currents but just certain coverage and expensive.
• Surface currents model can give estimation but It does not always represent real condition.
• Whereas, there are some findings :
• Blending method could be solution to get best estimation of model as well as real condition
• Blending can effectively be used to reduce the noise
.
Problem representation
The objective of this work is to learn quality of Blending resulted by Ensemble Transform Kalman Filter method in different R (observation error covariance matrix) either dependent Validation or Independent Validation. Calculation of ensemble analysis and ensemble mean was using Sangoma software package. The tested R which represents observation error covariance matrix, is a diagonal matrix with diagonal elements equal 0.02, 0.1 or 0.5 m²/s². Currently, our blending uses observation error covariance matrix R Assumption, which makes it easier to find a consistent result. Dependent Validation means the model analysis resulted from the observation itself compared to their own observations. Whereas, Independent Validation means the model analysis resulted from other site observation compared to their own observation. The results are represented by Root Mean Square (RMS) and Spatial Distribution
Conclusions and Further Work
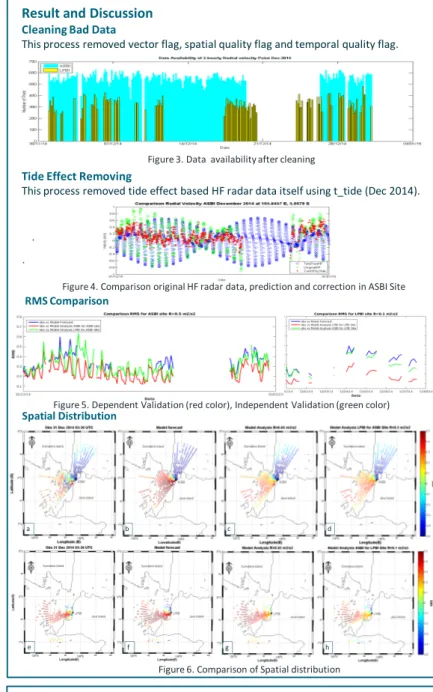
Blending result was verified that the analysis reproduces well-structured in the analyzed HF radar data, for all R at both of sites (red color in Fig.5), Spatial distribution in fig 6c and 6g. More importantly, the analysis was also improved relative to the second independent HF radar site (green color in Fig.5) and spatial distribution in fig 6d and 6h. One site was improved by 0.1 m2/s2 of R. The other was by 0.5 m2/s2 of R. It may be caused by incomplete of HF radar data from other site for blending. The incompleteness would be reconstructed in further work.
References
[1] Barth,A. , (2014) : Introduction to data assimilation applied to ocean models. In:Presentation - Stochastic Assimilation for the Next Generation Ocean Model Applications(Sangoma). Available online in http://www.data-assimilation.net [2] Barth, A., A. Alvera-Azcárate, K.-W. Gurgel, J. Staneva, A. Port, J.-M. Beckers,
and E. Stanev (2010), Ensemble smoother for optimizing tidal boundary conditions by assimilation of High-Frequency Radar surface currents. Application to the German Bight, Ocean Science, 6, 161-178, 2010.
(1)UNIVERSITY OF LIEGE, GHER, BELGIUM,
(2)INDONESIAN AGENCY FOR METEOROLOGY CLIMATOLOGY AND GEOPHYSICS (BMKG)
Data
• The Hourly-mean u and v component velocity June 2014 – May 2015 (8760 ensemble) from Global Ocean 1/12°Physics Analysis and Forecast updated Daily Copernicus - Marine environment monitoring service (CMEMS) model output.
• 3-hourly radial velocity one week (01-07 December 2014) from LPBI site and 3-hourly radial velocity one month (December 2014) from ASBI site of CODAR Seasonde radar in The Sunda Strait. The radial HF Radar data has a hourly temporal resolution, 20-60 km of spatial range,3 km of range resolution, 5 degree of angular resolution and spatial resolution, 11.5-14 MHz of frequency range
Figure 1. The Sunda Strait as Research Domain
Research Domain
Contact : [email protected]
Result and Discussion
Cleaning Bad Data
This process removed vector flag, spatial quality flag and temporal quality flag.
Figure 4. Comparison original HF radar data, prediction and correction in ASBI Site
Tide Effect Removing
This process removed tide effect based HF radar data itself using t_tide (Dec 2014).
.
Figure 5. Dependent Validation (red color), Independent Validation (green color)
RMS Comparison
Figure 6. Comparison of Spatial distribution a h g f e d c b
Methodology
Obs Site 2 Start ModelModel Forecast Blending by ETKF (Sangoma Ensemble Analysis)
HF Radar
Obs Site 1
Model Analysis Site 1 for Site 1
RMSE
End
Cleaning bad data
Tide Effect Removing
Dependent Validation
Independent Validation
Figure 2. Methodology
Model Analysis Site 1 for Site 2