HAL Id: hal-01915741
https://hal.archives-ouvertes.fr/hal-01915741
Submitted on 8 Nov 2018HAL is a multi-disciplinary open access
archive for the deposit and dissemination of sci-entific research documents, whether they are pub-lished or not. The documents may come from teaching and research institutions in France or abroad, or from public or private research centers.
L’archive ouverte pluridisciplinaire HAL, est destinée au dépôt et à la diffusion de documents scientifiques de niveau recherche, publiés ou non, émanant des établissements d’enseignement et de recherche français ou étrangers, des laboratoires publics ou privés.
properties and functional traits
Juliane Helm, Thierry Dutoit, Arne Saatkamp, Solveig Bucher, Matthias
Leiterer, Christine Römermann
To cite this version:
Juliane Helm, Thierry Dutoit, Arne Saatkamp, Solveig Bucher, Matthias Leiterer, et al.. Recovery of Mediterranean steppe vegetation after cultivation: legacy effects on plant composition, soil properties and functional traits. Applied Vegetation Science, Wiley, 2019, Applied Vegetation Science, 22, pp.71-84. �10.1111/avsc.12415�. �hal-01915741�
For Review Only
1
Recovery of Mediterranean steppe vegetation after cultivation: legacy effects on
2plant composition, soil properties and functional traits
3
4 Juliane Helm1,2, Thierry Dutoit3, Arne Saatkamp4, Solveig Franziska Bucher1, Matthias Leiterer5 &
5 Christine Römermann1,6
6
7 Helm, J. (Corresponding author, juliane.helm@bgc-jena.mpg.de)1,2
8 Dutoit, T. (thierry.dutoit@imbe.fr)3 9 Saatkamp, A. (arne.saatkamp@imbe.fr)4 10 Bucher, S. F. (solveig.franziska.bucher@uni-jena.de)1 11 Leiterer, M. (Matthias.Leiterer@tll.thueringen.de)5 12 Römermann, C. (christine.roemermann@uni-jena.de)1,6 13
14 1Institute of Ecology and Evolution, Department of Plant Biodiversity, Friedrich-Schiller-University
15 Jena, Philosophenweg 16, 07743 Jena, Germany
16 2Current address:Max-Planck Institute for Biogeochemistry, Department of Biogeochemical Processes,
17 Hans Knöll Str. 10, 07745 Jena, Germany
18 3Institut Méditerranéen de Biodiversité et d’Ecologie, Avignon Univ, Aix Marseille Univ, CNRS, IRD,
19 IMBE, IUT site Agroparc, 337 Chemin des Meinajaries BP 61207, F-84911 Avignon cedex 09, France 20 4Institut Méditerranéen de Biodiversité et d’Ecologie, Aix Marseille Univ, CNRS, IRD, Avignon Univ,
21 IMBE, Facultés St Jérôme case 421, F-13397 Marseille cedex 20, France
22 5Thüringer Landesanstalt für Landwirtschaft, Naumburger Str. 98, 07702 Jena, Germany
23 6German Centre for Integrative Biodiversity Research (iDiv) Halle-Jena-Leipzig, 04103 Leipzig,
24 Germany 25 26 27 28
For Review Only
29 Abstract
30 Questions: Are the vegetation structure and soil properties of fallows similar to adjacent 31 species-rich Mediterranean steppe communities 35 years after abandonment? Is there a
32 spontaneous re-development towards the original steppe vegetation after re-introduction of the
33 traditional grazing system? Can differences in functional trait composition be identified
34 according to different land-use types? Do traits of selected species affect the ability to
re-35 colonize fallow land?
36
37 Location: Mediterranean steppe of La Crau (Southeastern France) 38
39 Methods: We conducted 80 vegetation surveys and soil analyses in the steppe and adjacent 40 fallow land in six locations in La Crau in 2015; for three locations, data from 2001 was included.
41 To compare the functional composition of steppe vs. fallow land, community-weighted means
42 (CMW) of specific leaf area (SLA), leaf dry matter content (LDMC) and canopy height were
43 calculated. To test whether trait variability is associated with the re-colonization success of 12
44 selected target species, we measured SLA, LDMC, canopy height, plant width and aboveground
45 biomass on eight replicate individuals per site and species.
46
47 Results: Fallow land was characterized by lower species richness and elevated phosphorus and 48 potassium content in the soil. Comparing vegetation relevés between 2001 and 2015 revealed
49 that the fallows were developing towards steppe vegetation. CWMs of SLA were significantly
50 lower and CWM of LDMC higher in steppe than in fallow land. There was no similarity in trait
51 composition between steppe species that successfully re-colonized the fallow-land community,
52 and no evidence that intraspecific trait variability is associated with re-colonization success of
53 these species.
54
55 Conclusions: Even after decades of abandonment and re-introduction of the grazing system, 56 the vegetation structure, soil properties and plant functional trait composition of fallows differ
57 from those of adjacent steppe communities. These results illustrate the need for active
58 restoration to accelerate the recovery of former arable land to the target steppe communities.
59
60 Keywords: Community trait means; Cultivation; Dry Grassland; Grazing; Intraspecific trait 61 variability; Leaf dry matter content; Natural recovery; Restoration; Specific leaf area
62
63 Nomenclature: Jäger & Werner (2002); Pavon (2014) 64
65 Abbreviations: CV = coefficient of variation; CWM = community-weighted mean; ITV = 66 intraspecific trait variability; LDMC = leaf dry matter content; SLA = specific leaf area
67
68 Running head: Recovery of Mediterranean steppe vegetation
For Review Only
70
Introduction
71 Semi-natural grasslands including the steppes of the Mediterranean basin are among
72 Europe’s most species-rich ecosystems (Willems 1983; WallisDeVries et al. 2002).
73 Nevertheless, the 20th century’s agricultural intensification caused a dramatic decrease in steppe
74 grasslands worldwide and led to fragmentation as well as eutrophication of these habitats,
75 leading to a decrease in plant diversity (Poschlod et al. 1998; White et al. 2000; Karlik &
76 Poschlod 2009). To protect the species diversity and to better connect semi-natural grasslands,
77 grassland remnants need to be conserved or, if already altered, restored. For the restoration of
78 these species rich grasslands, several techniques have already been proposed (Kiehl et al. 2010
79 for review) as the natural colonization of characteristic grassland species into former intensively
80 cultivated areas is usually very slow (Römermann et al. 2005, Buisson et al. 2006). It has
81 already been shown that it might take several decades or centuries until the species composition
82 and diversities of grasslands return (Forey & Dutoit 2012); accordingly, active restoration
83 measures are typically needed.
84 To evaluate restoration success, traditional restoration studies assess the floristic similarity
85 between restored and original (target) vegetation, focussing on species composition as well as
86 diversity (Jaunatre et al., 2013). However, these indicators are highly dependent on site
87 characteristics that determine the local species-pool (Stuble et al. 2017). A complementary way
88 of assessing restoration success is to focus on the restoration of the functional composition
89 (Laughlin 2014, Engst et al. 2016), which is especially relevant for those sites where original
90 species are lost from the local species pool. The analyses of plant functional traits can provide
91 insights into how land-use changes affect vegetation dynamics and function (e.g. Römermann
92 et al. 2009, Breitschwerdt et al. 2015), but this trait-based approach has rarely been examined
93 in connection with restoration success in Mediterranean dry grasslands.
For Review Only
94 Various habitat filters (e.g., environmental factors such as climate conditions, soil properties,
95 or disturbance) allow only species with certain trait values to establish (Keddy 1992; Weiher &
96 Keddy 1995; Diaz et al. 1998; Venn et al. 2011). The species that pass these filters are
97 necessarily similar, which eventually leads to trait convergence (Diaz et al. 1998; Wilson 2007;
98 Laughlin et al. 2012). But, species also need to be dissimilar enough to avoid competition,
99 according to the limiting similarity hypothesis, which eventually leads to trait divergence
100 (MacArthur & Levins 1967; Wilson 2007; Cornwell & Ackerly 2009; Laughlin et al. 2012).
101 Comparing the functional composition of original vs. changed plant communities and analyzing
102 the trait composition of target species that have already successfully re-established in the
103 restoration sites seem promising as this approach complements the taxonomic evaluation of
104 restoration success, therewith leading to a better undestanding of the factors preventing
105 successful restoration
.
106 The aim of this study was to evaluate whether the taxonomic and functional composition of
107 fallow lands can develop into the direction of original steppe communities without having
108 established active restoration measures such as the addition of propagules.
109 We performed vegetation relevés to assess whether fallow lands re-developped into the
110 direction of the target steppe vegetation with respect to the species composition and diversity.
111 To elucidate the potential natural development of fallow land vegetation towards the original
112 steppe vegetation we analyzed temporal trends in vegetation changes by comparing vegetation
113 relevés and soil analyses from 2001 with results for 2015.
114 We explored the functional composition (community-weighted mean = CWM) of traits
115 related to plant performance and growth rate and as indicators of competitive ability and
116 environmental tolerance of species (Garnier 1992; Reich et al. 1997; Poorter et al. 2009;
117 Lauterbach et al. 2013; Pérez-Harguindeguy et al. 2013). Nutrient-rich environments such as
For Review Only
120 conservation strategies, slow growth rates and high longevity should dominate in nutrient poor
121 environments (Chapin et al. 1993; Garnier 1992; Lavorel & Garnier 2002; Pérez-Harguindeguy
122 et al. 2013; Poorter & Garnier 1999; Poorter & Remkes 1990; Römermann et al. 2009; Villar
123 et al. 2005). Canopy height reflects the competitive ability of plant communities through better
124 light assessment (Gaudet & Keddy 1988; Westoby et al. 2002), yet the investment in height
125 incurs costs for construction and maintenance of the stem (Falster & Westoby 2003) and thus
126 should be positively related to soil nutrient availability.
127 Intraspecific variation patterns in plant functional traits are a major determinant of the ability
128 to respond and evolve with climate change and changing environmental conditions (Nicotra et
129 al. 2010; Laforest-Lapointe et al. 2014; Bucher et al. 2017; Bucher et al. 2018). In some cases,
130 trait variability can even be more important than particular trait values: species showing high
131 functional variability may successfully re-establish because they manage to adapt to changing
132 environmental conditions (Albert et al. 2011; Jung et al. 2010). In addition to the above
133 mentioned traits we included additional plant width and biomass to test whether high
134 intraspecific trait variability is related to re-establishment success. Both traits reflect
135 competitive strength and should thus relate positively to soil nutrients (Pérez-Harguindeguy et
136 al. 2013).
137 To summarize, this study combines a taxonomic with a trait-based approach to i) identify
138 the effects of former land uses on present vegetation composition, species diversity and
139 physical-chemical soil parameters, and ii) investigate whether re-development towards the
140 original steppe vegetation can be detected after a further 14 years of recovery under traditional
141 grazing conditions (2001 vs. 2015). Moreover, we iii) investigate whether differences in CWM
142 of plant height, SLA and LDMC between fallow land and original steppe vegetation are still
143 observable and attempt to iv) determine whether the traits of successful colonizers show higher
144 functional variability than those of species that have not re-established on fallow lands yet.
For Review Only
145
Materials and Methods
146 Study sites
147 The plain of La Crau (Fig. 1) is the last remaining xeric steppe (Devaux et al. 1983) in
148 southeastern France (43°33´N, 4°52´W). The area was formed by ancient river deposits during
149 the Pleistocene period between 2 000 000 BP and 30 000 BP (Molliex et al. 2013). It has a
150 Mediterranean climate with a frequent, strong northwesterly wind, the Mistral. Siliceous
151 pebbles cover approximately 50% of La Crau, and plant roots are prevented from reaching the
152 alluvial water table by an impermeable conglomerate lying 40–60 cm deep (Colomb & Roux
153 1978). Traditionally, the land has been used for itinerant sheep grazing, probably since early
154 Neolithic times (Buisson & Dutoit 2006). Industry, military activities, quarries, highways and
155 intensive agriculture led to fragmentation and reduction of the semi-natural steppe vegetation
156 from approximately 60 000 ha to 11 500 ha in the 20th century (Buisson & Dutoit 2006; Deverre
157 1996; Etienne et al. 1998). During the period of melon cultivation (1965–1985), intensive
158 fertilization, herbicides and deep ploughing changed the soil structure and degraded the
159 conglomerate (Römermann et al. 2004, 2005). In contrast, cereals (1950–1966) were cultivated
160 without deep ploughing and using less fertilizer (Devaux et al. 1983; Masip 1991). At the time
161 of abandonment, no active restoration operations were realized. Grazing, representing an
162 important factor for the maintenance of these grasslands, was re-introduced immediately when
163 cultivation ceased (Dureau & Bonnefon 1998). The recovery of fallow land in our study area
164 was thus not a strictly passive restoration technique. The flocks of sheep link remaining steppe
165 patches (the target) and fallow lands and potentially facilitate the dispersal and establishment
166 of steppe species into fallow lands (Fischer et al. 1996).
167 Vegetation surveys
168 To investigate whether type of cultivation and time since abandonment play a role in
For Review Only
170 their land-use histories were examined (Table 1, Fig. 1). One long-abandoned and one recently
171 abandoned cereal field were included, to represent different time spans.
172 We conducted vegetation relevés on 20 m x 20 m sites, placing five replicate 2 m × 2 m
173 quadrats at each corner and in the middle (hereafter referred to as ‘plots’). Species cover was
174 estimated using the scale of Braun-Blanquet (1964). At each location, at least two sites
175 consisting of one undisturbed steppe plot and one adjacent fallow land plot grazed by the same
176 flock of sheep were studied. The locations Petit Abondoux, Poulagère and Couliès were
177 sampled in May 2014 (Tanet 2014; Fig. 1), and the locations Peau de Meau, Grand Abondoux
178 and Valigne in April 2015 (Fig. 1).
179 Percentages of vegetation cover, stone cover and bare ground were estimated on the five
180 plots at the time of vegetation sampling. To estimate the standing crop, we cut the total
181 aboveground biomass on three 0.5 m × 0.5 m randomly chosen quadrat within each site. The
182 leaf area index (LAI), the ratio of foliage area to ground surface area (Watson 1947), of each of
183 the five plots was measured using the LAI-2200C Plant Canopy Analyzer. Species richness S
184 representing the total number of species, Shannon diversity index (Hs) and Evenness (E) were
185 calculated for each plot (Mühlenberg 1993).
186 Soil sampling
187 To identify the effect of former land use on physical-chemical soil parameters, three replicate
188 mixed soil samples of the upper soil layer (0–10 cm) were collected randomly within each site.
189 After drying and sieving with a 2 mm mesh sieve, soil samples were analyzed at the INRA soil
190 analysis laboratory (Institut National de la Recherche Agronomique, Arras, France) according
191 to standardized protocols. Organic carbon (C in g kg-1) and total nitrogen content (N in g kg-1)
192 were analyzed via the dry combustion method using a CHN elemental analyzer (Vario EL
193 Elemental Analyzer, Elementar). Phosphorus content (P in g kg-1) was measured by the Olsen
194 method (Olsen 1954). Calcium (Ca in g kg-1), magnesium (Mg in g kg-1) and potassium (K in
195 g kg-1) were determined by the Metson method (Metson 1957). Additionally, soil pH was
For Review Only
196 measured in a 1:1 soil-water solution, after stirring once followed by a 24 h rest period.
Carbon-197 nitrogen ratio (C:N) and organic matter (OM in g kg-1) were calculated using total C and N
198 results. The amount of clay (> 0.002 mm), fine silt (0.002–0.02 mm), coarse silt (0.02–
199 0.05 mm), fine sand (0.05–0.2 mm) and coarse sand (0.2–2 mm) in g kg-1 were determined
200 according to the Robinson method (Robinson 1922) without previous decarbonation (Baize
201 2000).
202 Comparison of vegetation composition between 2001 and 2015
203 To investigate whether the vegetation composition of the fallow land had re-developed
204 towards the vegetation of unaltered steppes over the previous 14 years, we compared old
205 vegetation relevés from Römermann et al (2004, 2005) to recent vegetation relevés for the
206 locations Peau de Meau (steppe, cereal fallow, melon fallow; Table 1), Petit Abondoux (steppe,
207 cereal fallow; Table 1) and Valigne (steppe, melon fallow; Table 1). Ten replicate relevés were
208 carried out per site in 2001 and five in 2015.
209 Trait data and community-weighted means (CWM)
210 We compiled trait data for SLA (the ratio of fresh leaf area to dry mass in g cm-2), LDMC
211 (the ratio of dry mass to fresh mass in mg g-1) and canopy height (cm) for all species observed
212 in the vegetation relevés using the trait databases TRY (Kattge et al. 2011) and BROT (Paula
213 & Pausas 2013). This dataset was then supplemented with our own measurements for species
214 missing from the databases. For our own measurements, five individuals per species were
215 collected at the site where they were most abundant, following the approach described in
216 Rosbakh et al. (2015). Plants were collected and measured from May to July 2015, following
217 standardized protocols (Pérez-Harguindeguy et al. 2013). For each species, two healthy sun
218 leaves were collected, wrapped in moist paper and stored in a plastic bag in a cool box until the
219 fresh leaf weight was measured. The fresh leaf area was determined at 300 dpi on a flatbed
For Review Only
221 (Bernhardt-Römermann, unpubl.). Then, the leaves were dried at 70° C to constant mass and
222 subsequently weighed. For each vegetation relevé, we then calculated the CWM for SLA,
223 LDMC and canopy height according to:
Formula 1: 𝐶𝑊𝑀𝑐= 𝑠
∑
𝑖 = 1
𝑝𝑖𝑐× 𝑇𝑖𝑐
224 where the mean value of trait T for species i in the community c was weighted by species
225 relative abundance pic in the community, with a total of S species (Garnier et al. 2004; Violle et
226 al. 2007).
227 Species selection and trait measurements for intraspecific trait variability (ITV) 228 Species selection was based on vegetation relevés from 2001 (Römermann et al. 2004, 2005)
229 and 2014 (Tanet 2014). The final selection was based on indicator species analysis conducted
230 with the package ‘indicspecies’ (Cáceres & Legendre 2009) supplemented by expert knowledge.
231 We identified three successful colonizers as those occurring originally in the steppe but also in
232 the fallow land (Carthamus lanatus L., Lobularia maritima L Desv., Sideritis romana L.). Five
233 unsuccessful colonizers were limited to the steppe (B. retusum, Hypochaeris glabra L., Linum
234 trigynum L., Stipa capillata L., Trifolium campestre Schreb.). Four species whose major
235 distribution was in fallow land were added for comparison (Crepis foetida L., Dactylis
236 glomerata L., Galactites tomentosus Moench., Trifolium subterraneum L.). We sampled a
237 maximum of eight individuals per species and site if abundant: for details, see Table 2 and
238 Table 3. Besides SLA, LDMC and canopy height, we expanded our trait set to include plant
239 width (cm), aboveground biomass (g), seed mass (mg) and leaf carbon (leaf C in mg kg-1),
240 nitrogen (leaf N in mg kg-1) and phosphorus content (leaf P in mg kg-1; Table 3). Plant width was
241 measured with a measuring tape at maximum diameter without extending the plant, biomass
242 was dried at 70° C to constant mass and subsequently weighed. We determined average seed
243 mass by weighing five batches of 20–100 ripe seeds per species, depending on the species. Seed
For Review Only
244 sampling was not possible for B. retusum, H. glabra and S. capillata as seed production was
245 not sufficient in 2015. Due to insufficient plant material, leaf samples of the eight individuals
246 were pooled per site prior to nutrients analyses. Thus, ITV could not be calculated thereof but
247 leaf nutrients could be compared between the different land-use types (see Appendix S3).
248 To characterize the differences in trait composition between individuals measured in the
249 steppe and the fallow land sites, a principle component analysis (PCA) was conducted (matrix:
250 854 individuals of 9 species x 9 traits; H. glabra, B. retusum, T. subterraneum were excluded
251 because of data constraints – insufficient biomass and seeds available). Prior to analyses, data
252 was standardized to zero mean and unit variance.
253 To characterize ITV, the coefficient of variation (CV) was calculated as the standard
254 deviation divided by the mean for all measured traits (Pérez-Harguindeguy et al. 2013) based
255 on the eight individuals per species and site. ITV was calculated for all species occurring in the
256 steppe sites to assess whether species with higher trait variability were more likely to pass
257 through the environmental filter and thus manage to re-establish in fallow land. Therefore, we
258 included four unsuccessful colonizers three successful colonizers and two fallow land species
259 in our CV calculation (Table 2).
260 Statistical analyses
261 Vegetation composition and soil properties
262 To test for the effect of land-use history on vegetation structure (S, Hs, E, standing crop,
263 LAI, vegetation cover/stone cover/bare ground) and soil properties (clay, silt, sand, organic
264 matter, total C, total N, C:N, pH, P, Ca, Mg and K), one-way ANOVA followed by a Tukey
265 Honest Significant Difference post-hoc test was performed for normally distributed data with
266 homogeneous variances. Any data not showing normal distribution and homogeneous variances
267 were analyzed by the nonparametric Kruskal–Wallis test followed by the pairwise Wilcoxon
For Review Only
269 To assess associations between differences in vegetation composition and environmental
270 parameters, a detrended correspondence analysis (DCA) was conducted. We used species
271 abundances of the five vegetation relevés per site as the main matrix (a total of 12 species x 16
272 sites). Then, environmental parameters were correlated with the axes using mean values
273 calculated per site for each parameter. The environmental factors considered were five physical
274 soil variables (clays, fine and coarse silt, fine and coarse sand) and eight chemical soil variables
275 (total C, total N, C:N, pH, P, Ca, Mg and K) as well as percentage cover of vegetation, stones
276 and bare ground and time since abandonment as deduced from the fallow land cultivation period
277 (Table 1). All parameters were standardized to zero mean unit variance prior to analyses.
278 Comparison of vegetation composition between 2001 and 2015
279 As the 2001 data were obtained on 2m x 2m plots via the frequency method (Pfadenhauer et
280 al. 1986), we harmonized the data for 2001 and 2015 into presence/ absence data to avoid any
281 observer effects in the estimation of the frequencies and for the non-metric multidimensional
282 scaling (NMDS). Species that occurred just once across the overall dataset were removed to
283 avoid discriminating the dataset too strongly by their presence alone instead of discriminating
284 the gradient by their frequencies.
285 Differences in trait composition: Community-weighted means (CWM) and intraspecific trait
286 variability (ITV)
287 To analyze differences between CWM of the three land-use types and CVs, a one-way
288 ANOVA followed by a Tukey Honest Significant Difference post-hoc test was performed for
289 normally distributed data with homogeneous variances. Any data not showing normal
290 distribution and homogeneous variances were analyzed by the nonparametric Kruskal–Wallis
291 test followed by the pairwise Wilcoxon test with P-value adjustment according to Holm.
292 All statistical analyses were carried out in R (version 3.3.1, R Development Core Team 2015,
293 Vienna, AT). Multivariate analyses (DCA, PCA, NMDS) were performed using the R packages
294 ‘vegan’ (Oksanen et al. 2008) and ‘MASS’ (Venables & Ripley 2002).
For Review Only
295
Results
296 Vegetation and soil attributes
297 Vegetation structure and soil properties of fallow lands differed from those of adjacent
298 steppe (Table). The steppe showed highest values in species richness, Shannon diversity and
299 Evenness; cereal fallows typically had intermediate positions (Table 4). Melon fallows had
300 significantly higher values in soil Ca, P and pH. The C/N ration was highest in steppes.
301 The DCA (Fig. 2) showed a trend towards very homogeneous vegetation composition in the
302 steppe plots at different sites, whereas the fallow lands tended to be more heterogeneous in
303 vegetation composition. The first axis separated steppe from fallow land and was negatively
304 correlated with total soil C, vegetation cover and soil C:N ratio. Percentages of bare ground,
305 clays, pH and P were positively correlated with fallow land.
306 Comparison of vegetation composition between 2001 and 2015
307 In 2001, steppe and fallow lands had distinct species composition trends indicated by the
308 separated polygons of the NMDS (Fig. 3). Fourteen years later, the fallow land had developed
309 towards the original steppe vegetation, while there had been little change in steppe vegetation
310 composition. The steppe communities of both 2001 and 2015 were characterized by perennial
311 species, such as the dominant steppe species B. retusum and S. capillata and the annual species
312 Aira cupaniana Guss. and Linum strictum L.. Cereal fallows in 2001 commonly contained
313 Euphorbia falcata L. and Reseda phyteuma L., whereas Medicago monspeliaca L. and Poa
314 bulbosa L. were identified as late colonizers of these cereal fallows. Melon fallows in 2001
315 were characterized by Bromus rubens L., Bromus intermedius L., Hordeum murinum L. and
316 Rostraria cristata (L.) Tzvelev. In 2015, these species had declined and Plantago lagopus L.
317 and Catapodium rigidum (L.) C.E.Hubb. had become the typical melon fallow species. For
For Review Only
319 Differences in trait composition
320 As shown in Table 4, CWM of SLA was significantly lower in steppe than in fallow-land
321 communities (χ2 = 54.19, P < 0.001) while CWM of LDMC was significantly higher in steppe
322 communities (F2,77 = 52.38, P < 0.001). Canopy height differed among all the land-use types.
323 The highest values were observed in the steppe and the lowest in cereal fallows (F2,77 = 5.19,
324 P < 0.01). For individual species information see Appendix S1.
325 The PCA (Appendix S2) partly separated the species according to their trait composition
326 measured in the steppe and the fallow land. C. foetida, D. glomerata, L. trigynum and
327 S. romana showed a tendency towards a distinction between the steppe and fallow lands and
328 thus changes in plant trait values due to land-use change, as indicated by the black arrow.
329 The CV did not reveal any differences between successful and unsuccessful colonizers (Fig.
330 4). Overall, significant differences between species were found for SLA (χ2 = 27.44, P > 0.001),
331 LDMC (χ2 = 31.75, P > 0.001) and plant width (χ2 = 36.91, P > 0.001). L. trigynum, as a typical
332 steppe species, varied more in SLA than the fallow land species D. glomerata and the successful
333 colonizer S. romana. Regarding LDMC values, L. trigynum displayed the highest variability,
334 while B. retusum and D. glomerata had significantly lower variability. B. retusum had a
335 significantly lower CV in plant width than L. trigynum and S. romana. S. romana showed
336 significantly higher variation in plant width than C. lanatus (successful colonizer).
337
Discussion
338 The recovery of fallow land in our study area implemented grazing and was thus not a strictly
339 passive restoration technique. The fact that more than 35 years after cultivation has ceased the
340 studied vegetation did not fully transform to steppe calls for more active intervention, like
341 seeding and planting. Notwithstanding these results, the comparison of vegetation relevés from
342 2001 with results for 2015 indicated a (though slow) conversion of fallow land towards steppe
343 vegetation. Furthermore, there was no particular similarity in trait composition between steppe
For Review Only
344 species that successfully re-colonized fallow lands and the fallow-land community, and no
345 evidence that intraspecific trait variability is associated with re-colonization success of these
346 species.
347 Effect of former cultivation on vegetation attributes and soil parameters
348 Former cultivation practices still influence present vegetation attributes. The species
349 composition of recently abandoned cereal fallows can be distinguished from the species
350 composition of the steppe. However, in the long-abandoned cereal fallow, there is a visible
351 vegetation development towards the original steppe community.
352 Our results show that the dominant perennial steppe grass B. retusum has so far been unable
353 to re-establish on the fallow land; this is not only directly explained by habitat change due to
354 deep soil ploughing and high fertilization, but also indirectly by competition with the common
355 fallow land species (Buisson et al. 2015; Coiffait et al. 2012). Moreover, dispersal limitation
356 and the mainly vegetative reproduction of this steppe grass (Dureau & Bonnefon 1998) have
357 prevented successful re-establishment. The decline of C:N ratios on the fallow land can be
358 explained by organic matter mineralization and the absence of restitution from perennial grass
359 species unable to re-colonize fallow land (Römermann et al. 2004, 2005).
360 The high percentage of bare ground is characteristic of fallow land, where stones were
361 removed for cultivation purposes (Buisson & Dutoit 2006). However, stones create important
362 micro-habitats for the typical steppe vegetation: they preserve humidity, serve as shelter and
363 create safe sites for rhizomes of e.g., B. retusum (Bourrelly 1984; Caturla et al. 2000; Buisson
364 et al. 2015).
365 According to Janssens et al. (1998), plant diversity is limited by high soil fertility, especially
366 by plant-available phosphorus. The fallow land remains distinguished from the steppe by its
367 elevated phosphorus and potassium content due to former fertilization, as also observed by
368 Gough and Marrs (1990) on abandoned fields in the UK. Because of different cultivation regime intensities, i.e., deep ploughing, fertilization, the application of pesticides in melon-cultivated
For Review Only
370 areas (Masip 1991) versus less intensive cereal cultivation, phosphorus content was higher in
371 melon fallows than in cereal fallows. Deep ploughing for melon cultivation destroyed the upper
372 part of the geological conglomerate 40 cm deep in the soil, bringing some pieces of the matrix
373 (composed of CaCO3) to the surface. Hence, Ca content increased and higher pH was measured.
374 The effect of ploughing also appears in the physical soil parameters. As a result of soil
375 disturbance through ploughing, clays from the steppe subsoil layer (20–40 cm) were transported
376 to the topsoil, leading to a higher clay content for the fallow land (10–20 cm; Duclos 1994).
377 The opposite effect is observed for the coarse silt of the steppe, which was buried in the subsoil
378 as a result of ploughing (Bulot et al. 2017; Chenot et al. 2017).
379 Öster et al. (2009) found that in semi-natural grassland communities in Sweden, species
380 richness and similarity were still lower in fallow lands more than 50 years after cultivation.
381 Differences in plant attributes between calcareous grassland and fallow land after 60-100 years
382 were also shown by Fagan et al. (2008), Karlik & Poschlod (2009) and Forey and Dutoit (2012).
383 Remnants of fertilization persist in the soil of fallow land for many years and still affect plant
384 communities and the vegetation structure decades after abandonment (Willems et al. 1993;
385 Austrheim & Olsson 1999; Lepš 1999).
386 Comparison of vegetation structure between 2001 and 2015
387 The resurvey of the research site in 2015 shows a trajectory of the former cultivated areas
388 towards the original steppe community, even though differences in vegetation and soil structure
389 still exist. Although common in 2001, ruderal species H. murinum and R. cristata were not
390 recorded on melon fallows in 2015. Similarly, Bromus species- typical species in the first year
391 of abandonment- were less common on fallow land in 2015. In cereal fallows, not only weed
392 species but also some typical steppe species had established by 2015. The steppe vegetation did
393 not change over time because the disturbance regime (i.e., extensive grazing) remained stable
394 between 2001 and 2015 (Sauguet 2013). The more rapid development from cereal fallow
395 vegetation towards steppe vegetation was probably due to the fact that less fertilizer was applied
For Review Only
396 during cultivation and that there was no deep ploughing (Römermann et al. 2005, Buisson et al.
397 2006).
398 Effect of former cultivation on plant functional traits
399 This study confirms the relevance of the leaf traits SLA and LDMC at community level to
400 explain the response of ecosystems to land-use change, as proposed by previous studies (Díaz
401 et al. 2007; de Bello et al. 2010; Vandewalle et al. 2010). The steppe community was
402 characterized by smaller and denser leaves, typical of plants following a conservative strategy
403 (Grime 1973; Saatkamp et al. 2010; Pérez-Harguindeguy et al. 2013). Our study demonstrates
404 that the fallow land is still a nutrient-rich environment favoring communities with high SLA
405 and low LDMC. This is in line with findings demonstrating the association of low SLA with
406 efficient nutrient conservation strategies, nutrient-poor habitats, slow growth rates and high
407 longevity, as outlined above (Poorter & Remkes 1990; Garnier 1992; Chapin et al. 1993;
408 Poorter & Garnier 1999; Lavorel & Garnier 2002; Pérez-Harguindeguy et al. 2013). Our
409 analyses showing that the cereal fallows occupy an intermediate position with respect to trait
410 composition also reveal that type of cultivation plays an important role in re-development
411 towards the unaltered steppe vegetation. Plant height was greater in steppe communities than
412 in fallow land, contradicting our initial hypothesis. However, it is in line with findings from
413 Australian ecosystems (Falster & Westoby 2003) that showed positive relationships between
414 plant height and LAI. Our finding of higher plants in the steppe may be related to the higher
415 fodder quality in nutrient-rich fallow land, which could lead to preferential grazing by
416 herbivores, reducing plant height (Falster & Westoby 2003; Saatkamp et al. 2010). This
417 differential selection by herbivores of recently impacted sites due to their higher fodder quality
418 could also have implications for restoration (Yates et al. 2000). Tests of plant and soil mineral
419 content of our data revealed a significantly positive correlation between soil phosphorus and
420 leaf phosphorus content (r = 0.67, P < 0.001), soil nitrogen and leaf nitrogen content (r = 0.35,
For Review Only
422 We found no evidence of particular similarity between the trait values of successful
423 colonizers and those of the species typically found in fallow-land communities. We thus have
424 to reject the idea that colonizers simply “fit into” the assembly of recent fallow-land
425 communities with initial assembly conditions of high nutrient levels and recently-moved soil.
426 Alternatively, the data can be understood as indicating that successful colonizers exploit the
427 diverging conditions created during longer grazing periods with decreased nutrient status, and
428 that these colonizers may be better adapted to grazing than typical fallow-land species
429 (Saatkamp et al. 2010). However, our species pool was quite small with differences in sample
430 size, and further studies should consider a more extensive species set covering more families.
431 Furthermore, our data show higher functional variability to be highly species- and
trait-432 specific, with no clear pattern revealed for the trait values of successful or unsuccessful
433 colonizers. This supports the view that plants in fallow lands are assembled according to their
434 adaptability to specific grazed fallow-land conditions, rather than reflecting a wide intraspecific
435 trait variability that ensures their survival in both fallow-land and steppe communities. Hence,
436 our study suggests that plants with specifically high ITV are not favored in the assembly process
437 after abandonment and during grazing.
438 Conclusions and implications for management
439 Our study demonstrates that natural recovery of abandoned fallow land, notwithstanding its
440 close proximity to the target vegetation, can take more than 35 years, even when the traditional
441 grazing system is re-introduced just after cultivation abandonment. Regular monitoring of
442 further vegetation development in the abandoned fallow land would enable the potential for
443 natural recovery after a period of cultural land-use to be assessed.
444 In addition to monitoring natural recovery over the long term, new grazing systems could be
445 introduced to hasten recovery or more active restoration implemented by seeding nurse or
446 structuring species (e.g. B. retusum; Coiffait-Gombault et al., 2012; Buisson et al., 2015).
447 Future analyses could cover an extended set of species and include further traits to better
For Review Only
448 elucidate assembly processes. In particular, they should consider traits closely related to soil
449 water conditions, such as leaf venation traits and water-use efficiency, and traits related to soil
450 stoichiometry, such as root traits, mycorrhizal type (Jaunatre et al. 2016) and seed nutrient
451 content. Future projects need to identify project-specific restoration targets in order to
452 implement a trait-based approach into their restoration protocol.
453
Acknowledgments
454 We would like to thank the Conservatoire d'espaces naturels de Provence-Alpes-Côte d'Azur
455 (CEN PACA) and the Réserve Naturelle Nationale des Coussouls de Crau for their support
456 during field work. Thanks to Julie Tanet and Adeline Bulot working at the Mediterranean
457 Institute of Biodiversity and Ecology of Marseille for realizing the botanical relevés in 2014.
458 We acknowledge valuable comments of Karen Russel, Viktoria Wagner, Anna Johnson and an
459 anonymous referee. This study was supported by the TRY initiative on plant traits
460 (http://www.trydb.org) hosted, developed and maintained by J. Kattge and G. Bönisch
(Max-461 Planck-Institute for Biogeochemistry, Jena, Germany). TRY is/was supported by
462 DIVERSITAS, IGBP, the Global Land Project, the UK Natural Environment Research Council
463 (NERC) through its program QUEST (Quantifying and Understanding the Earth System), the
464 French Foundation for Biodiversity Research (FRB), and GIS "Climat, Environnement et
465 Société" France. CR acknowledges financial support by the German Research Foundation
466 (project RO 3842/3-1). The authors declare no conflict of interest.
467
468
References
469 Albert, C.H., Grassein, F., Schurr, F.M., Vieilledent, G. & Violle, C. 2011. When and how should 470 intraspecific variability be considered in trait-based plant ecology? Perspectives in Plant 471 Ecology, Evolution and Systematics 13: 217-225.
472 Austrheim, G. & Olsson, E.G.A. 1999. How does continuity in grassland management after ploughing 473 affect plant community patterns? Plant Ecology 145: 59-74.
For Review Only
474 Baize, D. 2000. Guide des analyses en pédologie: 2e édition, revue et augmentée. Editions Quae, FR. 475 Bucher, S.F., König, P., Menzel, A., Migliavacca, M., Ewald, J. & Römermann, C. 2018. Traits and 476 climate are associated with first flowering day in herbaceous species along elevational gradients. 477 Ecology and Evolution 8: 1147-1158.
478 Bourrelly, M. 1984. Contribution à l'étude écologique de la Crau (Bouches-du-Rhône). Caractéristiques 479 floristiques, dynamique annuelle, production primaire de la Crau steppique. Ph.D. thesis,
Aix-480 Marseille University, Marseille, FR.
481 Braun-Blanquet, J. 1964. Pflanzensoziologie : Grundzuge der Vegetationskunde, Springer-Verlag, Wien.
482 AT.
483 Breitschwerdt, E., Jandt, U. & Bruelheide, H. 2015. Do newcomers stick to the rules of the residents? 484 Designing trait-based community assembly tests. Journal of Vegetation Science 26: 219-232. 485 Bucher, S. F., Auerswald, K., Grün-Wenzel, C., Higgins, S. I., Garcia Jorge, J. & Römermann, C. 2017. 486 Stomatal traits relate to habitat preferences of herbaceous species in a temperate climate. Flora
487 229: 107-115.
488 Buisson, E., Corcket, E. & Dutoit, T. 2015. Limiting processes for perennial plant reintroduction to 489 restore dry grasslands. Restoration Ecology 23: 947-954.
490 Buisson, E. & Dutoit, T. 2004. Colonisation by native species of abandoned farmland adjacent to a 491 remnant patch of Mediterranean steppe. Plant Ecology 174: 371-384.
492 Buisson, E. & Dutoit, T. 2006. Creation of the natural reserve of La Crau: implications for the creation 493 and management of protected areas. Journal of Environmental Management 80: 318-326. 494 Buisson, E., Dutoit, T., Torre, F., Römermann, C. & Poschlod, P. 2006. The implications of seed rain 495 and seed bank patterns for plant succession at the edges of abandoned fields in Mediterranean 496 landscapes. Agriculture, Ecosystems & Environment 115: 6-14.
497 Bulot, A., Potard, K., Bureau, F., Bérard, A. & Dutoit, T. 2017. Ecological restoration by soil transfer: 498 impacts on restored soil profiles and topsoil functions. Restoration Ecology 25: 354-366. 499 Cáceres, M.D. & Legendre, P. 2009. Associations between species and groups of sites: indices and 500 statistical inference. Ecology 90: 3566-3574.
501 Caturla, R.N., Raventós, J., Guàrdia, R. & Vallejo, V.R. 2000. Early post-fire regeneration dynamics of 502 Brachypodium retusum Pers.(Beauv.) in old fields of the Valencia region (eastern Spain). Acta
503 Oecologica 21: 1-12.
504 Chapin, F.S., Autumn, K. & Pugnaire, F. 1993. Evolution of suites of traits in response to environmental 505 stress. American Naturalist: S78-S92.
506 Chenot, J., Jaunatre, R., Buisson, E. & Dutoit, T. 2017. Long-term effects of topsoil transfer assessed 507 thirty years after rehabilitation of dry alluvial quarries in Southeastern France. Ecological 508 Engineering 99: 1-12.
509 Coiffait, C., Buisson, E. & Dutoit, T. 2012. Using a two-phase sowing approach in restoration – sowing 510 foundation species to restore and subordinate species to evaluate restoration success. Applied 511 Vegetation Science 15: 277-289.
512 Colomb, E. & Roux, R. 1978. La Crau, données nouvelles et interprétations. Géologie méditerranéenne
513 5: 303-324.
514 Cornwell, W.K. & Ackerly, D.D. 2009. Community assembly and shifts in plant trait distributions across 515 an environmental gradient in coastal California. Ecological Monographs 79: 109-126.
For Review Only
516 de Bello, F., Lavorel, S., Díaz, S., Harrington, R., Cornelissen, J.H., Bardgett, R.D., Berg, M.P., Cipriotti, 517 P., Feld, C.K. & Hering, D. 2010. Towards an assessment of multiple ecosystem processes and 518 services via functional traits. Biodiversity and Conservation 19: 2873-2893.
519 Devaux, J., Archiloque, A., Borel, L., Bourrelly, M. & Louis-Palluel, J. 1983. Notice de la carte phyto-520 écologique de la Crau (Bouches du Rhône). Biologie et écologie méditerranéenne 10: 5-54. 521 Deverre, C. 1996. La nature mise au propre dans la steppe de Crau et la forêt du Var. Études rurales
522 141-142: 45-61.
523 Diaz, S., Cabido, M. & Casanoves, F. 1998. Plant functional traits and environmental filters at a regional 524 scale. Journal of Vegetation Science 9: 113-122.
525 Dureau, R. & Bonnefon, O. 1998. Etude des pratiques de gestion pastorale des coussouls. Patrimoine 526 nature et pratiques pastorales en Crau. Ed. CEEP Ecomusée de Crau: 61-89.
527 Dutoit, T., Buisson, E., Fadda, S., Henry, F., Coiffait-Gombault, C., Jaunatre, R., Alignan, J.F., Masson, 528 S. & Bulot, A. 2013. The pseudo-steppe of La Crau (South-Eastern France): origin, management 529 and restoration of a Mediterranean rangeland. In: Traba J. Morales M (eds.) Steppe Ecosystems: 530 Biological Diversity, Management and Restoration, pp. 287-301. Nova Science Publishers,
531 Hauppauge, New York, US.
532 Engst, K., Baasch, A., Erfmeier, A., Jandt, U., May, K., Schmiede, R., & Bruelheide, H. 2016. 533 Functional community ecology meets restoration ecology: Assessing the restoration success of 534 alluvial floodplain meadows with functional traits. Journal of Applied Ecology 53: 751-764. 535 Etienne, M., Aronson, J. & Le Floc’h, E. 1998. Abandoned lands and land use conflicts in southern 536 France. Piloting ecosystem trajectories and redesigning outmoded landscapes in the 21st century. 537 In: Rundel P.W., Montenegro G. and Jaksic F.M. (eds.) Landscape disturbance and biodiversity 538 in Mediterranean-type ecosystems, pp. 127-140. Ecological Studies, Springer-Verlag, Berlin,
539 DE.
540 Fagan, K.C., Pywell, R.F., Bullock, J.M. & Marrs, R.H. 2008. Do restored calcareous grasslands on 541 former arable fields resemble ancient targets? The effect of time, methods and environment on 542 outcomes. Journal of Applied Ecology 45: 1293-1303.
543 Falster, D.S. & Westoby, M. 2003. Plant height and evolutionary games. Trends in Ecology & Evolution
544 18: 337-343.
545 Fischer, S.F., Poschlod, P. & Beinlich, B. 1996. Experimental studies on the dispersal of plants and 546 animals on sheep in calcareous grasslands. Journal of Applied Ecology: 1206-1222.
547 Forey, E. & Dutoit, T. 2012. Vegetation, soils and seed banks of limestone grasslands are still impacted 548 by former cultivation one century after abandonment. Community Ecology 13: 194-202.
549 Garnier, E. 1992. Growth analysis of congeneric annual and perennial grass species. Journal of Ecology
550 80: 665-675.
551 Garnier, E., Cortez, J., Billès, G., Navas, M.-L., Roumet, C., Debussche, M., Laurent, G., Blanchard, 552 A., Aubry, D. & Bellmann, A. 2004. Plant functional markers capture ecosystem properties 553 during secondary succession. Ecology 85: 2630-2637.
554 Gaudet, C.L. & Keddy, P.A. 1988. A comparative approach to predicting competitive ability from plant 555 traits. Nature 334: 242-243.
556 Gough, M. & Marrs, R. 1990. A comparison of soil fertility between semi-natural and agricultural plant 557 communities: Implications for the creations of species-rich grassland on abandoned agricultural 558 land. Biological Conservation 51: 83-96.
For Review Only
559 Grime, J.P. 1973. Competitive exclusion in herbaceous vegetation. Nature, UK 242: 344-347.
560 Jäger, E.J. & Werner, K. 2002. Rothmaler, Exkursionsflora von Deutschland. Gefäßpflanzen: Kritischer 561 Band 9. Springer Spektrum, Berlin Heidelberg, DE.
562 Janssens, F., Peeters, A., Tallowin, J., Bakker, J., Bekker, R., Fillat, F. & Oomes, M. 1998. Relationship 563 between soil chemical factors and grassland diversity. Plant and Soil 202: 69-78.
564 Jaunatre, R., Fonvieille, N., Spiegelberger, T., Buisson, E., & Dutoit T. 2016. Recovery of arbuscular 565 mycorrhizal fungi root colonization after severe anthropogenic disturbance: four species 566 assessed in old-growth Mediterranean grassland. Folia Geobotanica 51: 319-332.
567 Jung, V., Violle, C., Mondy, C., Hoffmann, L. & Muller, S. 2010. Intraspecific variability and trait‐based 568 community assembly. Journal of Ecology 98: 1134-1140.
569 Karlik, P. & Poschlod, P. 2009. History or abiotic filter: which is more important in determining the 570 species composition of calcareous grasslands? Preslia 81: 321-340.
571 Kattge, J., Diaz, S., Lavorel, S., Prentice, I., Leadley, P., Bönisch, G., Garnier, E., Westoby, M., Reich, 572 P.B., (…) & Wright, I. 2011. TRY–a global database of plant traits. Global Change Biology 17:
573 2905-2935.
574 Keddy, P.A. 1992. Assembly and response rules: two goals for predictive community ecology. Journal 575 of Vegetation Science 3: 157-164.
576 Kiehl, K., Kirmer, A., Donath, T. W., Rasran, L., & Hölzel, N. 2010. Species introduction in restoration 577 projects–Evaluation of different techniques for the establishment of semi-natural grasslands in 578 Central and Northwestern Europe. Basic and Applied Ecology 11: 285-299.
579 Kuznetsova, A., Brockhoff, P.B. & Christensen, R.H.B. 2015. lmerTest: Tests in Linear Mixed Effects 580 Models. R package version 2.0-29.
581 Laforest-Lapointe, I., Martínez-Vilalta, J. & Retana, J. 2014. Intraspecific variability in functional traits 582 matters: case study of Scots pine. Oecologia 175: 1337-1348.
583 Laughlin, D.C. 2014. Applying trait‐based models to achieve functional targets for theory‐driven 584 ecological restoration. Ecology Letters 17: 771-784.
585 Laughlin, D.C., Joshi, C., Bodegom, P.M., Bastow, Z.A. & Fulé, P.Z. 2012. A predictive model of 586 community assembly that incorporates intraspecific trait variation. Ecology Letters 15:
1291-587 1299.
588 Lauterbach, D., Römermann, C., Jeltsch, F. & Ristow, M. 2013. Factors driving plant rarity in dry 589 grasslands on different spatial scales: a functional trait approach. Biodiversity and Conservation
590 22: 2337-2353.
591 Lavorel, S. & Garnier, E. 2002. Predicting changes in community composition and ecosystem 592 functioning from plant traits: revisiting the Holy Grail. Functional ecology 16: 545-556. 593 Lenth, R.V. 2016. lsmeans: Least-Squares Means. R Package version 2.22.
594 Lepš, J. 1999. Nutrient status, disturbance and competition: an experimental test of relationships in a 595 wet meadow. Journal of Vegetation Science 10: 219-230.
596 MacArthur, R. & Levins, R. 1967. The limiting similarity, convergence, and divergence of coexisting 597 species. American Naturalist 101: 377-385.
598 Masip, A. 1991. Le peuplement végétal de la Réserve de Peau de Meau. Données pour la gestion.Ph.D. 599 thesis, University of Barcelona. Barcelona, ES.
For Review Only
600 Metson, A.J. 1957. Methods of chemical analysis for soil survey samples. Soil Science 83: 245.
601 Molliex, S., Siame, L.L., Bourlès, D.L., Bellier, O., Braucher, R. & Clauzon, G. 2013. Quaternary 602 evolution of a large alluvial fan in a periglacial setting (Crau Plain, SE France) constrained by 603 terrestrial cosmogenic nuclide (10 Be). Geomorphology 195: 45-52.
604 Mühlenberg, M. 1993. Freilandökologie. UTB für Wissenschaft, 3rd ed. Quelle & Meyer, Heidelberg,
605 Wiesbaden, DE.
606 Nicotra, A.B., Atkin, O.K., Bonser, S.P., Davidson, A.M., Finnegan, E., Mathesius, U., Poot, P., 607 Purugganan, M.D., Richards, C. & Valladares, F. 2010. Plant phenotypic plasticity in a changing 608 climate. Trends in Plant Science 15: 684-692.
609 Oksanen, J., Kindt, R., Legendre, P., O’Hara, B., Stevens, M.H.H., Oksanen, M.J. & Suggests, M. 2007. 610 Vegan: Community ecology package. R package version 2.0-10.
611 Olsen, S.R. 1954. Estimation of available phosphorus in soils by extraction with sodium bicarbonate. 612 United States Department of Agriculture, Washington, DC, US.
613 Öster, M., Ask, K., Cousins, S.A. & Eriksson, O. 2009. Dispersal and establishment limitation reduces 614 the potential for successful restoration of semi‐natural grassland communities on former arable 615 fields. Journal of Applied Ecology 46: 1266-1274.
616 Paula, S. & Pausas, J. 2013. BROT: a plant trait database for Mediterranean Basin species. Version 617 2013.06. http:// www.uv.es/jgpausas/brot.htm.
618 Pavon, D. 2014. Mémento pour l’aide à la détermination de la flore vasculaire du département des 619 Bouches-du-Rhône. Bulletin de la Société linnéenne de Provence. Numero spécial 18.
620 Pérez-Harguindeguy, N., Díaz, S., Garnier, E., Lavorel, S., Poorter, H., Jaureguiberry, P., Bret-Harte, 621 M., Cornwell, W., Craine, J., (…) & Cornelissen, J.H.C. 2013. New handbook for standardised 622 measurement of plant functional traits worldwide. Australian Journal of Botany 61: 167-234. 623 Pfadenhauer, J., Poschlod, P. & Buchwald, R. 1986. Überlegungen zu einem Konzept geobotanischer 624 Dauerbeobachtungsflächen für Bayern. Teil 1. Methodik der Anlage und Aufnahme. Bayerische 625 Akademie für Naturschutz und Landschaftspflege 10: 41-60.
626 Poorter, H. & Garnier, E. 1999. Ecological significance of inherent variation in relative growth rate and 627 its components. Handbook of functional Plant Ecology 20: 81-120.
628 Poorter, H., Niinemets, Ü., Poorter, L., Wright, I.J. & Villar, R. 2009. Causes and consequences of 629 variation in leaf mass per area (LMA): a meta‐analysis. New Phytologist 182: 565-588.
630 Poorter, H. & Remkes, C. 1990. Leaf area ratio and net assimilation rate of 24 wild species differing in 631 relative growth rate. Oecologia 83: 553-559.
632 Poschlod, P., Kiefer, S., Tränkle, U., Fischer, S. & Bonn, S. 1998. Plant species richness in calcareous 633 grasslands as affected by dispersability in space and time. Applied Vegetation Science 1: 75-91. 634 Reich, P.B., Walters, M.B. & Ellsworth, D.S. 1997. From tropics to tundra: global convergence in plant 635 functioning. Proceedings of the National Academy of Sciences 94: 13730-13734.
636 Robin, V., Nelle, O, Talon T., Poschlod, P., Schwartz, D., Bal M.C., Allée, P., Vernet, J.L. & Dutoit T. 637 2018. A comparative review of soil charcoal data: spatiotemporal patterns of origin and long-638 term dynamics of Western European nutrient-poor grasslands. The Holocene (in press)
639 Römermann, C., Bernhardt-Römermann, M., Dutoit, T., Poschlod, P. & Rolando, C. 2004. Histoire 640 culturale de la Crau: potentialités de ré-établissement des espèces caractéristiques du coussous
For Review Only
642 Römermann, C., Dutoit, T., Poschlod, P. & Buisson, E. 2005. Influence of former cultivation on the 643 unique Mediterranean steppe of France and consequences for conservation management. 644 Biological Conservation 121: 21-33.
645 Römermann, C., Bernhardt-Römermann, M., Kleyer, M. & Poschlod, P. 2009. Substitutes for grazing 646 in semi-natural grasslands – do mowing or mulching represent valuable alternatives to maintain 647 vegetation structure? Journal of Vegetation Science 20: 1086-1098.
648 Römermann, C., Bucher, S. F., Hahn, M. & Bernhardt-Römermann, M. 2016. Plant functional traits - 649 fixed facts or variable depending on the season? Folia Geobotanica 51: 143-159.
650 Robinson, G. (1922). A new method for the mechanical analysis of soils and other dispersions. The 651 Journal of Agricultural Science, 12(3), 306-321.
652 Rosbakh, S., Römermann, C. & Poschlod, P. 2015. Specific leaf area correlates with temperature: new 653 evidence of trait variation at the population, species and community levels. Alpine Botany 125:
654 79-86.
655 Saatkamp, A., Römermann, C. & Dutoit, T. 2010. Plant functional traits show non-linear response to 656 grazing. Folia Geobotanica, 45: 239-252.
657 Sauguet, F. 2013. L’élevage ovin en Crau: situation économique, enjeux et perspectives. In: Écologie et 658 conservation d’une steppe méditerranéenne. La plaine de Crau, pp. 192-205. Editions Quae,
659 FR.
660 Tanet, J. 2014. Les fourmis sont-elles de bons indicateurs de la régénération spontanée des pelouses 661 sèches méditerranéennes après dégradation culturale? Master Thesis. Aix-Marseille University,
662 Marseille, FR.
663 Vandewalle, M., De Bello, F., Berg, M.P., Bolger, T., Dolédec, S., Dubs, F., Feld, C.K., Harrington, R., 664 Harrison, P.A., (…) & Woodcock, B. A.2010. Functional traits as indicators of biodiversity 665 response to land use changes across ecosystems and organisms. Biodiversity and Conservation
666 19: 2921-2947.
667 Venables, W. & Ripley, B. 2002. Modern Applied Statistics with S. 4th ed. Springer-Verlag, New York,
668 USA.
669 Venn, S.E., Green, K., Pickering, C.M. & Morgan, J.W. 2011. Using plant functional traits to explain 670 community composition across a strong environmental filter in Australian alpine snowpatches. 671 Plant Ecology 212: 1491-1499.
672 Villar, R., Maranon, T., Quero, J.L., Panadero, P., Arenas, F. & Lambers, H. 2005. Variation in relative 673 growth rate of 20 Aegilops species (Poaceae) in the field: the importance of net assimilation rate 674 or specific leaf area depends on the time scale. Plant and Soil 272: 11-27.
675 Violle, C., Navas, M.L., Vile, D., Kazakou, E., Fortunel, C., Hummel, I. & Garnier, E. 2007. Let the 676 concept of trait be functional! Oikos 116: 882-892.
677 WallisDeVries, M.F., Poschlod, P. & Willems, J.H. 2002. Challenges for the conservation of calcareous 678 grasslands in northwestern Europe: integrating the requirements of flora and fauna. Biological 679 Conservation 104: 265-273.
680 Watson, D.J. 1947. Comparative physiological studies on the growth of field crops: I. Variation in net 681 assimilation rate and leaf area between species and varieties, and within and between years. 682 Annals of Botany 11: 41-76.
683 Weiher, E. & Keddy, P.A. 1995. Assembly rules, null models, and trait dispersion: new questions from 684 old patterns. Oikos 74: 159-164.
For Review Only
685 Weiher, E., Werf, A., Thompson, K., Roderick, M., Garnier, E. & Eriksson, O. 1999. Challenging 686 Theophrastus: a common core list of plant traits for functional ecology. Journal of Vegetation 687 Science 10: 609-620.
688 Westoby, M. 1998. A leaf-height-seed (LHS) plant ecology strategy scheme. Plant and Soil 199:
213-689 227.
690 Westoby, M., Falster, D.S., Moles, A.T., Vesk, P.A. & Wright, I.J. 2002. Plant ecological strategies: 691 some leading dimensions of variation between species. Annual review of Ecology and 692 Systematics 33: 125-159.
693 White, R.P., Murray, S., Rohweder, M., Prince, S. & Thompson, K. 2000. Grassland ecosystems. World 694 Resources Institute, Washington, DC, US.
695 Willems, J. 1983. Species composition and above ground phytomass in chalk grassland with different 696 management. Vegetatio 52: 171-180.
697 Willems, J., Peet, R.K. & Bik, L. 1993. Changes in chalk‐grassland structure and species richness 698 resulting from selective nutrient additions. Journal of Vegetation Science 4: 203-212.
699 Wilson, J.B. 2007. Trait‐divergence assembly rules have been demonstrated: Limiting similarity lives! 700 A reply to Grime. Journal of Vegetation Science 18: 451-452.
701 Yates, C.J., Norton, D.A. & Hobbs, R.J. 2000. Grazing effects on plant cover, soil and microclimate in 702 fragmented woodlands in south‐western Australia: implications for restoration. Austral Ecology
703 25: 36-47.
704 Yulin, L., Johnson, D.A., Yongzhong, S., Jianyuan, C. & Zhang, T. 2005. Specific leaf area and leaf dry 705 matter content of plants growing in sand dunes. Botanical Bulletin of Academia Sinica 46:
127-706 134.
707
708 Supporting Information
709
710 Appendix S1. Trait values of specific leaf area (SLA), leaf dry matter content (LDMC) and canopy
711 height for all species.
712 Appendix S2. Principal component analysis (PCA) of the species–trait matrix (9 species × 9 traits).
713 Appendix S3. Leaf nutrient content of carbon (C), nitrogen (N) and phosphorus (P) compared between
714 original steppe and fallow lands. 715
For Review Only
Table 1. Overview of the land-use history of the study sites in La Crau studied in 2015. *Comparison
between 2001 and 2015.
Location Study sites Land-use type Abbreviation Cultivation period
Peau de Meau steppe steppe steppe cereal fallow cereal fallow melon fallow -melons, cereals melons, cereals melons PM_CSa* PM_CSb PM_CSc PM_MCa* PM_MCb PM_ME* -1974–1977 1969–1970 1965–1968, 1984
Petit Abondoux steppe cereal fallow* -melons, cereals PA_CS PA_MC* -1979–1984
Grand Abondoux steppe melon fallow -melons GA_CS GA_ME -1980–1981 Valigne steppe melon fallow -melons VA_CS* VA_ME* -1978, 1984 Poulagère steppe
old cereal fallow
-cereals PO_CS PO_OC -< 1900 Couliès steppe
recent cereal fallow
-cereals CO_CS CO_RC -1994, 2000 *comparison between 2001 and 2015
For Re
Table 2. List of the 12 species, classified into unsuccessful colonizers, fallow-land species and
successful colonizers, on which trait measurements were performed on the study sites (Table 1) in 2015.
Species group Species Abbreviation Family Individuals sampled per species
Brachypodium retusum (Pers.) P. Beauv. Bra_ret Poaceaea 64
Hypochaeris glabra L. Hyp_gla Asteraceae 15
Linum trigynum L. Lin_tri Linaceae 120
Stipa capillata L. Sti_cap Poaceae 110
Unsuccessful colonizers
Trifolium campestre Schreb. Tri_cam Fabaceae 59
Crepis foetida L. Cre_foe Asteraceae 128
Dactylis glomerata L. Dac_glo Poaceae 128
Galactites tomentosus Moench. Gal_tom Asteraceae 52
Fallow-land species
Trifolium subterraneum L. Tri_sub Fabaceae 16
Carthamus lanatus L. Car_lan Asteraceae 125
Lobularia maritima L. Desv. Lob_mar Brassicaceae 128
Successful colonizers
For Review Only
Table 3. Plant functional traits measured on 12 focal species (Table 2). *These plant traits are not part
of the main study, but available in Supporting Information (Appendix S2, S3).
Organ Plant trait Abbreviation Unit Measurements per site
Whole plant Canopy height cm 8 individuals
Plant width cm 8 individuals
Aboveground biomass g 8 individuals Leaf Specific leaf area SLA g cm-2 8 individuals
Leaf dry matter content LDMC mg g-1 8 individuals
Leaf carbon content* Leaf C mg g-1 pooled
Leaf nitrogen content* Leaf N mg g-1 pooled
Leaf phosphorus content* Leaf P mg g-1 pooled
Seed Seed mass* mg 5 individuals
Page 28 of 36 Applied Vegetation Science
For Review Only
Table 4. Summary of mean ± standard error (SE) of the measured vegetation and soil parameters and
community-weighted means (CWM) for the three land-use types. The statistical test values are given. Different letters indicate significant differences between the three land-use types as extracted from pair-wise tests. *** P < 0.001; ** P < 0.01; * P < 0.05; n.s. P > 0.05
Steppe Cereal Melon Statistical
test values
Mean ± SE Mean ± SE Mean ± SE
Species richness 35.3±0.1 a 29.0±1.6 b 22.7±1.5 c χ² = 27.5*** Shannon diversity index 2.6±0.06 a 2.3±0.1 a 1.9±0.09 b χ² = 24.7*** Evenness 0.7±0.01 a 0.7±0.02 a 0.6±0.02 b χ² = 15.9*** Standing crop 42.8±1.2 a 17.9±0.7 b 18.7±0.8 b F = 289.5*** Leaf area index 3.0±0.1 a 1.3±0.2 b 1.0±0.1 b F = 57.2*** Vegetation cover 60.3±1.9 a 50.2±3.2 b 43.7±3.4 b F = 10.2*** Stone cover 46.5±1.2 a 36.6±2.5 b 45.0±2.0 a F = 10.7*** Vegetat ion Bare ground 9.9±0.7 b 16.2±1.2 a 18.8±2.5 a F = 13.6*** Clays 192.7±2.0 c 202.2±3.4 b 213.4±2.6 a F = 20.0*** Fine silt 192.1±1.7 191.4±1.1 194.3±2.3 n.s. Coarse silt 161.5±4.0 a 140.1±1.2 b 144.6±2.1 b F = 12.0*** Fine sand 210.8±4.8 203.7±3.2 214.4±5.4 n.s. Coarse sand 242.9±6.2 b 262.7±4.2 a 233.2±7.8 b F = 7.2** Total Carbon 16.2±0.3 15.6±0.2 15.4±0.6 n.s. Total Nitrogen 1.4±0.03 1.5±0.02 1.5±0.05 n.s. Carbon-Nitrogen ratio 11.0±0.06 a 10.6±0.04 b 10.5±0.09 b F = 25.0*** Organic matter 28.0±0.5 26.9±0.4 26.59±1.1 n.s. pH 6.9±0.04 c 7.1±0.03 b 7.25±0.05 a F = 20.6*** Phosphorus 0.009±0.0003 b 0.03±0.006 a 0.04±0.007 a F = 22.0*** Calcium 1.4±0.03 b 1.5±0.03 ab 1.6±0.05 a F = 7.2** Magnesium 0.9±0.009 0.9±0.02 0.9±0.03 n.s. Soil Potassium 0.3±0.01 c 0.4±0.03 b 0.4±0.03 a χ² = 24.7*** SLA 15.2±0.3 b 21.4±0.7 a 21.4±0.9 a χ² = 54.2*** LDMC 333.9±5.7 a 252.4±6.3 b 276.0±5.5 b F = 52.4*** CWM trait s Canopy height 32.6±0.5 a 29.3±1.2 b 29.5±1.1 ab F = 5.2**
Re
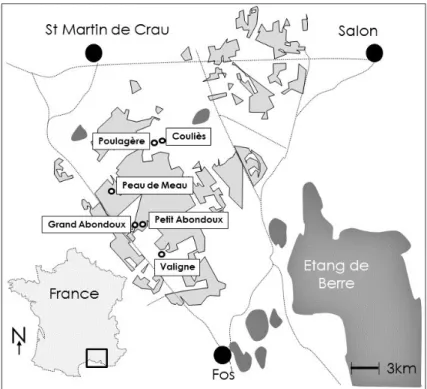
Figure 1. Map of La Crau area in France with the six selected locations. Modified from Sylvain
Fadda, IMBE (In light grey, the area of steppe remnants ). At every location, we chose at least two study sites that represented one undisturbed steppe and at least one fallow land.
or Re
Figure 2. Detrended correspondence analysis (DCA) of all plots. Main matrix: vegetation data (16 sites
with 5 vegetation relevés; 136 species) and second matrix: environmental factors (data on 19 parameters for 16 sites). In total, plots from eight steppe sites (white), five cereal fallows (light grey; rectangle: long-abandoned field (since 1900); triangle: recently-abandoned field (since 2000) and three melon fallows (dark grey) are shown. Vectors were significantly related to the axes (P < 0.05).