Application of Chemical Mass Balance methodology to
identify the different sources responsible for the olfactory
annoyance at a receptor-site.
Kevin Clarke
a, Anne-Claude Romain
b, Nadine Locoge
a, Nathalie Redon
a aEcole des Mines de Douai, Department “Chemistry and Environnement”, 941, rue Charles Bourseul, BP838, 59508 Douai cedex, FRANCE
b
University of Liège, Department “Environmental Sciences and Management”, 185, Avenue de Longwy, 6700 Arlon, BELGIUM
Abstract: The olfactory annoyance perceived at a receptor site of an industrial area is often the result of a combination of different smells, emitted by several industrial sources. The major issue in the case of complaints is to identify the main responsible of such pollution. For this purpose, tools able to determine the contribution of each source directly where the annoyance is perceived would simplify this identification. In this work, we use the source-receptor model CMB (Chemical Mass Balance) generally used for air pollution studies, by applying it for the first time to odour signatures. The contributions of VOC sources, coming from a waste treatment plant containing 3 potential sources of olfactory annoyance (waste storage, production of biogas, and compost piles of green wastes), and perceived at a village located downwind, are studied by chemical analyses and finally compared to olfactometric methods.
1. Introduction and context
While odours are the second cause of complaints from residents after the noise, most studies focus on the identification of compounds (mostly VOCs) constituting the emissions on the site at the origin of these nuisances, and not in the environment. Also the smell that is really perceived at a receptor site is often the result of the contribution of several sources of pollution. It is therefore essential to develop tools that can directly determine in the area where the nuisance is felt, the contribution of the major offending source in order to implement corrective actions at the place where the gases are emitted. Three techniques are widely used to measure odours: the dynamic olfactometry, which is the only European standardized method (EN 13725), the physico-chemical analysis, and finally the electronic nose. These methods have been extensively deployed at the sources where odours are emitted. In contrast, only one study proposes to establish a link between the odour felt and the different sources possibly responsible for this nuisance: it is based on olfactometry identification at the source coupled to an atmospheric dispersion model (Sironi et al., 2009). The source-receptor models use linear combinations of input sources to determine the contribution of these different sources on a receptor site. There are three main models: the CMB (Chemical Mass Balance), the PMF (Positive Matrix Factorization) and the UNMIX. Principles common to all these models are: 1- the assumption of constant source signature from the sources to the receptor, and 2- the optimization of linear combinations of different sources in order to minimize the difference between calculated values and experimental values. PMF and UNMIX are used when the sources are unknown, and CMB when the sources are clearly defined and quantified (Lee et al., 2008). In the case of odours, the sources and the receptor sites are generally distant of a few hundred meters, up to several kilometres, so the reactivity and the washing of the VOCs are negligible. Moreover, identifying signatures of odorous sources is usually trivial. These are the reason why we chose to use the Chemical Mass Balance (CMB) model for this study.
Th Th sit Th wa pro co dy
2.
2.1 Th It the pro sh wh an Fig air Th Ja co the sa re we 20 the me 2.2 To in po he CMB mode his model has tes, and perm he CMB mode as necessary ofiles of sourc ompare the re ynamic olfactoMateriel an
1 Field camp he site of study contains three e green com oduction. Thre hows the confhich correspo nnoyance perc
gure 1: top vie r” and 15 rece he chemical p anuary 2010 to ollected. After e final data se amples: 9 sam producibility in ere also estab 011, 5 sample e seasonality easurements
2 Sampling te o collect as m
the field, sev ossible spectru el is used in m s allowed to i itted to quantif el was never y to conduct ces and secon esults and va ometry, field ol
nd Methods
aigns y is a municip e potential sou posting waste ee villages do figuration of th nds to a non ceived. ew of the was eptor sites. profiles of the o June 2011. a statistical p et for the sour mples for the n the samplin blished during es during autu effect. Simult were performe echniques an uch informatio veral sampling um, were usedmany scientific dentify the m fy precisely th implemented field measure nd, the physico lidate the mo factometry, an al solid waste urces of odou e area, and f ownwind are c he site, the loc n-odorous are ste treatment s e sources we A total of 30 pre-treatment s rces is compo compost, 14 ng procedure. 3 campaigns mn 2011 and aneously to a ed. nd chemical a on about the c g techniques c d. The objectiv c publications major VOCs s he contribution in specific me ement campa o-chemical sig odel prediction nd also by ele e (MSW) treatm ur annoyance, finally an old currently impa cation of the ea, and the pl
site with the 3
ere establishe 0 odorous air
step necessar osed of 8
non-for the waste The chemica from June 20 4 samples du all these physi
analyses met chemical com coupled with ve was to det s, especially fo ources in res n of each sourc easurements aigns to dete gnature of the ns, simultaneo ectronic nose, ment centre lo which are th d waste stora cted by odour three sources laces chosen 3 emission sou ed by collecti samples and ry to filter the -odorous samp , and only 2 al profiles of o 011 to January uring winter 2 cochemical sa thods position const analytical tec termine volatil or the VOC po idential, comm ce in the total of odour nuis rmine first th e nuisance at t ous measurem were conducte ocated in Arlon e storage and ge area rede rs generated b s plus a point for measure
urces plus the
ng data durin 9 non-odorou non-significan ples “zero air”
for the biogas odour annoya y 2012. 5 sam 011, in order ampling, e-no tituting the od hniques, pres e organic com ollution of big mercial or ind content of VO sance. To app he physico-ch the receptor s ments of odo ted. n, southern Be d drying waste eveloped for by the site. Fi noted "ambie ments of the e reference “a ng 18 months us air samples nt chemical p ” and 25 odoro s due to the ance at recept mples during su to take into a ose and olfacto
dour sources s senting the bro mpounds comm
2
cities. dustrial OCs. ply it, it emical site. To urs by elgium. e area, biogas gure 1 ent air" odour mbient s from s were rofiles, ous air lack of tor site ummer ccount ometry studied oadest mon to3
the majority of all sources. For an exhaustive screening of compounds, we chose to use cartridges-type adsorbents Tenax TA ®, as sampling technique, because of their good versatility. As Tenax retains poorly the lightest compounds, we also use canisters to analyze quantitatively the lightest hydrocarbons. To identify and quantify more specifically the carbonyl compounds, we choose to use DNPH cartridges. All of the samples are then returned to the laboratory for analysis. The techniques of physicochemical analysis chosen depend on the type of sampling used in the field and the trapped compounds: Tenax cartridges are analysed with GC-MS, canisters with GC-FID, and DNPH cartridges with HPLC-UV.
2.3 Chemical Mass Balance model
The CMB (Chemical Mass Balance) model is based on the principle of conservation of mass between the source and the receiver site considered. It permits to express the concentration of species i at the receptor site Ci (in µg/m3). Its principal advantage over other sources-receptors models is that it
requires relatively few observations to be reliable. The modeling is done in five steps: 1 - Identification of uncorrelated sources,
2 - Selection of "targets" molecules to be included into the calculation 3 - Knowledge of the compositions of sources
4 - Estimation of the uncertainty associated to both sources and receptors
5 - Evaluation of the performance criteria, which indicates the robustness of the model.
(1) where Ci is the concentration of species i measured at the receptor site in µg/m
3
aij is the mass fraction of species i in the profile of the source j (%)
n is the number of species
Sj is the mass concentration at the receptor site of all species assigned to the source j (µg/m3)
Sj is the contribution of a source at the receptor site, so it is the parameter to be determined through
the application of CMB model. Therefore, the constraint of using such a model is the need to know precisely the emission sources profiles. The number of selected compounds chosen to describe the sources profile must be greater than the number of sources. This defines the degree of freedom of the system: DF = [number of compounds - number of sources].
The robustness of the model is evaluated using three main performance criteria:
1 - %m or percent mass: it is defined as the sum of contributions from the sources divided by the total concentration of VOCs measured. A value approaching 100% is expected with a reasonable range of 80% to 120%.
2 – ² or chi square: it is the sum of the squares of the differences between measured and calculated concentrations divided by the sum of the variances. A high ², beyond 4, means that the uncertainty associated to the sources profiles is not sufficient to explain the difference between measured and calculated concentrations.
3 – R² or correlation coefficient: it measures the quality with which the ambient concentrations measured are due to concentrations calculated from the profiles. A low R² indicates that the profiles of selected sources did not explain the concentrations at the receptor site for the selected species. The value of R² can vary from 0 to 1 but a good model is characterized by a R² greater than 0.8.
3. Results and discussion
3.1 Determination of source profilesThe first step in applying the CMB model is therefore to characterize very precisely the physico-chemical profiles of the three different sources (waste, compost, biogas), with supplemented
p j j ij i a S i n C 1 ,..., 1 ,4
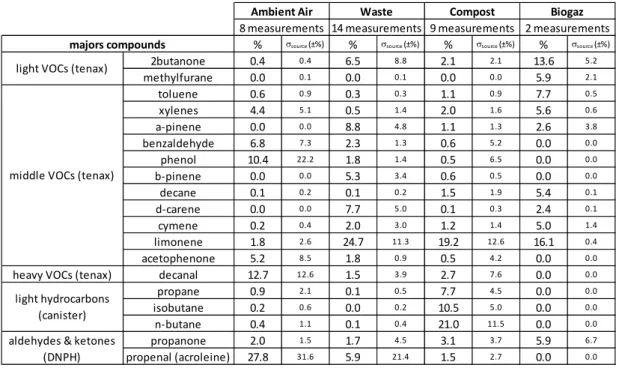
characterization of ambient air collected upwind from the waste treatment site. A list of contributions as a percentage of mass of 60 major compounds could be established, and the results confirm that the 4 sources are not correlated. The degree of freedom is then equal to 56, which is more than enough according to the CMB protocol. Table 2 presents a list of some of the major compounds selected per sources with their average mass fraction in each source and the standard deviation associated to this average. With the results presented in this table 2, the first 3 steps in establishing the CMB model are performed.
The results are consistent with previous studies conducted on the same types of industrial site. For example, the compost source shows a majority of terpenes, followed by some aldehydes and ketones (De Foer et al., 2002). The chemical composition of the waste depends on the maturation and the season, but there is a high presence of aromatic hydrocarbons, including a majority of BTEX, and oxygenated VOCs, mainly aldehydes, ketones, esters, alcohols, dioxolanes, and finally, a minority of aliphatic hydrocarbons and chlorinated compounds. Finally, three independent studies on the physico-chemical characterization of biogas conclude that in addition to methane, carbon dioxide and water vapor, which constitute the bulk of biogas, the major compounds are aromatic hydrocarbons, aliphatic hydrocarbons, and terpenes (Davoli et al., 2003), (Takuwa et al., 2009), (Sadowska et al., 2009).
Table 2: list of the major compounds among the 60 target molecules constituting the sources profiles.
3.2 Robustness tests and choice of the sources/receptors uncertainties
The next step is to determine the best uncertainty to take into account for the sources as well as for the receptors. To achieve this goal, we went through a phase of “all sources in/one source out” testing. The idea is to apply the CMB model to each individual sample of sources as if it was a measurement done at the receptor site. By observing the performances obtained on ranking, and then the success criteria associated with %m, ² and R², it validates the optimal uncertainties to apply on real receptor measurements.
The test is divided into two phases. For the first phase, the uncertainty on the receptor profiles is set to 0.5 times the standard deviation of each family of compounds (light, middle and heavy VOCs, light hydrocarbons, and carbonyl compounds), and we change the uncertainty on the source profiles from
% source (±%) % source (±%) % source (±%) % source (±%)
2butanone 0.4 0.4 6.5 8.8 2.1 2.1 13.6 5.2 methylfurane 0.0 0.1 0.0 0.1 0.0 0.0 5.9 2.1 toluene 0.6 0.9 0.3 0.3 1.1 0.9 7.7 0.5 xylenes 4.4 5.1 0.5 1.4 2.0 1.6 5.6 0.6 a‐pinene 0.0 0.0 8.8 4.8 1.1 1.3 2.6 3.8 benzaldehyde 6.8 7.3 2.3 1.3 0.6 5.2 0.0 0.0 phenol 10.4 22.2 1.8 1.4 0.5 6.5 0.0 0.0 b‐pinene 0.0 0.0 5.3 3.4 0.6 0.5 0.0 0.0 decane 0.1 0.2 0.1 0.2 1.5 1.9 5.4 0.1 d‐carene 0.0 0.0 7.7 5.0 0.1 0.3 2.4 0.1 cymene 0.2 0.4 2.0 3.0 1.2 1.4 5.0 1.4 limonene 1.8 2.6 24.7 11.3 19.2 12.6 16.1 0.4 acetophenone 5.2 8.5 1.8 0.9 0.5 4.2 0.0 0.0 heavy VOCs (tenax) decanal 12.7 12.6 1.5 3.9 2.7 7.6 0.0 0.0 propane 0.9 2.1 0.1 0.5 7.7 4.5 0.0 0.0 isobutane 0.2 0.6 0.0 0.2 10.5 5.0 0.0 0.0 n‐butane 0.4 1.1 0.1 0.4 21.0 11.5 0.0 0.0 propanone 2.0 1.5 1.7 4.5 3.1 3.7 5.9 6.7 propenal (acroleine) 27.8 31.6 5.9 21.4 1.5 2.7 0.0 0.0
Ambient Air Waste Compost Biogaz
8 measurements 14 measurements 9 measurements 2 measurements
majors compounds light VOCs (tenax) middle VOCs (tenax) light hydrocarbons (canister) aldehydes & ketones (DNPH)
5
0.1 to 2 times the standard deviation of each compound. The results combining the best classification with the best performance criteria correspond to an uncertainty of 0.5 times the standard deviation applied to the source profiles. For the second phase, we proceeded in the same way. The uncertainty on the source profiles is set to 0.5 times the standard deviation of each compound, and we change the uncertainty on the receptor profiles from 0.1 to 2 times the standard deviation of each family compounds, plus a detection limit of analytical methods of 0,1 µg/m3. Once again, the results combining the best classification with the best criteria performances correspond to an uncertainty of 0.5 times the standard deviation applied to the receptor profiles.
3.3 Receptor sites results
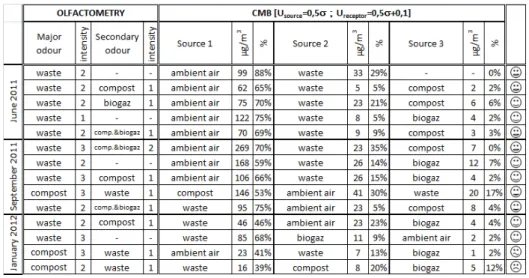
Once the uncertainties in the input / output model of the CMB have been optimized, we applied these choices to the data collected during the field campaigns at the receptor site. 14 samples were taken during three different periods (June, September and January), to account for a possible seasonal effect. To validate the results of the CMB, olfactometry measurements were performed simultaneously to field sampling. The odour felt is associated to an odour intensity described in the german norm “VDI-3882 part 1”: the intensity is rated from 0 to 6, 0 corresponding to an imperceptible odour and 6 to an extremely strong odour. In our case, the odour intensity was rated from 1 to 3, ie: very weak to distinct. The table 6 reports the perceived odour on the 14 receptor sites and the relative contribution of each of the three major sources determined by CMB from physicochemical analysis of the 14 samples measured in the receptor sites.
Table 6: CMB results vs olfactometry on receptor sites
On the whole measurement campaign, odours do not present a very strong intensity. Thus, we noticed that for the vast majority of samples whose odour intensity is included between 0 and 2, the first dominant source designated by the CMB model corresponds to the ambient air. The level 3 seems to be a threshold: in 3 cases out of 5 concerned by an intensity of 3, the CMB points towards ambient air. For the 2 others, it directly gives the dominant source. We can therefore conclude that the first major source of the CMB is a testament to the strength of the odour perceived: for odour intensity clearly greater than 3, the main source may immediately be targeted. Otherwise, for intensities less than or equal to 3, the odour is determined by the second source. Taking into account this classification procedure, ie: firstly classifying the intensity, then detecting the odour, the model is correct in 12 cases out of 14, which can be considered as a very good performance.
6
Conclusions
In this work, we demonstrated the feasibility of applying the sources-receptor model CMB, usually used in the general context of air pollution, to determine the major sources contributions to the odour annoyance perceived at a receptor site. First the model give an indication on the level of intensity olfactory detected, and then it designates the source(s) that prevails.
In a previous work, it has been demonstrated that the electronic nose is able to identify the major odour source in a mixture of complex odorous sampled in the environment, and mixed in a laboratory in accurate proportions. To study the ability of the e-nose to identify the major contributor of an odour annoyance at a receptor site, an approach similar to the ones used during this work could be applied and compared to chemical analyses, but so far, the CMB model applied to data from electronic nose during this three campaigns in the receptor site, have not produced convincing results due to the low degree of freedom between the number of e-nose sensors and the number of sources.
References
Davoli E., Gangai M. L., Morselli L., Tonelli D., 2003, Characterisation of odorants emissions from landfills by SPME and GC/MS, Chemosphere 51(5): 357-368.
Defoer N., De Bo I., Van Langenhove H., Dewulf J., Van Elst T., 2002, Gas chromatography-mass spectrometry as a tool for estimating odour concentrations of biofilter effluents at aerobic composting and rendering plants, Journal of Chromatography A 970(1-2): 259-273. Lee S., Liu W., Wang Y., Russell A. G., Edgerton E. S., 2008, Source apportionment of PM2.5:
Comparing PMF and CMB results for four ambient monitoring sites in the southeastern United States, Atmospheric Environment 42(18): 4126-4137.
Sadowska-Rociek A., Kurdziel M., Szczepaniec-Cieciak E., Riesenmey C., Vaillant H., Batton-Hubert M., Piejko K., 2009, Analysis of odorous compounds at municipal landfill sites." Waste Management & Research 27(10): 966-975.
Sohn J. H., Pioggia G., Craig I. P., Stuetz, R. M., Atzeni M. G., 2009, Identifying major contributing sources to odour annoyance using a non-specific gas sensor array, Biosystems Engineering 102(3): 305-312.
Takuwa Y., Matsumoto T., Oshita K., Takaoka M., Morisawa S., Takeda N., 2009, Characterization of trace constituents in landfill gas and a comparison of sites in Asia, Journal of Material Cycles and Waste Management 11(4): 305-311.