Author: Phan Thi Thuy, Le Duc Niem and Philippe
Lebailly
I. Introduction
Dak Lak province as a diverse region is well-suitable for development of various crops.
Dak Lak economy depends heavily on the agricultural sector, in which perennial crops as premier crops of economic growth.
Dak Lak’s perennial crop production has many difficulties due to a lot of reasons.
Meanwhile, intervention policy on agriculture often considers
criteria as landmark, population redistribution, forest and market conditions.
This study especially focuses on the consequences of policies
including: land, forest, migration and trade in production of long – term crops in Dak Lak province.
One of the provinces in the Central
Highlands region with many different
types of plants, large area and thinly
populated region, two separate seasons
>>capital permanent crops region. Over
1,303 billion ha of total natural land,
over 387 thousand ha of perennial crops
area (29.7%) GO, 2017) and 1.15 billion
labor staff.
II. Methodology
• Secondary data
was gathered from different local
government offices and published papers, previous
reports.
• Primary data:
Focus Group Discussion (FGD) with 5-7
participants and Key Informant’s Interviews (KIs)
including Head of Department of Agricultural and
Rural Development, Head of Planting Department,
elderly people, experts and policy makers.
III. Results and discussion
3.1. The overview of perennial crops situation in Dak Lak province
Year
Area ( thousand hectares) Output (thousand tones)
Coffee Rubber Pepper Coffee Rubber Pepper
1975 11.5 4.5 - 8.8 2.3 -1985 21.8 10.9 0.79 21.8 6.1 0.48 1990 69.6 14 0.82 28.5 2 0.5 1995 131 19 1 154.5 4.5 1 1999 250 26 5 295.6 9.5 2.6 2001 180 22 6 455 14.3 6 2002 167 23 8 413 16.3 10
Source: NGUYEN D. T, 2016 and GO, 2002
0 100000 200000 300000 400000 500000 600000 0 50000 100000 150000 200000 250000 300000 2005 2010 2011 2012 2013 2014 2015 2016 Ton Ha Area Production 0 0,5 1 1,5 2 2,5 3 3,5 2005 2010 2011 2012 2013 2014 2015 2016 Y iel d (T on/ ha) Coffee Rubber Pepper Cashew 0 50 100 150 200 250 300 350 400 2005 2010 2011 2012 2013 2014 2015 2016 222 Th o u san d to n e s Year Export volume
Source: Dak Lak of Year book, 2006-2017
Policies develop perennial crops
Land policy1
Forest policy2
Migration policy3
Trade policy4
Time Name and content of policies
1981 Directive No 100/CT-TW 13/1/1981: to reallocate land to
individual and households
1988 Resolution 10/ NQ-TW 4/5/1988: “recognition of land for
households as a main unit production
2013 Decision No 2729/QĐ –UBND Dak Lak 25/12/2013 “Planning
development majority perennial crops and fruits to 2020”
2014 Decision 1442/QD- BNN-TT 27/06/2014 “ Master Planning
Development of pepper to 2020 and vision 2030”
2016 Decision No 2325/QĐ-UBND Dak Lak 10/8/2016 “Agricultural
restructuring towards raising added values and sustainable development to 2020 and vision 2030”
2016 Decision 214/QĐ-UBND 18/01/2016 “Replanting old coffee tree
programs during 2013-2020”
Table 2: Policies on land allocation of perennial crop productions
0 100 200 300 400 500 600 700 1990 1995 2000 2005 2010 2016 126 145 206 276 216 240 90 165 302 238 314 387 T housand H a
Perennial crops area annual crop area
Figure 2: Change of annual and perennial crops land in Dak Lak province (1990-2016)
Source: Dak Lak of Yearbook 2000, 2005, 2017
The perennial crops area
climbed dramatically during period due to much more lucrative than annual crops.
The agricultural area increases slightly year by year, especially from 1990-2016
Ha (thousand)
Figure 3: The development of area of main perennial crops
(1985-2016)
Source: (Duong, 2016) and (Yearbook of Dak Lak, 2014- 2016)
0 50 100 150 200 250 300 1985 1990 1995 2001 2005 2010 2015 2016 21,8 69,6 131 180 167 179 204 204 41 39 22 28 Pepper Rubber Coffee
Traditional method, small scale, over 85% area owned by households
Rapid expansion in spite of local authority’s
260 260 600 712 540 560 580 600 620 640 660 680 700 720 740 0 50 100 150 200 250 300 2020 2030 Area Yieldig Figure 4:
The Master Planning for development of perennial crops (2020 to 2030)
Source: DARD, 2017 Ha (th ous and s) T on (thou san d)
The producers have incentive to intensify cash
production.
To create a fragmentation due to diving land
on principle of average size and area.
Has no motivated farmers to use effectively
land due to without receiving money when
land allocation.
Feeling as allocation of property of state for
individuals rather than delivery of materials
The limitation in management lead to
spontaneous expansion of area.
Forestry policy
• From 1980 to 1998, due to rapid expansion of land for agriculture,
forest coverage decreased from about 90% in the 1960s to 57% in
1995 and to less than 50% in the late 1990s.
• In the beginning of the 1990s, an attractive market signals
encouraged the province to exploit greatly more “barren land” for
perennial crops.
Figure 5: The relationship between coffee and forest area
800 600 400 200 Ha (thou sa n d s) 1975 1984 1995 2000 2001
0 50000 100000 150000 200000 250000 300000 350000 2009 2010 2011 2012 2013 2014 2015 2016 2017 Ha
Protective Forest Specially Used Forest Productive Forest
Figure 7: The area of forested land by use purpose (2010-2016)
Time Name and content of policies
1992 Progame 327 CT, 15/9/1992 «Regreening of Barren Hills» 1998 Decision 661/QĐ-TTg 29/7/ 1998 “Five million hectares
reforestation program aimed to reforest area in exchange for certain user rights”
2005 Decision No. 304/2005/QD-TTg 23 /11/2005 “Pilot forest allocation to households and communities in local ethnic minority villages in Central Highlands”
2006 ND 23/2006/ND-CP “Permission exchange poor forest to plant perennial crops”
2007 Decree 76/2007/TB-BNN “ Guide to transformation of forestry and forest land to rubber planting in Central Highlands”
2016 Meeting in Buon Ma Thuot 20/06/2016 “ Closing natural forest gate, without transferring over 2,253 hectares natural forest area to other purposes except those related to special defense and security. Government does not undertake to shift poor forest to annual and perennial crops” by Prime Minister
Under central planned economy, forest area was owned by farm
states.
Forest land was allocated for households and individuals. They
became a driving force to contribute protection and stabilizing of
ecological environment.
High profitability from perennial crops encouraged farmers, leading to
rapid decreasing of forest while the rights on forest assets has not yet
been clearly with stakeholders.
Forest policies was pressured by economic development.
The process of applying of policies was revealed many shortages.
Understanding
and
application
are
differences
between
Labor Policy
Figure 8: Population and ethnicity in Dak Lak 1976–2001
1976 1980 1981 1984 1994
1999 2001
Kinh people dominated
ethnic
group
since
establishment
of
the
NEZs in 1970s.
Planned and spontaneous
migration were changed
the population structure of
Dak Lak.
Time Name and content of policies
1976-1986
IV National Congress of the Communist Party, 1976 “ Population redistribution and establishing New Economic Zones”
1990 Decision No 1a6/HDBT, 9/4/1990 “ Management of population redistribution and building of New Economic Zones”
2004 Direction No 190/2003/TTg “Solving the spontaneous in-migration to Central Highlands
2004 Decision 134/2004/TTg for “Resettlement for migrants, providing homestead and production land”
2012 1776/QD-TTG dated 21/11/2012 “ Redistribution of population in disasters, difficulties regions to 2015 and vision 2020”
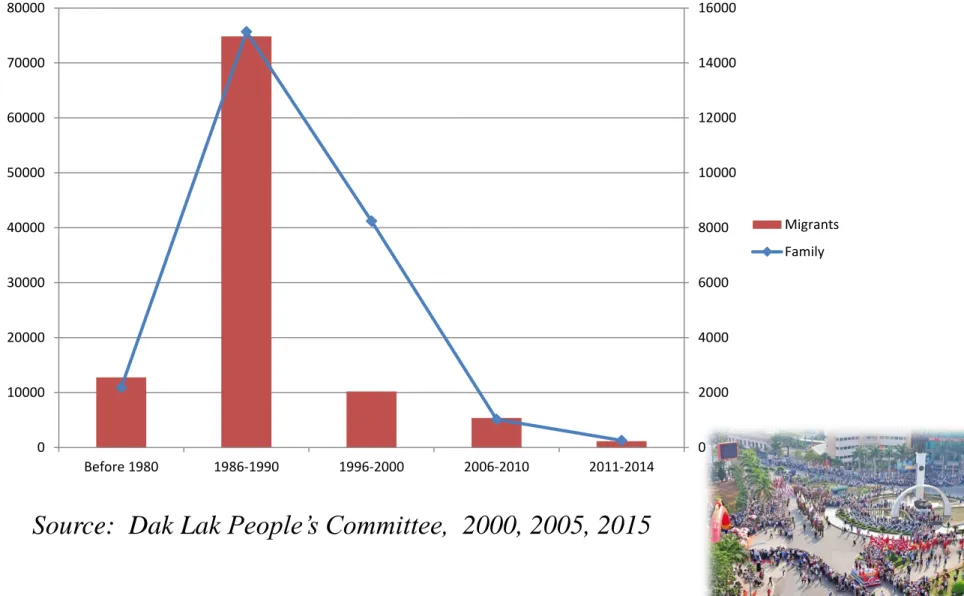
Figure 9: The spontaneous migration of Dak Lak province
Source: Dak Lak People’s Committee, 2000, 2005, 2015
0 2000 4000 6000 8000 10000 12000 14000 16000 0 10000 20000 30000 40000 50000 60000 70000 80000 Before 1980 1986-1990 1996-2000 2006-2010 2011-2014 Migrants Family
0 0,2 0,4 0,6 0,8 1 1,2 1,4 2005 2010 2011 2013 2014 2015 2016 B ill io n pe o ple
Urban labor Rural labor
Figure 10. The labor force in Dak Lak province (2005-2016)
This issue pressurize to management citizen, resettlement, shifting poor forestry to cultivation
in spite of local authority’s warning The unplanned migration is continuing
and creating negative impacts.
The profuse employees for agricultural production will increase in the future.
Figure 11: The export price of perennial crops during 1991-2016
Source: VICOFA, VFA, VRA, 2016
Dependency of fluctuations in export prices
0 1000 2000 3000 4000 5000 6000 7000 8000 9000 1991 1995 2000 2005 2010 2011 2012 2013 2014 2015 2016 Coffee Rubber Pepper Cashew
Figure 12: The export turnover, 2005-2015
0 100 200 300 400 500 600 2005 2010 2013 2014 2015 249 504 492 481 396 M ill io n US D Coffee 0 10 20 30 40 2005 2010 2013 2014 2015 8,2 24,6 33,1 35,3 28,1 M ill ion U SD Pepper 0 5 10 15 20 25 30 35 40 45 2005 2010 2013 2014 2015 11,9 43,1 17,6 13,8 7,9 M ill io n US D Rubber 0 1 2 3 4 5 6 2005 2010 2013 2014 2015 5,5 2,8 3,9 5,6 4,5 M ill io n US D CashewTime Name and content of policies
2002 Decision No 80/2002/QĐ-TTg, dated 24/6/2002 “Encouraging
policy consumes commodities through contracts”
2005 Decision No 986/QD-SHTT D dated 14/10/2005 of the Intellectual
Property Department register The Geographical indication – Buon Ma Thuot coffee.
2010 Decision No 3848/QD-BCT, dated 20/7/2010 “Providing market
information to support commodities selling”
2006 Decision No 2278/QD-UBND on 04/12/2006 for “Establishing
Coffee Exchange Center”
2013 Decree 210/ND-CP , dated “Reducing expenses: advertising on
media; participating domestic exhibition; accessing market information”
2015 Decision No 1684/ QD-TTg, 30/9/2015 “Strategy of economic
integration for agricultural sector and rural development vision 2030”.
• Export commodities are still raw materials. Value added
is low, economic efficiency is not high.
• Huge expansion lead to decreasing of export price due to
the supply is higher than demand.
Conclusion
The perennial crops system was gradually increased by area, yield and output value.
1
The spontaneous migration, reclaiming wasteland and cutting down forest land as well scanty output market.
2
The producer faced small scale, large old tree, fluctuation of natural conditions, imperfect market , lack of labor in harvesting season
3
Converting forest land to perennial crops to lead the high reforestation.