Water vapor line parameters:
Some feedback from atmospheric users
S. Fally
Université Libre de Bruxelles, Faculté des Sciences,
Service de Chimie Quantique et Photophysique, Brussels, BELGIUM A. C. Vandaele
Institut d’Aéronomie Spatiale de Belgique, Brussels, BELGIUM S. Trabelsi, E. Mahieu, P. Demoulin
Université de Liège, Institute of Astrophysics and Geophysics, Groupe Infrarouge de Physique Atmosphérique et Solaire, Liège, BELGIUM
C. Frankenberg
Netherlands Institute for Space Research, Utrecht, THE NETHERLANDS H. Vogelmann, T. Trickl
Institut für Meteorologie und Klimaforschung , Atmosphärische Umweltforschung (IMK-IFU), Forschungszentrum Karlsruhe, Garmisch-Partenkirchen, GERMANY
Despite recent major improvements of water vapour (wv) databases, the insufficient quality or consistency of the H2O
spectroscopic parameters has been reported many times and line parameters are often manually adjusted to minimize residuals and improve the quality of the fits. Atmospheric observations allow assessing the quality of databases through their simulation using the different line parameters reported in those databases.
This work presents four concrete examples of the spectroscopic problems and proposed improvements in various spectral regions. 1. Ground-based H2O retrievals by
Fourier transform infrared (FTIR) spectroscopy at the high altitude research station Jungfraujoch, Swiss Alps
In order to maximize the information content in the largest altitude range, several micro-windows encompassing strong and weak lines (figure 1) are often fitted simultaneously. But to find the best combinations among numerous possibilities in the 700-4300 cm-1 range is not trivial. A lot of micro-windows have been investigated
but preliminary results show that the quality of the multi-micro-window fits is poor, in particular poorer than single micro-window fits (see details in [1]). To lower residuals, it is necessary to modify HITRAN lines parameters, which point to inconsistencies of spectroscopic parameters between different spectral regions. Tuned line parameters have to be adopted until improved and more consistent parameters are made available.
2. Ground-based H2O retrievals from
differential-absorption lidar (DIAL) at Zugspitze, Germany
A high-power DIAL is installed at the Schneefernerhaus high altitude research station (Zugspitze) in order to measure the vertical distribution of wv in the troposphere (3-12 km) with high spatial and temporal resolutions. The system comprises a unique widely tunable narrow-band laser system, whose technical details are described in [3]. A careful choice of 3 lines in the spectral region around 12240 cm-1 (817nm) has been made [3], but one question arises: which dataset among literature data [4-11] is the best? Comparison of line strengths for some
lines highlights substantial differences between the different databases among which HITRAN [4-5] and Ponsardin and Browell [6]. These large inconsistencies could be linked to the measurement technique. This was further investigated by simulating a laboratory spectrum recorded by Fourier transform spectroscopy using different datasets (figure 2). This figure confirms inconsistencies between databases, and it shows moreover that the strongest line simulates worse than the two weaker ones, meaning that inconsistencies also exist within a given database.
3. Impact of H2O on CH4 retrievals from
nadir spectra recorded by SCIAMACHY onboard ENVISAT
The study of the impact of wv spectroscopy on CH4 retrievals was initiated because of an
unresolved seasonal bias in the southern hemisphere. A change in wv spectroscopic parameters not only largely eliminated this bias but also had a substantial impact in tropical regions. The results of this study are published in [12], and will be briefly summarized here. Methane is retrieved in a near-IR micro-window (5990-6130 cm-1). Retrievals from two ground-based solar absorption FTIR spectra (Paramaribo, Suriname; Bremen, Germany) are first performed. Figure 3 clearly show systematic residuals of up to 6% at Paramaribo using HITRAN [4-5], which mostly vanish using a modified Brussels-Reims (BR) list [13]. Very strong residuals occur for few strong transitions using the BR list due to unallocated or very low broadening parameters, and a modified BR list is proposed consequently. Overall, systematic errors are substantially reduced using the BR list as compared to HITRAN. Then, the impact of wv on SCIAMACHY CH4
retrievals is evaluated. In Figure 4, a positive correlation and no correlation of retrieved methane with wv abundances are obtained using HITRAN and the BR list respectively. This leads to a systematic overestimation by about 60 ppb of tropical methane abundances (Figure 5) and of
tropical emissions estimates which are reduced from 260 to ~201 TgCH4 /yr [12].
4. Spectroscopic needs for H2O retrievals
from SOIR onboard VENUS EXPRESS New simultaneous H2O and HDO
measurements are necessary to answer the key questions about Venus, among which “why Venus and Earth evolved so differently in spite of their similarities in terms of size, mass, density, volume and distance to the Sun?”, and “which scenario can explain the very high atmospheric isotopic ratio D/H (150 x terrestrial)?” SOIR performs solar occultations in the 2250-4360cm-1 infrared region (Figure 6) allowing H2O and HDO retrievals between
70-110 and 70-95 km respectively [14-16]. Spectral fits (Figure 7) show broader simulated lines which could be due to incorrect CO2 broadened widths CO2 for wv.
In the absence of CO2 measurements or
calculation in the covered region, a scaling factor to convert air to CO2 broadening was
applied [16]. However accurate values of CO2 would be very useful to reduce
uncertainties. Conclusions
Specific spectroscopic problems in the regions 700-4300 and around 12300 cm-1 have been described for water vapor. Systematic errors in methane retrievals due to inaccuracies in water vapor spectroscopic parameters were presented in the 5990-6130 cm-1 range. Ad-hoc improvements to databases are proposed in some cases, in particular for the 700-4300 and 5990-6130 cm-1 regions. Finally, specific needs of CO2
broadened widths in the 2250-4360 cm-1 region for the study of the Venus atmosphere have been mentioned. More generally, this work demonstrates the importance of high quality laboratory work both for wv retrieval itself and for interfering species, and of collaborations between the spectroscopy and the remote-sensing community through inter-comparisons, cross-validations, and various synergies.
Figure 1: Matrix of the contribution functions for O3 profile inversion. From [2].
Figure 2: Comparison between measured FTS spectrum (blacks dots) and simulated spectra with different datasets (colored lines). 0.008 0.010 0.012 0.014 0.016 0.018 0.020 12236.5 12237.5 12238.0 12238.5 -0.0010 -0.0005 0.0000 0.0005 0.0010 In tensit y (arb. unit s )
FTIR spe (600m, 0.4 torr, 291K) Flaud97 Hitran06 Ponsardin97 Tolchenov02 Tolchenov08 Wavenumber (cm-1) obs -calc
Figure 3 (below): Spectral fit of a Paramaribo spectrum (top), corresponding residual (middle), and residual of a fit using a Bremen spectrum (bottom). Colors are contributions from individual gases. The methane 23 Q branch (5998-6006 cm-1) to
which SCIAMACHY is most sensitive is shown in more detail. From [12].
Figure 4: Frequency distribution of the ratio of SCIAMACHY methane retrievals and TM5 model columns over the Sahara in 2004 as a function of water column, using the HITRAN database (top) and a modified version of the BR database [13](bottom). From [12].
Figure 5: Difference of SCIAMACHY column averaged mixing ratios of CH4 using
HITRAN and the modified BR list (HITRAN-BR). From [12].
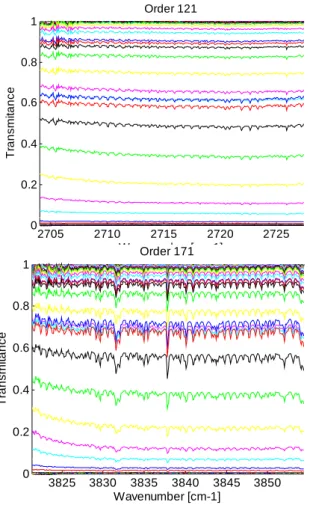
Acknowledgments 2705 2710 2715 2720 2725 0 0.2 0.4 0.6 0.8 1 Order 121 Wavenumber [cm-1] Tr ans m it a nce 3825 3830 3835 3840 3845 3850 0 0.2 0.4 0.6 0.8 1 Order 171 Wavenumber [cm-1] Tr ansm it ance
Support from the Belgian Federal Science Office (SSD & ESA-Prodex programmes), the National Fund for Scientific Research (FRFC program), the European Space Agency, and the Communauté française de Belgique (Actions de Recherche Concertées) is acknowledged.
References
1. Demoulin et al., this issue 2. Barret, PhD thesis, 2003
3. Vogelmann & Trickl, Appl. Optics, 47, 2116-2132, 2008
4. Rothman et al., HITRAN2004, JQSRT, 96, 139-204 2005
5. Gordon et al., HITRANupdate2006, JQSRT, 108, 389-402, 2007
6. Ponsardin & Browell, JMS, 185, 58-70, 1997 7. Flaud et al., JMS, 183, 300-309; 185, 211-221, 1997 8. Mérienne et al., JQSRT, 89, 99-118, 2003 9. Schermaul et al., JMS, 208, 32-50, 2001 10. Tolchenov et al., JMS, 215, 269-274, 2002; JMS, 221, 99-105, 2003; JQSRT, 109, 559-568, 2008
Figure 6: Evolution of one occultation at sunset Aug. 20th 2007: Transmittance spectra in specific ranges of HDO (top) and H2O (bottom) absorptions. From [16].
11. Mazzotti et al., JMS, 239, 174-181, 2006 12. Frankenberg et al., GRL, 35, L15811,
2008 Figure 7: Examples of best data fitting for
HDO (top) and H2O (bottom) at 86-89 km 13. Jenouvrier et al., JQSRT, 105, 326-355,
2007 on July 27, 2007. The boxes relate to the
chosen ranges for the retrievals. From [14]. 14. Fedorova et al., JGR, in press 2008 15. Vandaele et al., this issue
![Figure 1: Matrix of the contribution functions for O 3 profile inversion. From [2].](https://thumb-eu.123doks.com/thumbv2/123doknet/5474036.130014/3.892.470.764.104.494/figure-matrix-contribution-functions-o-profile-inversion.webp)