European Journal of Plant Pathology 105: 559–569, 1999. © 1999 Kluwer Academic Publishers. Printed in the Netherlands.
Virulence variation and RAPD polymorphism in African isolates of
Phaeoisariospis griseola (Sacc.) Ferr., the causal agent of angular leaf spot of
common bean
J.P. Busogoro, M.H. Jijakli and P. Lepoivre∗
Facult´e Universitaire des Sciences Agronomiques de Gembloux, Unit´e de Phytopathologie, 2, Passage des D´eport´es, 5030 Gembloux, Belgium;∗Author for correspondence (Fax:+32-81 61 01 26)
Accepted 1 June 1999
Key words: genetic variability, virulence
Abstract
Fifty four isolates of Phaeoisariopsis griseola, the agent of common bean angular leaf spot disease from the Great Lakes Region of Africa, were characterised according to their virulence behaviour and their molecular patterns. Virulence properties were revealed through the inoculation of 29 genotypes of Phaseolus vulgaris, Phaseolus coccineus and Phaseolus polyanthus. Differences in reaction types revealed high variability among these isolates. Most of them, even when collected within the same location, showed differences in their respective reactions on many plant genotypes. For molecular typing, RAPD amplifications were performed for each isolate using five random primers. Isolates with different patterns were collected within one region. Simultaneously, similar molecular patterns were found in isolates collected at different sites. However, the average of molecular similarity, based on the percentages of shared bands for each isolates pair, was higher among isolates collected within one site. No direct correlation between molecular pattern and pathotype was observed.
Abbreviations: ALS – angular leaf spot; RAPD – randomly amplified polymorphic DNA; RT – reaction type.
Introduction
The angular leaf spot (ALS) disease of common bean (Phaseolus vulgaris L.) caused by Phaeoisariopsis griseola (Sacc.) Ferr. (Isariopsis griseola Sacc.) is found in more than 60 countries world-wide (Guzm´an et al., 1995) and results in yield losses up to 80% (Schwartz et al., 1981). Thus, breeding for disease resistance to ALS represents a priority for several national bean breeding programs especially in the African Great Lakes Region where subsistence agri-culture prevails. Adaptation of pathogen populations to overcome host resistance represents the main drawback of this strategy. Understanding the genetic structure and the virulence pattern of pathogen populations rep-resents a prerequisite to the development of a ratio-nal strategy of resistance gene deployment. This goal
can be pursued by two distinct approaches. Comparing the increasing availability of genetic markers, such as isozymes and molecular markers, to virulence data allows the analysis of how pathogenic variability is gen-erated and maintained (Leung et al., 1993; Milgroom, 1997). Variability within P. griseola revealed by isoen-zymatic analysis (Boshoff et al., 1996) and RAPD patterns (Guzm´an et al., 1995; Chac´on et al., 1997) has already been reported. Phylogeny inferred from RAPD and isozyme markers divided P. griseola iso-lates into two major groups, the first one (Andean) being generally recovered from Andean gene pool materials whereas the second (Mesoamerican) was recovered from the Mesoamerican gene pool. Forty-one of the 44 isolates originating from Malawi were related to the Andean group (Guzm´an et al., 1995).
A traditional pathogen race survey, based on the differential reactions of cultivars to inoculation, gen-erates detailed pictures of the virulence structure and represents the second strategy of analysis. This kind of analysis only reveals pathogen properties related to the host selection effect on the pathogen populations (Kolmer et al., 1995) but remains the ultimate reference of virulence analysis.
Some evidence of pathogenic variability in P. grise-ola has been described based on pathogenicity on dif-ferential bean cultivars (Alvarez-Ayala and Schwartz, 1979). Similar variability was also suggested by field trials in Africa (Aggarwal et al., 1996) and India (Srivastava et al., 1995). Moreover pathogenic behaviour of a few randomly chosen P. griseola isolates collected by Guzm´an et al. (1995) showed association between pathogenicity and molecular phylogeny sug-gesting coevolution of P. griseola with common bean. Similar works have been done with Colletotrichum lindemuthianum populations, the agent of common bean anthracnose. In Latin America, molecular and vir-ulence analyses of C. lindemuthianum showed the exis-tence of two major groups of strains (Gonz´alez et al., 1998). Data obtained by Sicard et al. (1997) for the same pathogen revealed an adaptation of strains on cul-tivars of the same geographic origin. This knowledge may be very useful for any program breeding for resis-tance against bean anthracnose.
The importance of P. griseola pathogen diversity prevailing in the African Great Lakes Region remains poorly known. The objective of our study was to anal-yse P. griseola isolates originating from that region in order to understand how ALS disease management by genetic resistance within this specific region may be performed. Pathogen diversity was determined in terms of races or pathotypes as defined by inoculation of different plant genotypes and in terms of molecular patterns using the RAPD technique after which, a com-parison between the virulence and molecular diversity was performed. This is the first large-scale analysis of Central African P. griseola isolates collected from dif-ferent areas within a region where cultivars are culti-vated in variable mixtures.
Materials and methods
Collection of fungal isolates
A collection of 54 isolates of P. griseola was obtained from naturally-infected bean leaves. Forty-four isolates
originated from countries of the Great Lakes Region of Africa (Burundi, Rwanda, Za¨ıre and Kenya), while 10 isolates were collected in Brazil and Colombia (Table 1). Isolates were maintained on V8 juice agar medium (per litre: 200 ml V8, 3 g CaCO3and 18 g agar) and kept in the dark at ±20◦C. Colonies descended from a single spore were conserved in a cold room (4◦C) for inoculation of different plant genotypes and molecular analyses.
Differential plant genotypes
A set of twenty-nine plant genotypes was used for the inoculation with P. griseola (Table 2). The set con-sists of 17 genotypes of P. vulgaris (including 8 dif-ferential varieties sent us by CIAT), 6 accessions of P. coccineus and 6 accessions of P. polyanthus received from the Tropical Crop Husbandry Unit of the Agri-cultural University of Gembloux. All these genotypes, except two accessions of P. coccineus (NI1108 and NI819) are current cultivars.
Inoculation of plant genotypes and scoring of symptoms
Each isolate was multiplied from a conserved sample by culturing on V8 juice agar medium. Conidia were harvested from 12-day-old cultures, suspended in dis-tilled water and adjusted at a concentration of 2× 10⁴ conidia per ml. The first trifoliate leaves were inocu-lated by spraying the inoculum to run off under a pres-sure of 2.8 kg/cm2 until saturation. In order to control the reproducibility of symptom development, a suscep-tible reference (variety Aroana inoculated by the isolate KGM1) was included in each inoculation series.
Inoculated plants (3 for each isolate × genotype combination) were incubated for 4 days in a humid chamber (RH of 95%) with a 16 h light photoperiod. Plants were maintained in a greenhouse (25◦C) for another 12 days and evaluated for symptoms according to the visual scale defined by Schoonhoven and Pastor-Corrales (1992). Values reflecting the percentage of infected leaf area ranged from 1 (no visible lesion) to 9 (more than 25% of the leaf area covered by lesions). Reaction type categories were determined according to the averages of these symptom scores attributed for each plant pathogen combination.
Table 1. List of Phaeoisariopsis griseola isolates
Number Isolate Origin Country Location Collection date Sent by
1 KGM1 Burundi Muhingira January 1994 ISABU1
2 KGM2 Burundi Muhingira January 1994 ISABU1
3 KGM3 Burundi Muhingira January 1994 ISABU1
4 KGM4 Burundi Muhingira January 1994 ISABU1
5 KGM5 Burundi Muhingira January 1994 ISABU1
6 KGM6 Burundi Muhingira January 1994 ISABU1
7 KGM7 Burundi Muhingira January 1994 ISABU1
8 KGM8 Burundi Muhingira January 1994 ISABU1
9 KGR1 Burundi Rubagabaga January 1994 ISABU1
10 KGR2 Burundi Rubagabaga January 1994 ISABU1
11 KGR3 Burundi Rubagabaga January 1994 ISABU1
12 KGR4 Burundi Rubagabaga January 1994 ISABU1
13 KGR5 Burundi Rubagabaga January 1994 ISABU1
14 KGR6 Burundi Rubagabaga January 1994 ISABU1
15 NMM1 Burundi Murama January 1994 ISABU1
16 NMM2 Burundi Murama January 1994 ISABU1
17 NMM3 Burundi Murama January 1994 ISABU1
18 KF1 Kenya Unknown April 1994 University of Nairobi
19 FK4 Kenya Unknown April 1994 University of Nairobi
20 KK1 Burundi Kabuye July 1994 ISABU1
21 KK2 Burundi Kabuye July 1994 ISABU1
22 KK3 Burundi Kabuye July 1994 ISABU1
23 KK4 Burundi Kabuye July 1994 ISABU1
24 KK5 Burundi Kabuye July 1994 ISABU1
25 KK6 Burundi Kabuye July 1994 ISABU1
26 RN1 Colombia Rio Negro February 1994 CIAT2
27 RN2 Colombia Rio Negro February 1994 CIAT2
28 RN4 Colombia Rio Negro February 1994 CIAT2
29 RN8 Colombia Rio Negro February 1994 CIAT2
30 RN10 Colombia Rio Negro February 1994 CIAT2
31 BR1 Brazil Goi´as December 1995 EMBRAPA3
32 BR2 Brazil Cear´a December 1995 EMBRAPA3
33 BR3 Brazil Minas Gerais December 1995 EMBRAPA3
34 BR4 Brazil Esp´ırito Santo December 1995 EMBRAPA3
35 BR5 Brazil Pernambuco December 1995 EMBRAPA3
36 RDA1 Rwanda Unknown April 1996 University of Rwanda
37 RDA2 Rwanda Unknown April 1996 University of Rwanda
38 RDA3 Rwanda Unknown April 1996 University of Rwanda
39 RDA6 Rwanda Unknown April 1996 University of Rwanda
40 RDA7 Rwanda Unknown April 1996 University of Rwanda
41 BGA2 Burundi Gitega April 1996 University of Burundi
42 BGA4 Burundi Gitega April 1996 University of Burundi
43 BGA5 Burundi Gitega April 1996 University of Burundi
44 ZA1 Za¨ıre Unknown May 1996 University Kinshasa
45 ZA2 Za¨ıre Unknown May 1996 University Kinshasa
46 ZA3 Za¨ıre Unknown May 1996 University Kinshasa
47 ZA4 Za¨ıre Unknown May 1996 University Kinshasa
48 ZA5 Za¨ıre Unknown May 1996 University Kinshasa
49 ZA6 Za¨ıre Unknown May 1996 University Kinshasa
50 ZA7 Za¨ıre Unknown May 1996 University Kinshasa
51 ZA8 Za¨ıre Unknown May 1996 University Kinshasa
52 ZA9 Za¨ıre Unknown May 1996 University Kinshasa
53 ZA10 Za¨ıre Unknown May 1996 University Kinshasa
54 ZA11 Za¨ıre Unknown May 1996 University Kinshasa
1ISABU: Institut des Sciences Agronomiques du Burundi. 2CIAT: Centro Internacional de Agricultura Tropical. 3EMBRAPA: Empresa Brasileira de Pesquisa Agropecuaria.
Table 2. List of genotypes of Phaseolus vulgaris, Phaseolus coccineus and Phaseolus polyanthus
Genotype Species Origin
BAT76 P. vulgaris ISABU1
CALIMA P. vulgaris ISABU
AROANA P. vulgaris ISABU
A340 P. vulgaris ISABU
A345 P. vulgaris ISABU
A285 P. vulgaris ISABU
A410 P. vulgaris ISABU
A140 P. vulgaris ISABU
PRELUDE P. vulgaris Used in Belgium
BAT1647 P. vulgaris∗ CIAT2
SEAFARER P. vulgaris∗ CIAT
CORNELL49242 P. vulgaris∗ CIAT
MONTCALM P. vulgaris∗ CIAT
A339 P. vulgaris∗ CIAT
G5686 P. vulgaris∗ CIAT
BAT332 P. vulgaris∗ CIAT
POMPADOUR CHECA P. vulgaris∗ CIAT
NI15 P. coccineus Rwanda
NI16 P. coccineus Rwanda
NI1108 P. coccineus Mexico3
NI819 P. coccineus Mexico3
NI229 P. coccineus Za¨ıre
NI666 P. coccineus Puerto Rico
NI429 P. polyanthus Costa Rica
NI519 P. polyanthus Mexico
NI1208 P. polyanthus Colombia
NI1010 P. polyanthus Colombia
NI1011 P. polyanthus Colombia
NI373 P. polyanthus Venezuela
1ISABU: Institut des Sciences Agronomiques du Burundi. 2CIAT: Centro Internacional de Agricultura Tropical. 3Wild genotypes.
∗Varieties sent by CIAT are differentials identified by Correa
(1988).
DNA extraction
Erlenmeyer flasks (500 ml) containing 250–300 ml of liquid medium (per liter: 10 g glucose, 5 g yeast extract, 4 g KH2PO4, 0.9 g K2HPO4, 1 g NH4Cl, 0.25 g MgSO4· 7H2O and pH about 5.3) (W¨ostemeyer, 1985) were inoculated with 10–15 agar disks of 1 cm in diameter. The cultures were placed on a rotary shaker (115 rpm) and incubated at±20◦C with a 16 h light photoperiod for 12 days. Mycelia were harvested by filtration through cheesecloth. Samples were frozen in liquid nitrogen and ground to a fine powder with a mor-tar and pestle. DNA extraction was performed accord-ing to the CTAB procedure usaccord-ing TE buffer for final dilution of the samples (Doyle and Doyle, 1990).
RAPD analysis
RAPD reactions were carried out with 10-base oligonucleotide primers (OPK7: AGCGAGCAAG, OPK9: CCCTACCGAC, OPK10: GTGCAACGTG, OPL17: AGCCTGAGCC and OPL18: ACCACC-CACC) (Operon Technologies, USA). PCR reactions were performed in a 50 µl final volume containing 5 µl of the PCR reaction buffer 10× conc. (Boehringer Mannheim), 0.4 µm oligonucleotide primer, 4 mM MgCl2, 200 µm of each dNTP, 50 ng of genomic DNA from P. griseola and 1 unit of Taq polymerase (Boehringer Mannheim). Amplification conditions consisted of an initial step of DNA denaturation of 3 min at 94◦C followed by 45 cycles of 1 min at 94◦C, 1 min at 35◦C and 2 min at 72◦C and a final step of 10 min at 72◦C in a thermocycler (Biometra TRIO-Thermoblock). Amplification products were separated by electrophoresis in a 1.5% agarose gel and observed under UV light after gel staining with ethidium bromide.
DATA analysis
Symptom intensity was used to determine the reaction type (RT): resistance(R = symptom score ≤3), partial resistance (PR = symptom score >3–6) and suscep-tibility (S= symptom score >6–9). These RTs were introduced into a matrix and analysed by hierarchical cluster analysis using the average linkage method with the statistical program SYSTAT. Distances between isolates were calculated as the percentage of genotypes on which RTs were not similar for the considered iso-lates. The results were included in a dendrogram rep-resenting distances between isolates. Assuming that all plant genotypes contain different resistance genes, pathogen complexity was evaluated for each isolate by the number of susceptible genotypes. A Simpson diver-sity index,Hs= 1−Pi[ni(ni−1)/N(N −1)] where ni represents the number of isolates within theith pheno-type andN the sample size (Groth and Roelfs, 1987), was calculated for Burundese isolates for which we precisely know the collection sites. This index takes values between 0 (if all strains are similar) and 1 (if each strain is different from all the others).
Bands observed by RAPD analyses were recorded in relation with their migration within the gel. It was assumed that bands of the same molecular weight in dif-ferent individuals were identical. For each individual, the presence or absence of each band was determined
563 and designated by 1 or 0 respectively. The generated
distance matrix was used for hierarchical cluster anal-ysis using the average linkage method with the sta-tistical SYSTAT program. Distances between isolates were calculated as the percentage of unshared bands. A dendrogram showing the distances between isolates according to their respective RAPD patterns derived from this analysis.
For the isolates collected in Burundi, molecular sim-ilarity percentages, calculated as the percentages of shared bands for each isolates pair, were calculated.
Pearson correlation coefficients between RAPD data (bands) and virulence properties (RTs on plant geno-types) were calculated using the SAS System. In order to determine the significance of the correlation, the pro-portion of coefficients greater than the significant level at an error of 5% was determined.
Results
Reaction type analysis
The three categories of RT (resistance, partial resis-tance and susceptibility) were observed with some plant genotypes according to the inoculated isolate. For example, genotype BAT76 appeared resistant to isolate KGR1, partially resistant to KGM1 but was susceptible to isolate KGM2. In the case of compatible reactions (grouping susceptible and partially resistant RT), the symptoms appeared 10 days after P. griseola inocula-tion. In the case of susceptible RTs, symptom intensity reached the highest score (9 on the CIAT scale) 16 days after inoculation. 0 5 10 15 20 25 0 2 4 6 8 10 12 14 16 18 20 22 24 26 28
Number of plant genotypes with compatible reaction
Percentage of isolates
Figure 1. Analysis of the pathogen complexity of P. griseola isolates according to reactions caused on the 29 plant genotypes. For each isolate, the complexity evaluated by the number of genotypes with a compatible reaction (susceptible or partially resistant) was established. The different isolates exhibited a high diversity in virulence when inoculated on the 29 plant genotypes. A total of 53 different virulence patterns were observed in the 54 isolates analysed. Figure 1 illustrates the dis-tribution of the complexity of African isolates. The value of that parameter ranged from 0 (for isolates KGM4 and ZA7, which failed to produce compatible reaction on any tested genotype) to 24 (for isolates appearing virulent on a high proportion of genotypes). The more virulent an isolate appeared on a high number of genotypes, the more distant it was from the group of isolates (KGM4, ZA7) on the dendrogram (Figure 2).
The distribution of isolates within the different groups of the dendrogram could not be related to their geographical origin. Isolates collected in the same loca-tion showed differences in their patterns of virulence. For example, isolates NMM1, NMM2 and NMM3 originating from Murama in Burundi caused com-patible reactions (susceptibility or partial resistance) respectively on 2, 19 and 14 genotypes. A similar result was observed with isolates originating from Gitega (BGA2, BGA4 and BGA5) which established compat-ible reactions on 13, 24 and 21 genotypes respectively. Table 3 shows the diversity index calculated by the Simpson formula for Burundese isolates. Within most of the considered groups, this value is equal to 1, mean-ing that each isolate has a virulence pattern different from those of all the other isolates of the same location.
RAPD analysis
Preliminary RAPD amplifications allowed the selec-tion of 5 primers giving rise to repeatable results. The 54 P. griseola monospore isolates were analysed with
Figure 2. Dendrogram of 54 P. griseola isolates based on the RT (resistance, partial resistance and susceptibility) caused by their inoculation on 29 plant genotypes. Distance between 2 isolates indicates the percentage of plant genotypes on which isolates caused different reactions. Distances varied from 0% in case of identical RT to 100% if the RT falled into a different category for each of the inoculated genotypes.
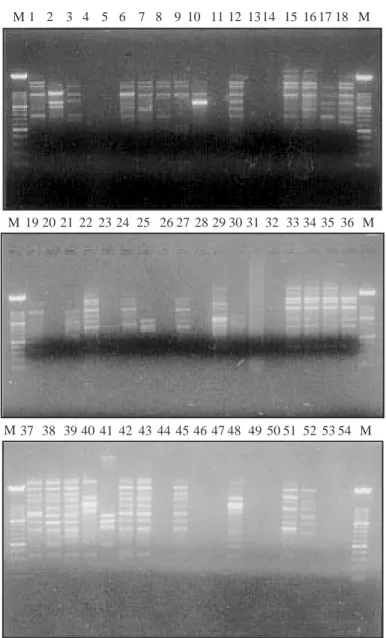
the 5 oligonucleotide primers. An analytical example of the banding patterns obtained with RAPD using OPL17 is shown in Figure 3. Information on banding patterns obtained was used to determine genetic dis-tances between isolates and to construct dendrogram revealing clusters (Figure 4). Isolates ZA7, ZA10 and KGR3 failed to yield amplification products and were not included in this cluster analysis. These 3 isolates
showed RAPD amplification with other primers, mean-ing that the absence of bands with the 5 primers was not caused by inadequate quality of DNA (results not shown). Among the remaining 51 isolates, there was no group of isolates without any difference in RAPD products, where 51 RAPD patterns were recorded. All the 74 amplified bands were polymorphic because not one of them was common to all the isolates.
565 Table 3. Simpson diversity index on the base of
the virulence properties of isolates originating from the same locality in Burundi
All Burundese isolates∗ 0.94
Isolates of the group KGM 0.93
Isolates of the group KGR 1
Isolates of the group NMM 1
Isolates of the group KK 1
Isolates of the group BGA 1
∗Letters abbreviate the isolates origin.
KGM: Kayanza–Gatara–Muhingira. KGR: Kayanza–Gatara–Rubagabaga. NMM: Ngozi–Mwumba–Murama. KK: Kayanza–Kabuye.
BGA: Burundi–Gitega.
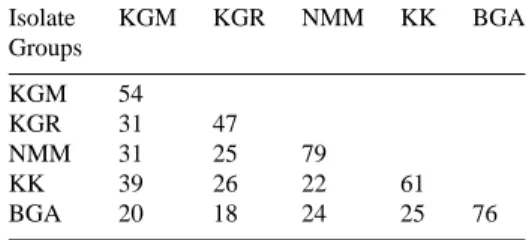
A lack of clustering according to the regions of ori-gin was observed. For example, isolate NMM3 was differentiated from NMM1 and NMM2 with a distance of 10% on the dendrogram, whereas all three isolates were collected in the same location. Other particular groups situated at low distances on the dendrogram contain isolates whose geographic origins were differ-ent. This was the case for the isolate groups (KGM3, KF1) and (BGA4, RDA6) where distances were of 2.7%. Within the first group, isolate KGM3 was from Burundi while isolate KF1 was from Kenya. For the other group, isolate BGA4 was from Burundi while isolate RDA6 was from Rwanda. However, molecular similarity (percentage of shared bands within all iso-lates pairs) for Burundese isoiso-lates was globally higher for isolates collected within the same area (same hill in this case) than between areas (Table 4).
Pathotype and molecular variation
No direct relationship between molecular pattern and pathotype structure was observed. In fact, correlation between molecular and virulence data was not signifi-cant. For example, isolates NMM1 and NMM2, which presented similar molecular patterns, exhibited differ-ent virulence properties. Distances between isolates were greater for virulence compared to those of molec-ular clustering. Indeed, the highest distances were 63% for virulence properties and 32% for RAPD patterns.
Discussion
Our results confirmed the existence of many pathotypes within P. griseola but revealed a level of variability
not previously described. The majority of our isolates (53 of the 54 isolates analysed) exhibited different vir-ulence profiles even for isolates originating from the same location. We used high numbers of plant geno-types and pathogen isolates, which could explain such a level of virulence polymorphism detected. Indeed, the number of virulence patterns increases with the size of the differential set (Chen et al., 1993). However, our differential genotypes possess unknown resistance fac-tors, which greatly limits our capacity to interpret these data in terms of population structure. Moreover, the conclusions of any pathogen race survey rests on the validity of the sampling strategy. In our case, this one was achieved through the goodwill of researchers and farmers and had no systematic character.
Despite the relative inaccuracy of the data derived from the P. griseola race survey, the results highlight the existence of a great diversity of races, some of which were able to overcome the resistance of most of the plant genotypes available. In Central Africa, the exis-tence of that variability could be assigned to selective effects exercised by widely used mixtures of cultivars (Wolfe et al., 1997).
Variability revealed by isozyme and RAPD patterns has already been reported within P. griseola popula-tions (Boshoff et al., 1996; Guzm´an et al., 1995). In our study, very low polymorphism was found in the ITS regions (Busogoro et al., 1997), while RAPD anal-ysis identified a high polymorphism since no group of isolates with similar patterns was observed among the 51 isolates considered for the cluster analysis. Coexis-tence in the same area of isolates exhibiting different RAPD patterns was frequently observed.
The dendrogram obtained in this study did not show clustering according to the geographical origins, although molecular similarity was higher for isolates collected within the same site. Our dendrogram based on RAPD patterns did not exhibit 2 major groups of isolates. This is contrary to the results of Guzm´an et al. (1995) and Chac´on et al. (1997). This might indicate that our isolates were collected from the same common bean gene pool materials. In fact, genotypes of Andean gene pool are predominant within the African Great Lakes Region (Correa, 1988; Gepts and Bliss, 1988; Khairallah et al., 1990). While pathotypic structure is primarily dictated by host selection, phylogeny inferred from neutral molecular markers can reflect the relation-ship among strains. Based on the suitability of neutral markers for the determination of gene flow (Milgroom and Fry, 1997), RAPD patterns allowed the origin of inoculum for Crinipellis perniciosa (Andebrhan and
M M M 1 19 20 21 22 23 24 25 26 27 28 29 30 31 32 33 34 35 37 38 39 40 41 42 43 44 45 46 47 48 49 50 51 52 53 54 M 36 M 2 3 4 5 6 7 8 9 10 11 12 1314 15 16 17 18 M
Figure 3. Agarose-gel (1.5%) electrophoresis and staining with ethidium-bromide of the RAPD-amplified fragments from genomic DNA of the 54 P. griseola isolates by using the primer OPL17. Lanes 1 to 54 correspond to the numbers assigned to the P. griseola isolates (Table 1). Lanes M: Molecular weight size marker (100 bp ladder).
Furtek, 1994) and for Magnaporthe poae (Huff et al., 1994) to be determined. By a similar approach, Sicard et al. (1997) were able to track migrations of Col-letotrichum lindemuthianum in South America. Such an interpretation of our RAPD data is impossible due to the level of variability among the P. griseola isolates. Different mechanisms, including single mutations, migrations and sexual recombination, lead to the appearance of diversity within pathogen populations
(Burdon and Roelfs, 1985; Leung et al., 1993; Drenth et al., 1996). Similar RAPD patterns found between isolates collected from different geographical origins suggest that migration could have occurred between these locations, but further sampling would be neces-sary to confirm this hypothesis.
For a pathogen without known sexual reproduction, as in the case of P. griseola, the observed diversity is unlikely to be explained by sexual recombination.
567
Figure 4. Dendrogram of 54 P. griseola single-spore isolates based on their respective patterns generated by RAPD amplifications with 5 primers (OPK7, OPK9, OPK10, OPL17 and OPL18). Distance between 2 isolates indicates the percentage of unshared amplified fragments.
However, single mutations, some chromosomal aber-rations like deletions, translations and chromosomal losses (Kistler and Miao, 1992) and the presence of transposons (Kempken and K¨uck, 1998) may cause increased variability in fungi.
Our results have important implications regarding breeding for ALS resistance. It is not possible to iden-tify dominant virulence structures in the African Great
Lakes Region. In the presence of such a pathogenic variation, monocultures of cultivars with a single spe-cific resistance gene would quickly select for corre-sponding virulence (Tapsoba, 1996). Complementary analysis might allow understanding some epidemio-logical aspects like the population dynamics which is necessary for defining the resistance management by genes rotation or mixtures of varieties.
Table 4. Average of molecular similarity (%) according to RAPD patterns within and between groups of isolates collected in Burundi
Isolate KGM KGR NMM KK BGA Groups KGM 54 KGR 31 47 NMM 31 25 79 KK 39 26 22 61 BGA 20 18 24 25 76
∗Letters abbreviate the isolates origin.
KGM: Kayanza–Gatara–Muhingira. KGR: Kayanza–Gatara–Rubagabaga. NMM: Ngozi–Mwumba–Murama. KK: Kayanza–Kabuye. BGA: Burundi–Gitega. Acknowledgements
J.P. Busogoro was supported by a fellowship of BADC (Belgian Administration for Development and Coop-eration), which we gratefully acknowledge.
References
Aggarwal VD, Jambawe CM, Chirwa RM and Kisyombe CT (1996) Identification of a multiple disease resistant line from the andean gene pool. Annual Report of the Bean Improvement Cooperative 39: 282–283
Alvarez-Ayala G and Schwartz HF (1979) Preliminary investiga-tions of pathogenic variability expressed by Isariopsis grise-ola. Annual Report of the Bean Improvement Cooperative 22: 86–87
Andebrhan T and Furtek DB (1994) Random amplified polymor-phic DNA (RAPD) analysis of Crinipellis perniciosa isolates from different hosts. Plant Pathology 43: 1020–1027 Boshoff WHP, Swart WJ, Pretorius ZA, Liebenberg MM and
Crous PW (1996) Isozyme variability among isolates of Phaeoisarionpsis griseola in southern Africa. Plant Pathology 45: 344 –349
Burdon JJ and Roelfs AP (1985) Isozyme and virulence variation in asexually reproducing populations of Puccinia graminis and P. recondita on wheat. Phytopathology 75: 907–913 Busogoro JP, Colinet D and Lepoivre P (1997) A non-radioactive
Single Strand Conformation Polymorphism using digoxigenin detection system to analyse the genetic diversity of ITS region in fungi. Proceedings of the 49th International Sym-posium on Crop Protection. Med Fac Landbouw Unive Gent pp 919–927
Chac´on MI, Jara C, Castellanos G, Posso CE, Buruchara R, Cuasquer JB and Pastor-Corrales MA (1997) Genetic diversity and relation between Common Bean Angular Leaf Spot fungus isolates from Africa and South America: genetic improvement
implications. Annual report of the Bean Improvement Cooper-ative 40: 127–128
Chen X, Line RF and Leung H (1993) Relationship between virulence variation and DNA polymorphism in Puccinia stri-iformis. Phytopathology 83: 1489–1497
Correa VF (1988) Pathogenic variation, production of toxic metabolites, and isoenzyme analysis in Phaeoisariopsis grise-ola (Sacc.) Ferr. Ph. D. Dissertation. Michigan State University, USA, 154 p
Drenth A, Whisson SC, Maclean DJ, Irwin JAG, Obst NR and Ryley MJ (1996) The evolution of races of Phytophthora sojae in Australia. Phytopathology 86: 163–169
Doyle JJ and Doyle JL (1990) Isolation of plant DNA from fresh tissue. Focus 12: 13–15
Gepts P and Bliss FA (1988) Dissemination pathways of common bean (Phaseolus vulgaris, Fabaceae) deduced from phaseolin electrophoretic variability. II. Europe and Africa. Economic Botany 42: 86–104
Gonz´alez M, Rodr´ıguez R, Zavala ME, Jacobo JL, Hern´andez F, Acosta J, Mart´ınez O and Simpson J (1998) Characterization of Mexican isolates of Colletotrichum lindemuthianum by using differential cultivars and molecular markers. Phytopathology 88: 292–299
Groth JV and Roelfs AP (1987) The concept and measure-ment of phenotypic diversity in Puccinia graminis on wheat. Phytopathology 77: 1395–1399
Guzm´an P, Gilbertson RL, Nodari R, Johnson WC, Temple SR, Mandala D, Mkandawire ABC and Gepts P (1995) Charac-terization of variability in the fungus Phaeoisariopsis griseola suggests coevolution with the common bean (Phaseolus vulgaris). Phytopathology 85: 600–607
Huff DR, Bunting TE and Plumley KA (1994) Use of ran-dom amplified polymorphic DNA markers for the detection of genetic variation in Magnaporhe poae. Phytopathology 84: 1312–1316
Kempken F and K¨uck U (1998) Transposons in filamentous fungi-facts and perspectives. BioEssays 20: 652–659
Khairallah MM, Adams MW and Sears BB (1990) Mitochondrial DNA polymorphisms of Malawian bean lines: further evidence for two major gene pools. Theoretical and Applied Genetics 80: 753–761
Kistler HC and Miao VPW (1992) New modes of genetic change in filamentous fungi. Annual Review of Phytopathology 30: 131–152
Kolmer JA, Liu JQ and Sies M (1995) Virulence and molecular polymorphism in Puccinia recondita f.sp. tritici in Canada. Phytopathology 85: 276–285
Leung H, Nelson RJ and Leach JE (1993) Population struc-ture of plant pathogenic fungi and bacteria. In: Andrews J and Tommerop I (eds.) Advances in Plant Pathology. Vol 10 (pp 157–205) Academic Press, New York
Milgroom MG (1997) Genetic variation and the application of genetic markers for studying plant pathogen populations. Journal of Plant Pathology 78: 1–13
Milgroom MG and Fry WE (1997) Contributions of popula-tion genetics to plant disease epidemiology and management. Advances in Botanical Research 24: 1–30
Schoonhoven A and Pastor-Corrales MA (1992) Syst`eme Stan-dard pour l’Evaluation du Germoplasme du Haricot. Centro Internacional de Agricultura Tropical, Cali, Colombia, 49 p
569 Schwartz HF, Correa VF, Pineda PAD, Otaya MM and Katherman
MJ (1981) Dry bean yield losses caused by Ascochyta, angular and white leaf spots in Colombia. Plant Disease 65: 494 – 496 Sicard D, Michalakis Y, Dron M and Neema C (1997) Genetic diversity and pathogenic variation of Colletotrichum linde-muthianum in the three centers of diversity of its host, Phase-olus vulgaris. Phytopathology 87: 807–813
Srivastava LS, Gupta DK, Dhiman KR and Singh G (1995) Source of resistance in french bean (Phaseolus vulgaris) to angular leaf-spot (Phaeoisariopsis griseola) in Sikkim. Indian Journal of Agricultural Sciences 65: 305–307
Tapsoba H (1996) Pathogenic variation in Puccinia substriata var. indica in the southeastern United States and screening for resis-tance in pearl millet germplasm. Plant Disease 80: 395–397 Wolfe MS, Pope CV, Lannou C, Goyeau H, Finckh MR, Munk L,
Merz U, Valenghi D and Gacek E (1997) M´elanges vari´etaux de bl´es ou d’orges. Th´eorie, pratique et exemples. Phytoma 497: 28–31
W¨ostemeyer J (1985) Strain-dependent variation in ribosomal DNA arrangement in Absidia glauca. European Journal of Biochemistry 146: 443– 448