arXiv:astro-ph/0306084v1 4 Jun 2003
(DOI: will be inserted by hand later)
WR bubbles and He
emission
⋆
Y. Naz´e
⋆⋆1G. Rauw
⋆⋆⋆1J. Manfroid
†1Y.-H. Chu
2and J.-M. Vreux
11 Institut d’Astrophysique et de G´eophysique; Universit´e de Li`ege; All´ee du 6 Aoˆut 17, Bat. B5c; B 4000 - Li`ege; Belgium 2 Astronomy Department; University of Illinois at Urbana-Champaign; 1002 West Green Street; Urbana, IL 61801; USA
Abstract.
We present the very first high quality images of the He λ4686 emission in three high excitation nebulae of the Magellanic Clouds. A fourth high excitation nebula, situated around the WR star BAT99-2, was analysed in a previous letter. Using VLT FORS data, we investigate the morphology of the ring nebulae around the early-type WN stars BAT99-49 & AB7. We derive the total He fluxes for each object and compare them with the most recent theoretical WR models. Whilst the ionization of the nebula around BAT99-49 can be explained by a WN star of temperature 90-100 kK, we find that the He emission measure of the nebula associated with AB7 requires an He+ionizing flux larger than predicted for the hottest WN model available. Using Hα, [O ] and He λ5876 images along with long-slit spectroscopy, we investigate the physical properties of these ring nebulae and find only moderate chemical enrichment.
We also surveyed seven other LMC WR stars but we failed to detect any He emission. This holds also true for BAT99-9 which had been proposed to excite an He nebula. Four of these surveyed stars are surrounded by a ring nebula, and we use the FORS data to derive their chemical composition: the nebula around BAT99-11 shows a N/O ratio and an oxygen abundance slightly lower than the LMC values, while the nebula around BAT99-134 presents moderate chemical enrichment similar to the one seen near BAT99-2, 49 and AB7. Comparing the WR stars of the LMC, BAT99-2 and 49 appear rather unique since similar stars do not reveal high excitation features.
The third high excitation nebula presented in this paper, N44C, does not harbor stars hotter than mid-O main sequence stars. It was suggested to be a fossil X-ray nebula ionized by the transient LMC X-5. Our observations of N44C reveal no substantial changes in the excitation compared to previous results reported in the literature. Therefore, we conclude that either the recom-bination timescale of the X-ray nebula has been underestimated or that the excitation of the nebula is produced by another, yet unknown, mechanism.
Key words.Stars: individual: SMC AB7 and LMC BAT99-2, 8, 9, 11, 49, 52, 63, 84, 134 - ISM: individual objects: LMC N44C, SMC N76 - HII regions - ISM: bubbles - ISM: abundances - Magellanic Clouds
1. Introduction
Massive stars are known to possess strong stellar winds. Throughout their lives, these winds are able to shape their environment. Winds of O stars can sweep up the Interstellar Medium (ISM) and create interstellar bubbles, a few examples of which have been given in Naz´e et al. (2001, 2002). While evolving into a Luminous Blue Variable or a Red Supergiant phase, the star blows a very dense and slow wind that can be swept up by the subsequent faster Wolf-Rayet (WR) wind. This second wind-blown bubble will ultimately collide with the first one. Numerical simulations of such processes have been performed by e.g. Garc´ıa-Segura et al. (1996, and references therein).
Send offprint requests to: Y. Naz´e e-mail: [email protected] ⋆ Based on observations collected at the European Southern Observatory, Cerro Paranal, Chile (ESO No. 68.C-0238(A,B)).
⋆⋆ Research Fellow FNRS (Belgium) ⋆⋆⋆ Research Associate FNRS (Belgium)
†
Research Director FNRS (Belgium)
Many examples of ring nebulae around WR stars are known, both in the Galaxy and in the Magellanic Clouds (MCs). However, the exact nature and evolutionary status of these candidate bubbles are still unknown in most cases, but could be investigated by means of kinematic studies (e.g. Chu et al. 1999) and/or abundance analyses.
A few WR ring nebulae present an additional, peculiar ture: nebular He λ4686 emission. Such a high excitation fea-ture is common amongst Planetary Nebulae, but O and WR stars were often thought unable to ionize He+ in a detectable manner in their surroundings. Only 7 He nebulae are known in the Local Group (Garnett et al. 1991a), and five of them are around WR stars. Nebular He features have also been found farther away, in starburst galaxies, and were again attributed to WR stars (Schaerer 1996), though this interpretation is now questioned by Smith et al. (2002). Observations of the He emission can provide an accurate constraint on the otherwise unobservable far UV fluxes of WR stars, but for the moment, this can only be done with precision for the Local Group ob-jects.
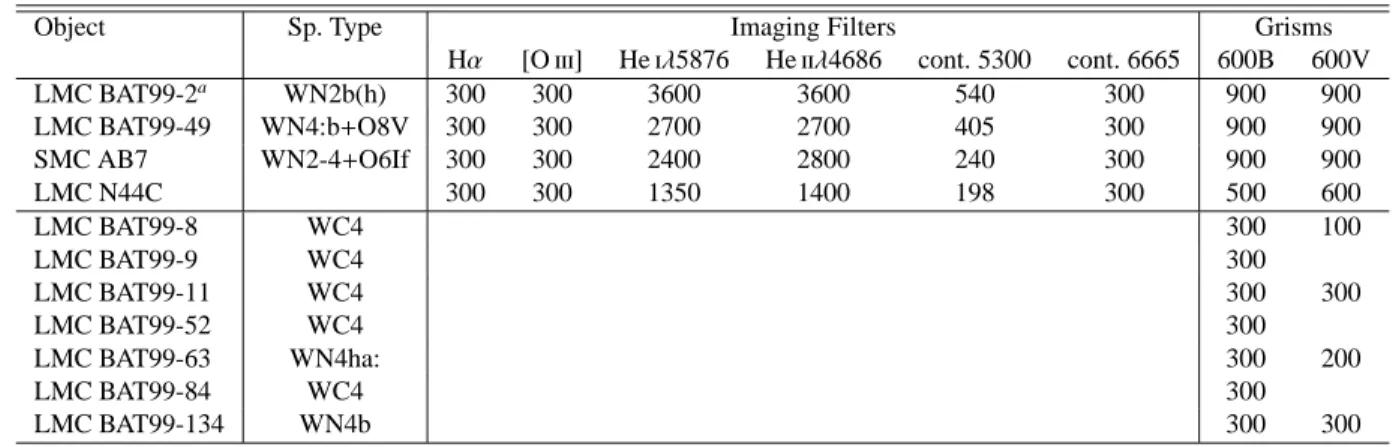
Table 1. Total exposure times (in sec.) for each object, in each filter and for each grism. Spectral types are taken from Foellmi et
al. (2003a and 2003b), Bartzakos et al. 2001 and Niemela et al. 2002.
Object Sp. Type Imaging Filters Grisms
Hα [O ] He λ5876 He λ4686 cont. 5300 cont. 6665 600B 600V LMC BAT99-2a WN2b(h) 300 300 3600 3600 540 300 900 900 LMC BAT99-49 WN4:b+O8V 300 300 2700 2700 405 300 900 900 SMC AB7 WN2-4+O6If 300 300 2400 2800 240 300 900 900 LMC N44C 300 300 1350 1400 198 300 500 600 LMC BAT99-8 WC4 300 100 LMC BAT99-9 WC4 300 LMC BAT99-11 WC4 300 300 LMC BAT99-52 WC4 300 LMC BAT99-63 WN4ha: 300 200 LMC BAT99-84 WC4 300 LMC BAT99-134 WN4b 300 300 aSee Paper I.
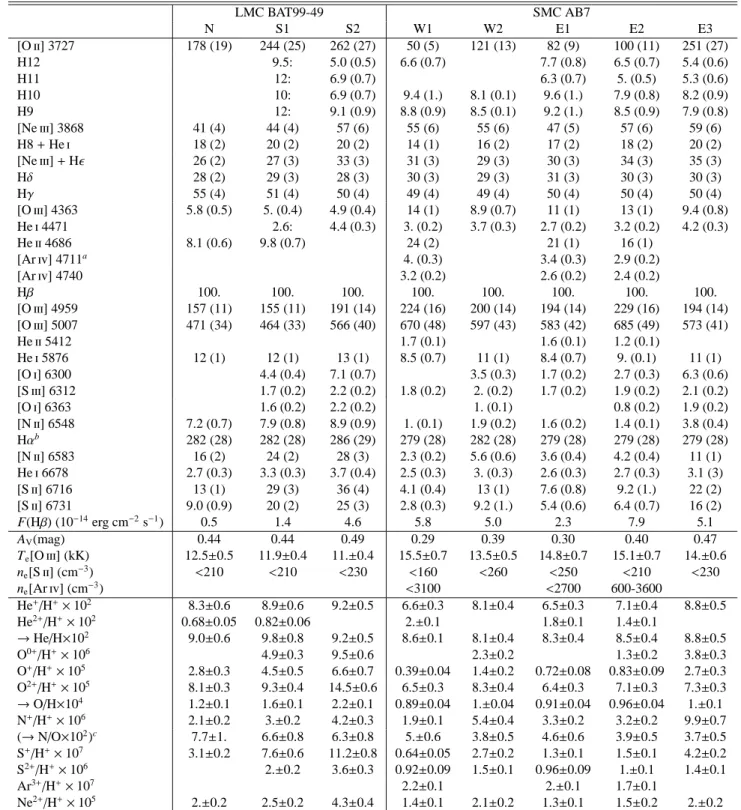
Fig. 1. FORS Hα image of LMC BAT99-49. The different regions used for spectral analysis are marked by a solid line, except
for the background region, which is just outside the image. Bright stars and features discussed in the text are labelled.
Fig. 2. FORS Hα image of SMC N76. The different regions used for spectral analysis are marked by a solid line, and bright stars
and features discussed in the text are labelled.
We thus decided to investigate the case of the three high excitation nebulae around WR stars in the MCs. The nebula around BAT99-2 was already analysed in Naz´e et al. (2003, hereafter Paper I) and we discuss here the two remaining cases. To date, only low resolution, low signal/noise He images of the nebulae surrounding BAT99-2 and AB7 exist (Melnick & Heydari-Malayeri 1991) and we present here the very first high quality VLT images of the high excitation nebulae associated with BAT99-49 and AB7. In addition, we will also investigate a fourth peculiar He nebula, N44C, which may be a fossil X-ray nebula. All these objects are situated in the LMC, except for AB7, which is in the SMC. Finally, we also present the results of a small survey of LMC WR stars to search for the possible existence of nebular He emission. Since some of these stars have ring nebulae around them, our spectroscopic data also en-able us to examine their physical properties. In this paper, we will first describe the observations, then explore the morphol-ogy and spectrophotometry of the high excitation nebulae and present our small WR survey. We will finally conclude in Sect. 5.
2. Observations
We obtained CCD images of the He emission nebulae in the MCs with the FORS1 instrument on the 8 m VLT-UT3 in 2002 January. The images were taken through sev-eral filters: Hα (λ0=6563Å, FWHM=61Å), [O ] (λ0=5001Å,
FWHM=57Å), He λ5876 (λ0=5866Å, FWHM=60Å), He
λ4686 (λ0=4684Å, FWHM=66Å), plus continuum filters
cen-tered at 5300Å (FWHM=250Å) and 6665 Å (FWHM=65Å). To avoid saturation, we split the observations into multiple, short exposures: the total exposure times achieved are pre-sented in Table 1. The pixel size of the detector is 0.′′2 on
the sky and the seeing was ∼1′′, thus providing the highest resolution images so far of these nebulae in this filter set. The data were reduced with 1using standard methods for
overscan and bias subtraction and flatfielding. The images of each filter were then aligned and combined with . We con-structed star-free images in the Hα and [O ] lines by sub-tracting the images obtained in the neighbouring continuum filters. However, these continuum filters are slightly polluted by faint nebular lines. While these faint lines constitute only small contamination compared to the bright Hα and [O ] lines, they are more problematic when we are dealing with the images corresponding to the filters centered on the fainter He and He lines. To obtain star-free He and He images, we first constructed with a list of stars by search-ing emission features on the 5300 Å continuum image. We then used this list of stars as input for psf-fitting on the He and He images. A subtracted image is then built automati-cally when the photometry of all sources is known. The few remaining faint stars were either removed individually or not considered for flux determinations. Figs. 1, 2 and 6 present complete Hα images of BAT99-49, AB7 and N44C. Figs. 3 and 7 further show close-ups on BAT99-49 and N44C in the four nebular filters, while Fig. 4 compares the whole VLT field centered on AB7 in each nebular filter. Three color im-ages of the high excitation nebulae are available on the web at http://www.eso.org/outreach/press-rel/pr-2003/pr-08-03.html
During the same observing run, we also obtained long-slit spectra of these 4 objects with the same instrument used in 1 IRAF is distributed by the National Optical Astronomy Observatories, which are operated by the Association of Universities for Research in Astronomy, Inc., under cooperative agreement with the National Science Foundation.
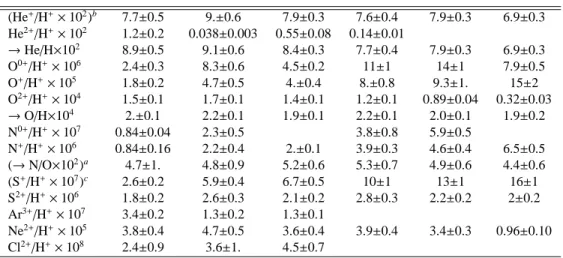
Table 2. Dereddened line ratios with respect to Hβ=100.0 (see text for details). Uncertainties in the line ratios, estimated from the
signal/noise in the lines and the calibration errors, are given in parentheses. The physical properties derived using the line ratios are also indicated below. A ‘:’ denotes an uncertain value, that is not used for abundance calculation when other measurements of the same ion exist.
LMC BAT99-49 SMC AB7 N S1 S2 W1 W2 E1 E2 E3 [O ] 3727 178 (19) 244 (25) 262 (27) 50 (5) 121 (13) 82 (9) 100 (11) 251 (27) H12 9.5: 5.0 (0.5) 6.6 (0.7) 7.7 (0.8) 6.5 (0.7) 5.4 (0.6) H11 12: 6.9 (0.7) 6.3 (0.7) 5. (0.5) 5.3 (0.6) H10 10: 6.9 (0.7) 9.4 (1.) 8.1 (0.1) 9.6 (1.) 7.9 (0.8) 8.2 (0.9) H9 12: 9.1 (0.9) 8.8 (0.9) 8.5 (0.1) 9.2 (1.) 8.5 (0.9) 7.9 (0.8) [Ne ] 3868 41 (4) 44 (4) 57 (6) 55 (6) 55 (6) 47 (5) 57 (6) 59 (6) H8 + He 18 (2) 20 (2) 20 (2) 14 (1) 16 (2) 17 (2) 18 (2) 20 (2) [Ne ] + Hǫ 26 (2) 27 (3) 33 (3) 31 (3) 29 (3) 30 (3) 34 (3) 35 (3) Hδ 28 (2) 29 (3) 28 (3) 30 (3) 29 (3) 31 (3) 30 (3) 30 (3) Hγ 55 (4) 51 (4) 50 (4) 49 (4) 49 (4) 50 (4) 50 (4) 50 (4) [O ] 4363 5.8 (0.5) 5. (0.4) 4.9 (0.4) 14 (1) 8.9 (0.7) 11 (1) 13 (1) 9.4 (0.8) He 4471 2.6: 4.4 (0.3) 3. (0.2) 3.7 (0.3) 2.7 (0.2) 3.2 (0.2) 4.2 (0.3) He 4686 8.1 (0.6) 9.8 (0.7) 24 (2) 21 (1) 16 (1) [Ar ] 4711a 4. (0.3) 3.4 (0.3) 2.9 (0.2) [Ar ] 4740 3.2 (0.2) 2.6 (0.2) 2.4 (0.2) Hβ 100. 100. 100. 100. 100. 100. 100. 100. [O ] 4959 157 (11) 155 (11) 191 (14) 224 (16) 200 (14) 194 (14) 229 (16) 194 (14) [O ] 5007 471 (34) 464 (33) 566 (40) 670 (48) 597 (43) 583 (42) 685 (49) 573 (41) He 5412 1.7 (0.1) 1.6 (0.1) 1.2 (0.1) He 5876 12 (1) 12 (1) 13 (1) 8.5 (0.7) 11 (1) 8.4 (0.7) 9. (0.1) 11 (1) [O ] 6300 4.4 (0.4) 7.1 (0.7) 3.5 (0.3) 1.7 (0.2) 2.7 (0.3) 6.3 (0.6) [S ] 6312 1.7 (0.2) 2.2 (0.2) 1.8 (0.2) 2. (0.2) 1.7 (0.2) 1.9 (0.2) 2.1 (0.2) [O ] 6363 1.6 (0.2) 2.2 (0.2) 1. (0.1) 0.8 (0.2) 1.9 (0.2) [N ] 6548 7.2 (0.7) 7.9 (0.8) 8.9 (0.9) 1. (0.1) 1.9 (0.2) 1.6 (0.2) 1.4 (0.1) 3.8 (0.4) Hαb 282 (28) 282 (28) 286 (29) 279 (28) 282 (28) 279 (28) 279 (28) 279 (28) [N ] 6583 16 (2) 24 (2) 28 (3) 2.3 (0.2) 5.6 (0.6) 3.6 (0.4) 4.2 (0.4) 11 (1) He 6678 2.7 (0.3) 3.3 (0.3) 3.7 (0.4) 2.5 (0.3) 3. (0.3) 2.6 (0.3) 2.7 (0.3) 3.1 (3) [S ] 6716 13 (1) 29 (3) 36 (4) 4.1 (0.4) 13 (1) 7.6 (0.8) 9.2 (1.) 22 (2) [S ] 6731 9.0 (0.9) 20 (2) 25 (3) 2.8 (0.3) 9.2 (1.) 5.4 (0.6) 6.4 (0.7) 16 (2) F(Hβ) (10−14erg cm−2s−1) 0.5 1.4 4.6 5.8 5.0 2.3 7.9 5.1 AV(mag) 0.44 0.44 0.49 0.29 0.39 0.30 0.40 0.47 Te[O ] (kK) 12.5±0.5 11.9±0.4 11.±0.4 15.5±0.7 13.5±0.5 14.8±0.7 15.1±0.7 14.±0.6 ne[S ] (cm−3) <210 <210 <230 <160 <260 <250 <210 <230 ne[Ar ] (cm−3) <3100 <2700 600-3600 He+/H+×102 8.3±0.6 8.9±0.6 9.2±0.5 6.6±0.3 8.1±0.4 6.5±0.3 7.1±0.4 8.8±0.5 He2+/H+×102 0.68±0.05 0.82±0.06 2.±0.1 1.8±0.1 1.4±0.1 →He/H×102 9.0±0.6 9.8±0.8 9.2±0.5 8.6±0.1 8.1±0.4 8.3±0.4 8.5±0.4 8.8±0.5 O0+/H+×106 4.9±0.3 9.5±0.6 2.3±0.2 1.3±0.2 3.8±0.3 O+/H+×105 2.8±0.3 4.5±0.5 6.6±0.7 0.39±0.04 1.4±0.2 0.72±0.08 0.83±0.09 2.7±0.3 O2+/H+×105 8.1±0.3 9.3±0.4 14.5±0.6 6.5±0.3 8.3±0.4 6.4±0.3 7.1±0.3 7.3±0.3 →O/H×104 1.2±0.1 1.6±0.1 2.2±0.1 0.89±0.04 1.±0.04 0.91±0.04 0.96±0.04 1.±0.1 N+/H+×106 2.1±0.2 3.±0.2 4.2±0.3 1.9±0.1 5.4±0.4 3.3±0.2 3.2±0.2 9.9±0.7 (→ N/O×102)c 7.7±1. 6.6±0.8 6.3±0.8 5.±0.6 3.8±0.5 4.6±0.6 3.9±0.5 3.7±0.5 S+/H+×107 3.1±0.2 7.6±0.6 11.2±0.8 0.64±0.05 2.7±0.2 1.3±0.1 1.5±0.1 4.2±0.2 S2+/H+×106 2.±0.2 3.6±0.3 0.92±0.09 1.5±0.1 0.96±0.09 1.±0.1 1.4±0.1 Ar3+/H+×107 2.2±0.1 2.±0.1 1.7±0.1 Ne2+/H+×105 2.±0.2 2.5±0.2 4.3±0.4 1.4±0.1 2.1±0.2 1.3±0.1 1.5±0.2 2.±0.2 aThe small contamination due to He 4713 was corrected using the strength of He 5876 and the theoretical He ratios from Benjamin et al. (1999).
bContamination due to He 6560 negligible. cAssuming N(N+)/N(O+) = N(N)/N(O).
spectroscopic mode. We also made a small survey to study the environment of seven other WR stars of the LMC: BAT99-8, 9, 11, 52, 63, 84, and 134. We used the 600B and 600V grisms to obtain a blue spectrum covering the range 3700-5600 Å (R ∼ 800) and a red spectrum covering 4500-6850Å (R ∼ 1000), respectively. The 1.3′′×6.8′ slit was tilted, with respect to the N-S direction, by 45◦ for the observations of BAT99-2, 11, and 134; by 55◦ for BAT99-63; and by 90◦ for AB7. In the remaining cases, the slit was oriented in the N-S direction. The spatial resolution was 0.9′′-1.4′′ and the spec-tral resolution, as mesured from the FWHM of the calibration lines, 7Å. The spectra were reduced and calibrated in a stan-dard way using . For flux calibration, we observed several standard stars from Oke (1990) and we used the mean atmo-spheric extinction coefficients for CTIO reduced by 15%. We checked that this calibration produces the correct fluxes for the standard stars and for a standard Planetary Nebula (Dopita & Hua 1997). For the 4 high excitation nebulae, sky subtraction was done using a small region of the spectra where the nebu-lar emission is the lowest. For the WR survey, whenever pos-sible, we used several regions of lowest emission situated on each side of the star and its associated nebula to increase the S/N. Only a few residuals remained for the brighter sky lines (e.g. [O ] 5577Å). The nebular lines were then fitted by gaus-sians using . The Balmer decrement Hα/Hβ was used to derive the interstellar extinction, assuming the theoretical case B decrement (Storey & Hummer 1995) at either T =10 kK, 12.5 kK or 15 kK, whatever was the closest to the tempera-ture derived using the [O ] lines (see below). Some spectra were contaminated by faint stars, and in such cases, we cor-rect the measured emission line strengths by a 2 Å equivalent width for the Balmer absorptions (McCall et al. 1985) before estimating the reddening. To deredden the line ratios, we used the extinction law from Cardelli et al. (1989) with RV = 3.1
for the LMC (Fitzpatrick 1989) and RV = 2.7 for the SMC
(Bouchet et al. 1985). We used these line ratios in conjunction with the package under (Shaw & Dufour 1995) to derive temperatures, densities and abundances, the latter being calculated assuming a constant ne = 100 cm−3 and Te([O ]).
If several lines of the same ion exist, the abundance presented in this paper is an average of the abundances derived for each line.
3. The high excitation nebulae
3.1. LMC BAT99-49
Nebular He emission was discovered near BAT99-49 (Brey 40a, Sk-7134) by Niemela et al. (1991). This emission appar-ently covered 70′′ on their slit, and corresponds to ‘a partial ring seen in Hα and [O ]’. In a study of kinematics of WR nebulae, Chu et al. (1999) found evidence of interaction be-tween the stellar wind of BAT99-49 and the ambient ISM but did not detect a well-defined expanding shell.
BAT99-49 has been recently re-classified as WN4:b+O8V by Foellmi et al. (2003b). We present in Fig. 1 an Hα image of the whole field, and in Fig. 3 a close-up in the four nebular filters. To the south of the star, a small arc of 16′′radius is
vis-Fig. 3. FORS continuum subtracted Hα, [O ], He , and He
images of LMC BAT99-49 and its close surroundings. The im-ages are 180′′×180′′. A white cross indicates the WR star’s position. The crowdiness of this field renders star-subtraction uttermost difficult. North is up and East to the left.
Table 3. Average abundances in the Magellanic Clouds, from
Russel & Dopita (1990).
He/H O/H N/H N/O S/H
LMC 0.091 2.3×10⁻⁴ 1.2×10⁻⁵ 0.050 7.4×10⁻⁶ SMC 0.083 1.3×10⁻⁴ 3.5×10⁻⁶ 0.026 6.8×10⁻⁶
ible in [O ], and to a lesser extent in Hα. A very bright Hα region, BSDL 1985, is also present some 40′′south of the star. It was identified as the ring nebula associated with BAT99-49 by Dopita et al. (1994). The southern limit of that region has a lower [O ]/Hα ratio than the direct surroundings of BAT99-49. A second Hα region encloses the star to the east, at roughly 36′′, but this region completely disappears in [O ]. A beau-tiful ring nebula, BSDL 1935 (Bica et al. 1999) is present to the southwest of the field and possesses a very low [O ]/Hα ratio. Generally, the regions to the west of BAT99-49 present a higher [O ]/Hα ratio than those to the east. As for BAT99-2 (see Paper I), the He image appears well correlated with Hα. On the contrary, the He image shows completely different fea-tures. The brightest He regions are the small arc 16′′south of the star and the bright Hα region 40′′south of the star. A halo surrounds the star and fills the region between the star and the two brighter features. Still fainter emission is also present, but even our 2700s exposure just barely detects it. Compared to BAT99-2, the He emission is much fainter but also more ex-tended.
By comparing the flux in ADU on the images at the po-sition of the slit with our calibrated spectrophotometry con-volved with the filter transmission, we were able to calibrate our He λ4686 images. We then measured the He λ4686 flux2 in a region 36′′×28′′encompassing the WR star and the brightest He emission regions. We find a flux of about 1×1035 erg cm−2s−1after a reddening correction A
Vof 0.4 mag
(esti-mated using the Balmer decrement, see Sect. 2 and Table 2, and assuming a uniform reddening). That corresponds to an ionizing flux of ∼1×1047photons s−1. At the LMC metallicity
(Z = 0.2 − 0.4 Z⊙), this is what can be expected for a 90-100 kK WN star (Smith at al. 2002). This value may be a lower limit, since we did not take into account all the faintest emission, but its contribution should be rather low. With only 5×1036 He+ ionizing photons s−1 (Smith at al. 2002), the O8V companion
of the WR star has a negligible influence on the He nebula. Spectra were extracted from three regions of interest for detailed analysis (Fig. 1): the first one samples the north of the star (11′′long without the star); the second examines the close 2 Due to errors in the flux calibration and to possible contamination from a poor subtraction of some stars, we estimate that, throughout this paper, the He fluxes can be considered to have a maximal relative error of 50%.
15′′ south of the star and the third one explores the bright Hα region further south (38′′ long). None contains the WR star, nor another very bright star. The extinction-corrected line ra-tios and the physical properties derived for these regions are listed in Table 2. To get helium abundances, we used the emis-sivities at 12500K computed by Benjamin et al. (1999) for He and by Storey & Hummer (1995) for H and He . The pres-ence of He suggests that higher ionization states than O2+
ex-ist as well, and we correct the N(O)/N(H) ratio like we did in Paper I. Compared to the LMC abundances (Russell & Dopita 1990, see Table 3), no sign of enrichment in helium can be de-tected for the He nebula. But while the oxygen abundance of the bright Hα region appears consistent with the LMC, the abundance closer to the star is slightly lower, and the N/O ratio higher than the LMC value. The close neighbourhood of the star appears thus enriched by a stellar wind displaying CNO processed material.
3.2. Star SMC AB7 and its associated nebula SMC N76
N76 is a large circular nebula some 130′′in radius situated to the north of the SMC. Nebular He emission in N76 was first discovered serendipitously by Tuohy & Dopita (1983), while studying the neighbouring SNR 1E0101.2-7218. It was redis-covered later by Pakull & Motch (1989b) who noted that the center of gravity of the He emission coincides well with the WR star AB7. Spectra taken by Niemela et al. (1991) show a He region of size 144′′, that fills a ‘central hole seen in He and Hα’. Because of the presence of the He nebula, this star, like BAT99-2, was classified as WN1 by Pakull (1991). More recent studies of the star undertaken by Niemela et al. (2002) and by Foellmi et al. (2003a) led to a re-classification of the star as WN2+O6I(f) and WN4+O6I(f), respectively.
Fig. 2 shows an Hα image of the whole field. N76 nearly completely fills the FORS CCD. Its surface brightness is not totally uniform: the nebula brightens to the east, most proba-bly indicating a density gradient. No ‘central hole’ is readily apparent, but many filamentary features cover the whole neb-ula. N76 also presents pillar-like features some 92′′ west of AB7, a quite rare type of structures, suggesting that the nebula is situated on the edge of a molecular cloud being photoevap-orated. These structures may hide a second generation of stars (Walborn 2002). We also note the presence, to the southeast of AB7, of a bright Hα knot of diameter 16′′, N76A or DEM S123, which we will discuss more below.
The He emission appears well correlated with Hα, whilst the [O ] image shows several differences: mainly, the SNR is clearly visible to the northeast of the field, and N76 is slightly smaller in this line (124′′radius). Some of the filamentary fea-tures, the pillars and the bright Hα emitter DEM S123 present a lower [O ]/Hα ratio than its surroundings. On the other hand, the He image shows a bright elliptic nebula of size 128′′×146′′. Like in Hα, the surface brightness is not uniform and the nebula appears composed of intrincate filaments mak-ing a reversed ‘S’. These filaments also appears in Hα, but they are rather faint. More extended, fainter He emission is also
Fig. 4. FORS continuum subtracted Hα, [O ], He , and He
images of SMC N76. The images are 394′′×394′′. A white cross indicates the position of SMC AB7 (note that the star is wrongly identified in Dopita et al. 1994). The SNR is the fea-ture to the NE of the field only visible in [O ]. North is up and East to the left.
detectable, corresponding more or less in size with the Hα neb-ula.
Garnett et al. (1991b) found an average I(He
λ4686)/I(Hβ) of 0.13 at their slit position, but we find that this ratio can actually reach higher values locally (see below). Assuming a spherical geometry, the same authors derived a luminosity L(Hβ) of 1.1×1038 erg s−1 and L(He
λ4686)=5.7×1036 erg s−1 for a distance of 78 kpc, or
L(Hβ)=6.2×1037erg s−1and L(He λ4686)=3.2×1036erg s−1
for our adopted SMC distance of 59 kpc. Another estimate was made by Pakull & Bianchi (1991), apparently using spectrophotometry and the same approximations as Garnett et al. (1991b). They found a flux in He λ4686 of 2.5×10⁻¹²
erg cm−2s−1, or L(He λ4686)=1×1036erg s−1for a distance
of 59 kpc. Using our images calibrated with our FORS spectrophotometry, we find a Hβ luminosity, excluding DEM S123, of 3.0×1037erg s−1inside a circular aperture of 130′′in radius and a He λ4686 luminosity of 4.5×1036erg s−1inside
an elliptic aperture of 120′′×152′′, after a reddening correction of AV=0.3 mag and for a distance of 59 kpc. Since a fainter
halo is present, we estimate that the He λ4686 flux may still be underestimated by 10%. Our He fluxes are larger than those obtained in the previous studies, but we use the actual surface brightness’ distribution of the whole nebula, not an extrapolation of a one-position measurement. Our measured Hβ and He λ4686 fluxes correspond to ionizing fluxes
Q(H0) = 6.5 × 1049 photons s−1 and Q(He+) = 5.1 × 1048
photons s−1. In the models of Smith et al. (2002), these values indicate a WN star hotter than their hottest model, of temper-ature 120 kK (for Z = 0.05 − 0.2 Z⊙, Q(He+) = 3 − 4 × 1048 photons s−1). We know that some O stars within N76 could
contribute to the ionization of the H nebula (the companion of AB7, an O6If star; AzV 327, an O9.7Iab star; [MWD2000] h53-91 and 137 (Massey et al. 2000), O8.5 V and III stars , respectively), but according to the same models, the O-type stars certainly do not account for the He+ionization: at most, these stars would contribute by 8.5×1049 H ionizing photons s−1 and 3×1044 He+ ionizing photons s−1. The He nebula
remains a puzzle: either AB7 is an ultra-hot WN star, or the models need to be adapted or revised, or another source of He ionization is present. In this respect, we note that AB7 does not appear as a particularly bright X-ray source (Foellmi et al. 2003a), casting doubts on an X-ray ionization contribution. Another possibility to produce a high excitation nebula requires high velocity shocks (Garnett et al. 1991b). However, so far no kinematic study of N76 was undertaken, and we thus ignore whether any high-velocity motions are present. High dispersion spectroscopy of N76 would thus be valuable in order to better understand this peculiar object.
Fig. 5. Upper part: FORS continuum subtracted Hα and [O ]
images of SMC N76A (or DEM S 123). Bottom part: [O ]/Hα ratio and image taken with the continuum filter centered on 6665 Å. The images are 32′′×32′′. North is up and East to the left. Contrary to the other figures of this paper, the greyscale is a linear scale, not a square root scale.
We select spectra from five regions, avoiding the bright-est stars, for further detailed invbright-estigation (Fig. 2): three cover the central He emission region (W1, 49′′long; E1, 14′′long; and E2, 38′′long), while the other two explore the outer parts of the nebula where He is barely visible but not measurable (W2, 78′′long and E3, 36′′long). The extinction-corrected line ratios for these regions are listed in Table 2. In the same way as for BAT99-49, we then derived temperatures, densities and abundances in these regions. No significant enrichment in he-lium can be detected for the He nebula but the oxygen abun-dance is at least 35% lower, and the N/O ratio is at least 40% higher than the SMC’s average values (Russell & Dopita 1990, see Table 3). Like in BAT99-2 and 49, this suggests a small enrichment by stellar winds, but in the case of N76, the nebula over which this enrichment is seen is much larger.
3.2.1. LMC N76A (or DEM S 123)
To the southeast of AB7 is situated N76 A (or DEM S 123, see Fig. 5), a bright Hα knot of radius ∼8′′similar to compact H regions such as N11A in the LMC (Heydari-Malayeri et al. 2001). Following Heydari-Malayeri et al. (2001 and references therein), these compact regions are created by massive stars just leaving their natal molecular cloud. The same authors also called this type of objects ‘High Excitation Blobs’ (HEBs). In N76A, one very bright star lies near the center of this nebula, and five others are situated closer to its periphery (see Fig. 5). Unfortunately, the spectral types of these stars are unknown and may be worth further investigation. The brightest region of N76A is situated just to the NE of the brightest star, whilst a region of suppressed brightness is directly symetrical to it with respect of the star. A diffuse envelope with few remarkable features surrounds the center of this nebula, and a dust lane borders it to the east.
As mentioned above, the [O ]/Hα ratio of N76A is much lower than that of its direct surroundings. It is actu-ally the lowest to the northern and eastern edges of the nebula ([O ]/Hα∼0.3), while it peaks to the southwest of the bright-est star ([O ]/Hα∼0.7). In a similar way as above, we bright-estimate the Hα and [O ] fluxes in an aperture of 8′′radius and find an observed L(Hα)∼ 1 × 1036 erg s−1 and an observed L([O ]
λ5007)∼ 6 × 1035 erg s−1 for a distance of 59 kpc. However, since the reddening of this region is not known, we thus cannot derive the actual luminosities. But the observed Hα luminos-ity can still be used to estimate the minimum requirement on the spectral type in the case of a unique ionizing star: it cor-responds to an ionizing flux of ∼7×1047ionizing photons s−1,
which can be explained by an O9V type star. Further investiga-tions should enable to find the reddening of the nebula and the exact nature of its embedded stars, but also to check the
pre-Fig. 7. FORS continuum subtracted Hα, [O ], He , and He
images of LMC N44C and its close surroundings. The images are 200′′×200′′. The upper white cross indicates the Star # 2 of Stasi´nska et al. (1986), and the lower one shows the position of Star # 1. North is up and East to the left.
dicted correlation between the [O ]/Hβ ratio and the Hβ flux for the HEBs (Heydari-Malayeri et al. 2001).
3.3. LMC N44C
N44C is a bright elongated Hα nebula some 53′′×65′′situated to the southwest of a superbubble blown by the OB association LH47 (see Fig. 6). Nebular He λ4686 emission was detected in N44C by Stasi´nska et al. (1986) who also provided the first spectra of this nebula. Examining a high dispersion Hα spec-trum of N44C, Goudis & Meaburn (1984) claimed to have dis-covered gas moving at −120 km s−1 in this nebula, but it was found later that this component was actually ‘only’ the He
λ6560 line (Garnett et al. 2000). Two bright stars in the center of N44C have been detected by Stasi´nska et al. (1986) and la-belled Star #2 for the northern one and Star #1 for the southern one. Star #2 is a rather hot O-type star while Star #1 is a cool G-K foreground star (Stasi´nska et al. 1986, Garnett et al. 2000). In the absence of high velocity motions or any very hot star, it was suggested that the He+ionization results from an intense X-ray source inside the nebula. Such a process is actu-ally seen at work around another object of the LMC, LMC X-1, and in this case, the He nebula is complex and very extended. If the X-ray source is transient, the high excitation may last for some time after the X-ray source has switched off. For N44C, the He nebula has been proposed to be a fossil X-ray nebula corresponding to the once recorded ray transient LMC X-5 (Pakull & Motch 1989a). An extensive study of N44C was recently presented by Garnett et al. (2000) who evaluated that He is currently recombining with a characteristic timescale of 20 yr. Since their spectrum was taken in 1991 and Stasi´nska’s in 1985, it was obviously interesting to monitor the evolution of the He emission ten to fifteen years later.
Images of N44C in the four nebular filters are presented in Fig. 7. The Hα and [O ] images have been described in length by Garnett et al. (2000) and we will not repeat the discussion here. The He image correlates perfectly with Hα, except for a slightly He depleted region where the He emission is the brightest. The He image presents a very bright arc north to Star #2 and a fainter, more extended emission. A close-up on the arc, whose radius is ∼6.5′′, is presented in Fig. 8. It seems to closely envelope the two stars. This arc does not correspond to any feature in the other nebular lines. On the contrary, the halo is as extended as the Hα nebula, and well correlated with it. However, an important part of this halo is actually made of [Ar ] emission: in the spectra, the observed [Ar ] λ4711 + He λ4713 blend can reach four times the intensity of the He
λ4686 line. In the rest of the field, emission in the He filter is spotted in N44B, N44H and in the superbubble. However, these features are most probably not due to a nebular He emission. In fact, our spectrum reveals a faint [Fe ] λ4658 line in the
su-Fig. 6. FORS Hα image of LMC N44. The different regions used for spectral analysis are marked by a solid line. Features
discussed in the text are labelled.
Fig. 8. Close-up on LMC N44C in the He λ4686 line (the
image is not continuum subtracted). Stars # 1 and 2 are clearly visible, as is a bright arc-like He emission region enveloping the Star # 2. Fainter, more extended emission also exists, but is more apparent on Fig. 7.
perbubble and Dufour (1975) detected [Fe ] λ4658 in N44B, although Stasi´nska et al. (1986) think that Dufour actually ob-served N44C, not B, and mistook He λ4686 for the [Fe ] line. Unfortunately, we do not have any information in the case of N44H’s emission, since our spectra do not cover this region. We choose six regions to further examine the physical prop-erties of the nebula and its surroundings (see Fig. 6): the He arc situated directly north of Star #2 (N1, 4.6′′long), the north-ern part of N44C (N2, 15′′ long), the region directly south of Star #1 (S1, 11′′ long), the southern part of N44C that seems composed of interlaced arcs (S2, 25′′ long), a filament just north of N44C which possesses an ionization closer to N44C than to the superbubble (N Fil., 5.2′′long), and finally the su-perbubble itself (Sup., 13′′ long). The dereddened line ratios of these six regions, together with the derived physical proper-ties, are presented in Table 4. The helium abundance is close to normal in all cases, except for the superbubble where it is rather low. The oxygen abundance is at most slightly smaller than normal, but the N/O ratio always reflects the LMC aver-age (see Table 3). No significant chemical enrichment is thus detected for this nebula.
We estimate the Hα and He fluxes by calibrating the cor-responding images with our spectrophotometry. For the whole Hα nebula (53′′×65′′), we derived a Hβ luminosity of 9×1036
erg s−1 after a reddening correction A
V = 0.55 mag and for a
distance of 50kpc. Note that the Hβ luminosity given in Garnett et al. (2000) is an order of magnitude larger than this value. However, this is most probably a typographical error: Garnett
et al. (2000) quote a reddening-corrected Hβ flux of 3×10⁻¹⁰
erg cm−2 s−1 for the sole N44C, while Caplan & Deharveng
(1985) give an observed flux of 1.1×10⁻¹⁰ erg cm−2 s−1 for
N44 B + C (N44B is more extended and as bright as N44C !). The analysis of the HST images used by Garnett et al. (2000) and several other calibrated Hα images of this nebula confirm our flux estimate3. Our Hβ luminosity corresponds to an ion-izing flux of 1.9×1049photons s−1. Due to the pollution by the
nebular lines and to possible abundance anomalies, the spectral type of Star #2 is uncertain. Pakull & Motch (1989a) proposed an O4-6 type, while Garnett et al. (2000) prefered ON7 III-V. The observed Q(H0) is a bit too large for a O7V star and would
better fit to a slightly earlier main sequence O-type star, but it is compatible with an O7III type. However, the magnitudes given in Stasi´nska et al. (1986) and Oey & Massey (1995) seem to favor a main sequence classification.
When trying to estimate the He flux, we discovered an ap-parent continuum emission to the north of Star #2 in our spec-tra. The He image thus actually contains He +[Ar ]+cont., and the pollution due to these additional components is larger where the He nebula is fainter. That is the reason why we choose to measure the He flux only in the brightest parts of the nebula, i.e. a region of radius 7′′comprising the bright arc. Therefore we may miss part of the He flux, but part of this er-ror is compensated by the contamination of [Ar ] + cont. We find L(He λ4686)= 4 × 1035 erg s−1and Q(He+) = 4 × 1047 photons s−1, after the reddening correction and for a distance of
50kpc. In the past, a few estimates of the He flux have been made: using the results of Stasi´nska et al. (1986), Garnett et al. (1991b) found L(He λ4686)= 6.3 × 1035erg s−1for a
dis-tance of 57 kpc (or 4.7 × 1035 erg s−1at a distance of 50kpc)
but their estimate was made considering a spherical geome-try, which is obviously not the case. This approximation could lead to a large overestimate of the flux, but since Stasi´nska et al. (1986) did not measure the I(He λ4686)/I(Hβ) in the brightest part of the He nebula, their result is probably not too far off. Using again Stasi´nska et al. (1986) measurements, Pakull & Motch (1989a) quote a lower value L(He λ4686) of 3 × 1035 erg s−1, after ‘taking into account an apparent error in Stasi´nska et al. (1986) paper’. Garnett et al. (2000) found
L(He λ4686)= 2.2 × 1035 erg s−1, which is lower than our
3 Most of the differences in L(4686)/L(β) between Garnett et al. (1991b) and Garnett et al. (2000) - which were discussed in length in the latter - can be explained by this error. Further discrepancies can be explained by the fact that neither the He nor the Hα nebula presents a spherical shape; that Stasi´nska et al. (1986) measured only the northern edge of the He nebula and that there may be an error in the Stasi´nska et al. (1986) paper (Pakull & Motch 1989a). We also note that our extinction AV=0.55 mag, corresponding to cβ= 0.26 and a color excess E(B − V) = 0.18 mag, is close to the average value found by Oey & Massey (1995). It is thus possible that the extinction AV= 0.25 mag of Garnett et al. (2000) actually refers to cβ. However, that fact alone can not explain the large discrepancy observed between the He fluxes.
value, but the region considered by these authors is not speci-fied clearly, and their He images, taken with the CTIO 0.9m telescope, probably did not reach a high signal/noise (the au-thors actually did not show the images). However, since we took our spectra with the same slit orientation as in Garnett et al. (2000), we can compare rather the I(He λ4686)/I(β) ratio. Garnett et al. (2000) quoted a value of 0.064±0.003, and we find 0.061±0.004 when considering like them the whole neb-ula, including Stars # 1 & 2. Furthermore, in a region similar and as close as possible to the position observed by Stasi´nska et al. (1986), we get similar results as these authors as well. We thus notice hardly any long-term change in the He emission.
Apparently, the He emission of N44C is still a puzzle. The ionizing star(s) in the vicinity cannot provide enough hard pho-tons and there is no high-velocity gas that could trace a shock capable of ionizing He+. The last hypothesis - a fossil X-ray nebula (Pakull & Motch 1989a) - implies a recombination of He , while we see no clear evidence for a change in the line intensity over the last 15 years. Recombination of [Ne ] and [Ne ] is also expected, but unfortunately, there are no lines of these ions in the wavelength ranges covered by our spectra. Pakull & Motch (1989a) estimated recombination timescales of 20 and 100 yr for [Ne ] and He , respectively. Garnett et al. (2000) favored smaller values, of 5 and 20 yr4. Since the
proposed associated X-ray source, LMC X-5, was observed in 1974-76 by OSO7 and Ariel V, we should detect a significant reduction of the He lines, even with a timescale as long as 100 yr. Apart from a fourth and still unknown ionizing mecha-nism, one possibility to explain the observations could be that the recombination timescale is much longer, thus that the den-sity in N44C is very low. Another could be that the mysterious X-ray source responsible of the ionization had recently turned on again, reionizing the nebula, but we note that Einstein data, a ROSAT pointing, and a recent Chandra observation of N44 do not reveal any source in the vicinity of N44C (Y.-H. Chu, private communication). It would be worth to follow the evo-lution of the He , [Ne ] and [Ne ] and X-ray emissions in the future, to determine the temporal behaviour of the nebula. The shape and the location of the He emission strongly sug-gest that the phenomenon is associated in some way with Star #2. Monitoring of this object should allow to detect signs of orbital motion, and thus the presence of the hypothetical com-pact companion needed for the fossil X-ray nebula scenario. However, we note that the 90% confidence error on the posi-tion of LMC X-5 is ∼0.3◦ while N44C lies at 0.5◦ from the X-ray source. We further note the absence of any evidence (in the X-ray or radio domains, by means of high velocity mo-tions or enhanced [S ]/Hα ratio) of a supernova explosion in the vicinity of Star #2 that could have given birth to a compact object.
4 However, we note that Garnett et al. (2000) were puzzled by the strength of the observed [Ne ] lines, incompatible with their short timescales.
4. WR survey
We have undertaken a small survey to search for He emis-sion around a few WR stars of the LMC. Similar surveys had previously been undertaken by Niemela et al. (1991) and Pakull (1991), mainly concentrating on WN stars. We chose seven other WR stars: BAT99-8, 9, 11, 52, 63, 84 and 134. None of them shows any sign of nebular He emission, de-spite the fact that Melnick & Heydari-Malayeri (1991) claimed to have found possible extended He emission around BAT99-9. However, BAT99-8, 11, 63 and 134 are known to present ring nebulae around them, and we study here their physical properties, which can help to determine the evolutionary sta-tus of the WR bubbles. Chu et al. (1999) have suggested that the large size and surface brightness variations of the nebulae around BAT99-11, 63 and 134 support the existence of some interactions with the ISM but also that their large expansion velocities and the rather regular expansion pattern show that they are not yet dominated by the ISM.
4.1. BAT99-8
BAT99-8 (Brey 8, Sk-6942, HD32257), a WC4 star (Bartzakos et al. 2001), is surrounded by a ring nebula of size 150′′×230′′ (Dopita et al. 1994). Two faint, arcuate filaments are visible to the north and southeast of the star. They are more easily distinguished from the background nebula in the [O ] lines. Unfortunately, no kinematic study of this candidate wind-blown bubble is available, and its exact nature and expansion status are still unknown. We have analysed the spectra of each arc (15′′ long for the northern one and 19′′ for the south-ern one), and we present in Table 5 their dereddened line ratios. No nebular He emission was detected in this nebula, but the spectra still allow us to derive an upper limit on the strength of the He emission by estimating the 3σ level at the position of He λ4686. This leads to F(He λ4686)/F(Hβ)<0.007 in the most restrictive case, i.e. the one that gives the lowest upper limit. Assuming a geometry composed of two partial rings of uniform brightness (a quarter of a ring of radius 65′′ and width 7′′, plus one eighth of a ring of radius 111′′ and width 7′′, see the morphology of the Hα nebula on Fig. 1c of Dopita et al. 1994), a distance of 50 kpc and a reddening AVof
0.4 mag, we then find an upper limit on the ionization power of log[Q(He+)] < 45.3.
The faintness of the [O ] lines renders the determination of the temperature of the nebula rather difficult: in our sample, such weakness of the [O ] λλ 4959, 5007 lines compared to Hβ is only seen for the N44 superbubble. That may suggest a temperature of 10 kK for this nebula. Such a low temperature is further supported by the rather strong [O ], [S ] and [N ] lines. For this temperature, we found only an oxygen abun-dance slightly higher than the LMC average. Higher temper-atures of 12.5 kK or 15 kK could lead to significant departures from average, with a low oxygen abundance and a quite high N/O ratio, but such a temperature appears less probable.
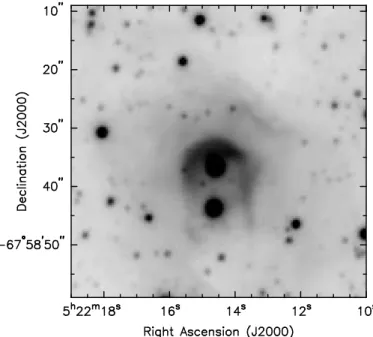
Table 4. Same as Table 2 for LMC N44C. N1 N2 S1 S2 N Fil. Sup. [Fe ] 3712 9.1 (1.) [O ] 3727 91 (9) 220 (23) 199 (21) 353 (37) 547 (57) 486 (51) H12 4. (0.4) 3.7 (0.4) 4.7 (0.5) 4.9 (0.5) 4.6 (0.5) 5.6 (0.6) H11 4.8 (0.5) 4.6 (0.5) 6.2 (0.6) 5.9 (0.6) 6.3 (0.7) 6.4 (0.7) H10 5.9 (0.6) 5.8 (0.6) 7.4 (0.8) 7. (0.7) 6.8 (0.7) 6.1 (0.6) H9 7.5 (0.8) 7.8 (0.8) 8.8 (0.9) 9. (0.9) 8.3 (0.8) 8.1 (0.8) [Ne ] 3868 63 (6) 73 (7) 59 (6) 56 (6) 65 (6) 11 (1) H8 + He 19 (2) 21 (2) 20 (2) 20 (2) 19 (2) 20 (2) [Ne ] + Hǫ 35 (3) 39 (4) 34 (3) 35 (3) 35 (3) 22 (2) He 4026 2.1 (0.2) 2.2 (0.2) 1.7 (0.2) 1.7 (0.2) 1.8 (0.2) 1.3: [S ] 4068 1.3 (0.1) 2.7 (0.3) 2.4: 4. (0.4) 6.7 (0.6) 4.3: [S ] 4076 0.4 (0.2) 0.5 (0.2) 0.6 (0.1) 1. (0.2) Hδ 29 (3) 29 (3) 30 (3) 30 (3) 29 (3) 29 (3) Hγ 50 (4) 50 (4) 50 (4) 50 (4) 50 (4) 50 (4) [O ] 4363 7.4 (0.6) 7.3 (0.6) 6.7 (0.5) 4.9 (0.4) 5.5 (0.4) 0.8 (0.2) He 4389 0.4 (0.2) 0.5 (0.3) He 4471 3.6 (0.3) 4.4 (0.3) 3.8 (0.3) 3.7 (0.3) 4.1 (0.3) 3.6 (0.3) He 4542 0.4 (0.2) He 4686 14 (0.1) 0.45 (0.03) 4.3 (0.3) 1.7 (0.1) [Ar ] 4711a 3.3 (0.3) 1.2 (0.1) 1.4 (0.1) [Ar ] 4740 2.5 (0.2) 1. (0.2) 1.2 (0.1) Hβ 100. 100. 100. 100. 100. 100. He 4922 0.9 (0.2) 1.1 (0.1) 1.1 (0.1) 1. (0.2) 1.1 (0.1) 1.6: [O ] 4959 242 (17) 250 (18) 217 (15) 178 (13) 161 (11) 36 (3) [Fe ] 4986 2.2 (0.2) [O ] 5007 719 (51) 747 (53) 649 (46) 534 (38) 478 (34) 108 (8) [N ] 5198+5200 0.2 (0.1) 0.6 (0.1) 1. (0.2) 2. (0.2) 1.: He 5412 1.1 (0.1) 0.7 (0.1) [Cl ] 5517 0.4 (0.2) 0.5 (0.1) 0.6 (0.1) 0.6: [Cl ] 5538 0.3 (0.1) 0.4 (0.2) 0.5 (0.1) 0.5: [N ] 5755 0.13 (0.07) 0.3 (0.2) 0.5 (0.1) 0.7 (0.1) He 5876 10 (1) 12 (1) 10 (1) 10 (1) 9.8 (0.8) 9.3 (0.1) [Fe ] 6096 1.5 (0.1) [O ] 6300 1.9 (0.2) 6.8 (0.7) 3.9 (0.4) 8.4 (0.8) 14 (1) 4.1 (0.4) [S ] 6312 1.4 (0.1) 1.9 (0.2) 1.6 (0.2) 1.9 (0.2) 2. (0.2) 1. (0.1) [O ] 6363 0.8 (0.2) 2.4 (0.2) 1.4 (0.1) 2.9 (0.3) 4.8 (0.5) 1.8 (0.2) [N ] 6548 2. (0.2) 5.2 (0.5) 5. (0.5) 8.7 (0.9) 14 (1) 13 (1) Hαa 282 (28) 282 (28) 282 (28) 282 (28) 282 (28) 286 (29) [N ] 6583 6.5 (0.7) 16 (2) 16 (2) 27 (3) 42 (4) 38 (4) He 6678 2.9 (0.3) 3.3 (0.3) 2.9 (0.3) 2.7 (0.3) 2.8 (0.3) 2.6 (0.3) [S ] 6716 8.9 (0.9) 22 (2) 24 (3) 42 (4) 58 (6) 51 (5) [S ] 6731 7. (0.7) 17 (2) 17 (2) 30 (3) 42 (4) 36 (4) F(Hβ) (10−14erg cm−2s−1) 18 23 8.4 13 1.7 2.4 AV(mag) 0.58 0.60 0.52 0.53 0.48 0.43 Te[O ] (kK) 11.7±0.4 11.5±0.4 11.7±0.4 11.3±0.4 12.2±0.4 10.5±0.9 Te[S ] (kK) 11.8±2. 9.9±1. 8.3±0.4 9.3±0.8 Te[N ] (kK) 12±5 12±4 11.4±1.4 10.7±1.1 ne[S ] (cm−3) <420 <410 <260 <250 <270 <240 ne[Ar ] (cm−3) <2400 <5400 600-3600 4.2. BAT99-11
The nebula surrounding BAT99-11 (Brey 10, Sk-6815, HD32402), a WC4 star (Bartzakos et al. 2001), was discovered quite a long time ago by Chu (1981). It has an elliptical shape of size 180′′×112′′and its surface brightness is far from uniform, with the southwestern region being the brightest (Dopita et al. 1994). A kinematic study reveals that this nebula corresponds
to a shell expanding into a quiescent H region with a velocity of ∼42 km s−1(Chu et al. 1999). We have examined the spectra of both sides of the nebula (29′′ for the SW arc and 48′′ for the NE one), and present their line ratios in Table 5. As above, we estimated upper limits on the strength of the He emis-sion of this nebula and find F(He λ4686)/F(Hβ)<0.002 in the most restrictive case. Assuming an elliptical ring geometry
Table 4. Continued. (He+/H+×102)b 7.7±0.5 9.±0.6 7.9±0.3 7.6±0.4 7.9±0.3 6.9±0.3 He2+/H+×102 1.2±0.2 0.038±0.003 0.55±0.08 0.14±0.01 →He/H×102 8.9±0.5 9.1±0.6 8.4±0.3 7.7±0.4 7.9±0.3 6.9±0.3 O0+/H+×106 2.4±0.3 8.3±0.6 4.5±0.2 11±1 14±1 7.9±0.5 O+/H+×105 1.8±0.2 4.7±0.5 4.±0.4 8.±0.8 9.3±1. 15±2 O2+/H+×104 1.5±0.1 1.7±0.1 1.4±0.1 1.2±0.1 0.89±0.04 0.32±0.03 →O/H×104 2.±0.1 2.2±0.1 1.9±0.1 2.2±0.1 2.0±0.1 1.9±0.2 N0+/H+×107 0.84±0.04 2.3±0.5 3.8±0.8 5.9±0.5 N+/H+×106 0.84±0.16 2.2±0.4 2.±0.1 3.9±0.3 4.6±0.4 6.5±0.5 (→ N/O×102)a 4.7±1. 4.8±0.9 5.2±0.6 5.3±0.7 4.9±0.6 4.4±0.6 (S+/H+×107)c 2.6±0.2 5.9±0.4 6.7±0.5 10±1 13±1 16±1 S2+/H+×106 1.8±0.2 2.6±0.3 2.1±0.2 2.8±0.3 2.2±0.2 2±0.2 Ar3+/H+×107 3.4±0.2 1.3±0.2 1.3±0.1 Ne2+/H+×105 3.8±0.4 4.7±0.5 3.6±0.4 3.9±0.4 3.4±0.3 0.96±0.10 Cl2+/H+×108 2.4±0.9 3.6±1. 4.5±0.7
aSame remarks as in Table 2.
bTo derive this abundance, the weigth of the fainter He λ 4026, 4389 and 4922 lines was reduced to 0.5. cTo derive this abundance, the weigth of the [S ] λ 4076 line was reduced to 0.5.
(111′′×183′′for the size of the external ellipse, and 85′′×144′′ for the internal one) and a reddening AVof 0.58 mag, we then
find log[Q(He+)] < 46.2.
The large temperature derived for the fainter northeastern region is probably due to the rather low S/N in the [O ] λ 4363 line, and is thus to consider with caution. The most reli-able abundances, derived for the brightest side of the nebula, only show O/H and N/O values slightly lower than the LMC values. Similar results are found for the NE region when us-ing the temperature of the SW one, whilst a normal helium abundance and N/O ratio, but a very low oxygen abundance are found for the higher temperature derived from the [O ] lines. Like for BAT99-2, we may be observing a circumstellar bubble merging with the interstellar one.
4.3. BAT99-63
A fine filamentary ring nebula, some 65′′×88′′ in size, sur-rounds the star BAT99-63 (Brey 52, classified WN4ha: in Foellmi et al. 2003b). The southwestern part of the ring is the faintest, while the northeastern region is much brighter. The analysis of the kinematics of this nebula suggests a blis-ter structure, with an expansion velocity of ∼50 km s−1 in the
low density ISM (Chu et al. 1999). We studied the spectrum of the brightest region, situated to the NE of the star (62′′ long, see Table 5). Using the same method as for BAT99-8 and 11, we find an upper limit on the He emission of F(He
λ4686)/F(Hβ)<0.006 in the most restrictive case. Assuming an elliptical ring geometry (80′′×70′′and 58′′×45′′for the sizes of the external and internal ellipses, respectively) and a reddening
AVof 0.4 mag, we then find log[Q(He+)] < 45.4. Even if the
oxygen abundance might be slightly larger than the LMC aver-age, no significant chemical enrichment can be detected in this nebula, favoring the hypothesis of an interstellar bubble already dominated by the ISM.
4.4. BAT99-134
A beautiful ring nebula of size 87′′×107′′ (Dopita et al. 1994) completely surrounds BAT99-134 (Brey 100, Sk-67268, HD270149), a WN4b star (Foellmi et al. 2003b). Its southeast-ern side is brighter, and the WR star appears largely decentred. Using high dispersion spectra, Chu (1983) detected an expan-sion velocity of 45-50 km s−1in this nebula. The same author
proposed that it is actually a small shell expanding on the sur-face of a molecular cloud. She further suggested that the mo-tion of the WR star, probably originally formed on the cloud’s surface, had caused the offset. We decided to analyse four re-gions in this nebula: the first and second sample the NE and SW part of the ring (18′′and 15′′long, respectively), the third covers the region situated between the star and the SW arc (47′′ long), and the last one studies the H region beyond the SW arc (46′′ long), that belongs to a larger shell unrelated to the WR wind-blown bubble. Compared to the LMC average values, the regions of the nebula closer to the star and the NE arc appear slightly enriched in helium and depleted in oxygen. The N/O ratio is also generally larger. These abundance differences fit well the Chu (1983) model: the southwesternmost part of the wind-blown bubble and the outer H region actually belong to the molecular cloud’s edge, and should thus present normal abundances.
Using the same method as above, we find an upper limit on the He emission of F(He λ4686)/F(Hβ)<0.007 in the most restrictive case. Assuming an elliptical ring geometry (80′′×100′′and 66′′×79′′for the sizes of the external and inter-nal ellipses, respectively) and a reddening AVof 0.3 mag, we
then find log[Q(He+)] < 45.5.
4.5. WR stars and nebular He
emission : discussionUp to now, only 3 WR stars of the MCs are known to display nebular He emission: BAT99-2, 49 and AB7, while 32 others (BAT99-5, 6, 8, 9, 11, 12, 15, 19, 29, 31, 32, 36, 38, 43, 52, 53,
56, 59, 60, 62, 63, 64, 81, 82, 84, 92, 94, 123, 124, 126, 132 and 134, Pakull 1991, Niemela 1991, and this paper) have none. For LMC WC4 stars, including our studied cases of BAT99-8, 9, 11 and 52, Gr¨afener et al. (1998) and Crowther et al. (2002) estimated temperatures T⋆ of ∼85-100 kK. Following the models of Smith et al. (2002), this would not produce any detectable He nebula since Q(He+) < 2 − 5 × 1040 photons
s−1 for T
⋆ ≤100 kK WC stars at Z = 0.2 − 0.4 Z⊙. The non dectection and/or upper limits of the He λ4686 line around the aforementioned WC4 stars agree thus completely with the latest models.
However the situation appears more complex for WN stars. The WN2 star BAT99-5 has a spectrum almost identical to BAT99-2 (Foellmi et al. 2003b), but no He emission was detected in its surroundings (F(He λ4686)/F(Hβ)<0.04 in Pakull 1991). Hamann & Koesterke (2000) fitted the spec-trum of BAT99-5 with a temperature of 71 kK, a value too low to produce enough He+ionizing photons. We note how-ever that in the case of the Galactic WN2 star, WR2, Hamann & Koesterke (1998) found T⋆ = 141 kK, a temperature much larger than for BAT99-5. This is rather remarkable since the average temperature of all other WN subtypes is rather simi-lar in the Galaxy and the LMC (Hamann & Koesterke 1998, Hamann & Koesterke 2000, Crowther et al. 1995a, Crowther et al. 1995b, Crowther & Smith 1997), though with a large scatter in both cases. Logically, using all information available, both stars, BAT99-2 and 5, or none of them should exhibit nebular He emission.
Large discrepancies are also seen amongst WN4 stars. Hamann & Koesterke (2000) found temperatures of 71 to 100 kK for the LMC WN4 stars : the hottest of these stars should thus be capable of ionizing He+. For example, BAT99-94 (Brey 85) has a temperature of 100 kK, but yet no neb-ular He was ever detected around this star (Niemela et al. 1991), contrary to BAT99-49. Moreover, the WN3 stars should in principle be hotter than the WN4 stars, but no nebular He emission has been detected around BAT99-62 and 82 (F(He
λ4686)/F(Hβ)<0.03 and 0.007, respectively, in Pakull 1991, Niemela et al. 1991).
Finally, we note that in the remaining cases of He neb-ulae excited by WR stars (WR102 in the Galaxy, IC1613#3 in IC1613), these stars present a WO spectral type. However, near the only WO star of the LMC, BAT99-123 (Brey 93), no neb-ular He emission was detected (F(He λ4686)/F(Hβ)<0.07 in Pakull 1991). Even in the case of the largest concentration of hot stars in the LMC, i.e. in the 30 Doradus complex, no nebular He emission was ever reported.
BAT99-2, 49 and AB7 seem thus different from all other WR stars of the MCs, but we find no particular reason for this uniqueness in the available data. Up to now, only 3 He+ excitation mechanisms have been proposed: high velocity shocks -but we are not aware of any peculiar motions near these objects; X-ray ionization - but no bright X-ray source was ever recorded in the close neighbourhood of any of these stars; photoioniza-tion - but then why would these stars differ from (very) similar WN stars of the same Galaxy? Could binarity play a role? AB7 and 49 indeed have massive companions, but BAT99-2 appears single (Foellmi et al. BAT99-2003b). Could they be mainly
fossil He nebulae? Long-term monitoring of both the nebulae and the stars would be required to unveil the signs of recombi-nation as well as the orbital motion due to the presence of a pu-tative compact companion in a wide eccentric orbit. However, up to now, only the visible spectrum of these peculiar stars is well studied, but the latter constitutes only a small part of the hot stars’ radiation. The UV and X-ray fluxes of the WR stars of the MCs should be investigated deeply, since these peculiar stars may present particular features in these energy ranges.
5. Conclusion
In this paper and a previous letter (Paper I), we investigate the relations between hot stars of the MCs and their environment. We first focus on the peculiar He nebulae ionized by WR stars. We provide here the first high quality He λ4686 im-ages of these high excitation nebulae. The He nebula around BAT99-49 appears more extended but also fainter than the one associated with BAT99-2. The high excitation nebula inside N76 occupies a size of roughly half the one of the Hα nebula. It is centered on the WR star AB7. Once calibrated, the images enable us to estimate the He+ionizing fluxes. For BAT99-2 and 49, we found Q(He+) of 4 and 1×1047photons s−1, respectively.
In the latest theoretical models, this corresponds to 90-100 kK WN stars. AB7 apparently emits Q(He+) = 5 × 1048 photons
s−1, and no recent model could explain such a high value. In
ad-dition, after comparing these objects to other WR stars of the MCs, we find no particular reason for their uniqueness: other very similar stars do not present such high excitation features.
In this study, we also used FORS spectroscopy to search for He emission around seven other WR stars: BAT99-8, 9, 11, 52, 63, 84 and 134. We do not find any new He neb-ula, even near BAT99-9 where hints of nebular He emission had been found in a previous study. These data enable us to analyse the physical properties of the above nebulae and also of the ring nebulae associated with BAT99-8, 11, 63 and 134. The abundance determinations show only small chemical en-richment for the nebulae around BAT99-2, 49, 100 and AB7. The slightly larger N/O and the slightly lower oxygen abun-dance are incompatible with a single circumstellar bubble, but could be explained in a scenario where the circumstellar bubble blown by the WR star is currently merging with the interstel-lar bubble blown by its progenitor. In contrast, N44C and the nebulae associated with BAT99-8 and 63 present normal abun-dances, suggesting ISM dominated bubbles.
We also examine a fourth He nebula of the MCs, N44C. It is thought to be a fossil X-ray nebula in which He should re-combine with timescales of 20-100 yr. Using our VLT data, we estimate L(Hβ)= 9 × 1036erg s−1and L(He λ 4686)= 4 × 1035 erg s−1. Comparing our data with older values, we find no sign of variation in the He λ4686 line strength. This puzzling re-sult indicates a much longer recombination timescale, and thus a very low density. Alternatively, another, unknown, ionizing mechanism could be at work. The X-ray source may also have turned on again some time in between the previous observa-tions and ours. Further monitoring is recommended to follow the possible evolution of the He and X-ray emissions, and also to search for traces of orbital motion in Star #2, and thus
1 2 N az ´e et al .: W R b u b b le s an d H e em is si o n
BAT99-8a BAT99-11 BAT99-63 BAT99-134
N S NEb SW NE NE near the star SW beyond SWc
[O ] 3727 752(78) 602 (63) 449 (47) 367 (38) 220 (23) 61 (6) 238 (25) 197 (21) 463 (48) H10 5.9 (0.6) H9 10 (1) [Ne ] 3868 12: 4.2 (0.4) 61 (6) 106 (10) 84 (8) 78 (8) 104 (10) H8 + He 15: 17 (2) 19 (2) 19 (2) 26 (3) 23 (2) 19 (2) 27: [Ne ] + Hǫ 24 (2) 13 (1) 16 (2) 27 (3) 41 (4) 37 (4) 42 (4) 40 (4) Hδ 29 (3) 24: 27 (2) 28 (3) 33 (3) 36 (3) 32 (3) 28 (3) 30 (3) Hγ 46 (4) 41 (3) 50 (4) 51 (4) 49 (4) 51 (4) 48 (4) 51 (4) 50 (4) [O ] 4363 4.9 (0.4) 3.7 (0.3) 5.1 (0.4) 19 (2) 12 (1) 10 (1) He 4471 4.1 (0.3) 4.1 (0.3) 5.4 (0.4) 3.9: Hβ 100. 100. 100. 100. 100. 100. 100. 100. 100. [O ] 4959 61 (4) 60 (4) 78 (6) 132 (9) 237 (17) 415 (29) 284 (20) 296 (21) 256 (18) [O ] 5007 177 (13) 184 (13) 233 (17) 393 (28) 710 (51) 1246 (89) 846 (60) 890 (63) 770 (55) He 5876 9.: 12: 12 (1) 13 (1) 13 (1) 13 (1) 15 (1) 11 (1) 12 (1) [S ] 6312 1.9 (0.2) 2.3 (0.2) [N ] 6548 21 (2) 20 (2) 7.8 (0.8) 5.7 (0.6) 6. (0.6) 9.1 (0.9) 5.1 (0.5) 12 (1) Hα 286 (29) 286 (29) 279 (28) 282 (28) 286 (29) 282 (28) 282 (28) 282 (28) 282 (28) [N ] 6583 52 (5) 45 (5) 26 (3) 19 (2) 19 (2) 4.9: 23 (2) 17 (2) 40 (4) He 6678 2.7 (0.3) 3.1 (0.3) 2.7 (0.3) 4.: 3.6: [S ] 6716 87 (9) 72 (7) 20 (2) 13 (1) 24 (2) 6.5: 34 (4) 25 (3) 61 (6) [S ] 6731 65 (7) 56 (6) 15 (2) 9.4 (1.) 17 (2) 8.0: 25 (3) 18 (2) 43 (4) F(Hβ) (10−14erg cm−2s−1) 0.85 0.44 4. 8.7 4.1 0.64 1.2 0.86 1. AV(mag) 0.48 0.28 0.59 0.58 0.35 0.28 0.22 0.34 0.34 Te[O ] (kK) 15.6±0.8 11.4±0.4 10.4±0.3 13.6±0.6 13.1±0.6 12.1±0.5 ne[S ] (cm−3) <320 <410 <380 <300 <280 <290 <270 <260 He+/H+×102 6.5: 8.6: 8.3±0.4 8.9±0.5 8.9±0.4 10.±0.9 11±0.5 8.5±0.7 8.8±0.8 O+/H+×105 28±3 23±2 3.4±0.4 8.±0.8 7.±0.7 7.1±0.7 3.1±0.3 3.5±0.4 7.2±0.8 O2+/H+×105 6.3±0.4 6.3±0.3 2.2±0.1 9.±0.4 22±1 17±1 13±1 17±1 13±1 →O/H×104 3.5±0.3 2.9±0.2 0.56±0.04 1.7±0.1 2.9±0.1 1.8±0.1 1.6±0.1 2.±0.1 2.±0.1 N+/H+×106 11±1 10±1 1.8±0.1 2.5±0.2 3.2±0.2 0.5: 2.6±0.2 1.9±0.1 4.4±0.3 (→ N/O×102)d 3.9±0.5 4.6±0.6 5.3±0.7 3.2±0.4 4.6±0.6 6.6: 8.2±1. 5.6±0.7 6.1±0.8 S+/H+×107 35±3 30±2 3.2±0.2 3.8±0.3 8.7±0.6 1.8: 7.4±0.5 6.4±0.5 15±1 S2+/H+×106 2.8±0.3 4.8±0.5 Ne2+/H+×105 1.3: 0.28±0.03 5.7±0.6 3.9±0.4 3.5±0.3 4.2±0.4 5.±0.5 aAssuming T e= 10 kK.
bAbundances shown below were derived for T
e= T ([O ])= 15.6 kK.
cAssuming T
e= 12.5 kK (close to the temperatures of the neighbouring regions).
of a companion that wculd be responsible for the episodic X-ray emission as required by the fossil X-X-ray nebula scenario. Acknowledgements. We acknowledge support from the PRODEX XMM-OM and Integral Projects and through contracts P4/05 and P5/36 ‘Pˆole d’attraction Interuniversitaire’ (Belgium). We thank the referee, Dr M. Heydari-Malayeri, for his useful suggestions.
References
Bartzakos, P., Moffat, A.F.J., & Niemela, V.S. 2001, MNRAS, 324, 18 Benjamin, R.A., Skillman, E.D., & Smits, D.P. 1999, ApJ, 514, 307 Bica, E.L.D., Schmitt, H.R., Dutra, C.M., & Oliveira, H.L. 1999, AJ,
117, 238
Bouchet, P., Lequeux, J., Maurice, E., Pr´evot, L., & Pr´evot-Burnichon, M.L. 1985, A&A, 149, 330
Caplan, J., & Deharveng, L. 1985, A&AS, 62, 63
Cardelli, J.A., Clayton, G.C., & Mathis, J.S. 1989, ApJ, 345, 245 Chu, Y.-H. 1981, PhD thesis, University of California, Berkeley Chu, Y.-H. 1983, ApJ, 269, 202
Chu, Y.-H., Weis, K., & Garnett, D.R. 1999, AJ, 117, 1433 Crowther, P.A., Hillier, D.J., & Smith, L.J. 1995a, A&A, 293, 403 Crowther, P.A., Hillier, D.J., & Smith, L.J. 1995b, A&A, 302, 457 Crowther, P.A., & Smith, L.J. 1997, A&A, 320, 500
Crowther, P.A., Dessart, L., Hillier, D.J., Abbott, J.B., & Fullerton, A.W. 2002, A&A, 392, 653
Dopita, M.A., Bell, J.F., Chu, Y.-H., & Lozinskaya, T.A. 1994, ApJS, 93, 455
Dopita, M.A., & Hua, C.T. 1997, ApJS, 108, 515 Dufour, R.J. 1975, ApJ, 195, 315
Fitzpatrick, E.L. 1989, IAUS, 135, 37
Foellmi, C., Moffat, A.F.J., & Guerrero, M.A. 2003a, MNRAS, 338, 360
Foellmi, C., Moffat, A.F.J., & Guerrero, M.A. 2003b, MNRAS, 338, 1025
Garc´ıa-Segura, G., Langer, N., & MacLow, M.-M. 1996, A&A, 316, 133
Garnett, D.R., Kennicutt, R.C.Jr., Chu, Y.-H., & Skillman, E.D. 1991a, PASP, 103, 850
Garnett, D.R., Kennicutt, R.C.Jr., Chu, Y.-H., & Skillman, E.D. 1991b, ApJ, 373, 458
Garnett, D.R., Galarza, V.C., & Chu, Y.-H. 2000, ApJ, 545, 251 Goudis, C., & Meaburn, J. 1984, A&A, 137, 152
Gr¨afener, G., Hamann, W.-R., Hillier, D.J., & Koesterke, L. 1998, A&A, 329, 190
Hamann, W.-R., & Koesterke, L. 1998, A&A, 333, 251 Hamann, W.-R., & Koesterke, L. 2000, A&A, 360, 647
Heydari-Malayeri, M., Charmandaris, V., Deharveng, L., Rosa, M.R., Schaerer, D., & Zinnecker, H. 2001, A&A, 372, 527
Massey, P., Waterhouse, E., & Degioia-Eastwood, K. 2000, AJ, 119, 2214
McCall, M.L., Rybski, P.M., & Shields, G.A. 1985, ApJS, 57, 1 Melnick, J., & Heydari-Malayeri, M. 1991, IAUS, 143, 409
Naz´e, Y., Chu, Y.-H., Points, S.D., Danforth, C.W., Rosado, M., & Chen, C.-H.R. 2001, AJ, 122, 921
Naz´e, Y., Chu, Y.-H., Guerrero, M.A., Oey, M.S., Gruendl, R.A., & Smith, R.C. 2002, AJ, 124, 3325
Naz´e, Y., Rauw, G., Manfroid, J., Chu, Y.-H., & Vreux, J.-M. 2003, A&A, 401, L13 (paper I)
Niemela, V.S., Heathcote, S.R., & Weller, W.G. 1991, IAUS, 143, 425 Niemela, V.S., Massey, P., Testor, G., & Gim´enez-Ben´ıtez, S. 2002,
MNRAS, 333, 347
Oey, M.S., & Massey, P. 1995, ApJ, 452, 210
Oke, J.B. 1990, AJ, 99, 1621
Pakull, M.W., & Motch, C. 1989a, Nature, 337, 337
Pakull, M.W., & Motch, C. 1989b, Extranuclear Activity in Galaxies, eds. Meurs & Fosbury (Garching bei Munchen), 285
Pakull, M.W., & Bianchi, L. 1991, IAUS, 143, 260 Pakull, M.W. 1991, IAUS 143, 391
Russell, S.C., & Dopita, M.A. 1990, ApJS, 74, 93 Schaerer D. 1996, ApJ, 467, L 17
Shaw, R.A., & Dufour, R.J. 1995, PASP, 107, 896
Smith, L.J., Norris, R.P.F.,& Crowther, P.A. 2002, MNRAS, 337, 1309 Stasi´nska, G., Testor, G., & Heydari-Malayeri, M. 1986, A&A, 170,
L4
Storey, P.J., & Hummer, D.G. 1995, MNRAS, 272, 41 Tuohy, I.R., & Dopita, M.A. 1983, ApJ, 268, L11
Walborn, N.R. 2002, Hot Star Workshop III: The Earliest Stages of Massive Star Birth. ASP Conf. Proc. Vol. 267, ed. P.A. Crowther (San Francisco), 111
![Fig. 3. FORS continuum subtracted Hα, [O ], He , and He images of LMC BAT99-49 and its close surroundings](https://thumb-eu.123doks.com/thumbv2/123doknet/5445957.128224/4.918.466.816.237.291/fig-fors-continuum-subtracted-hα-images-close-surroundings.webp)
![Table 4. Same as Table 2 for LMC N44C. N1 N2 S1 S2 N Fil. Sup. [Fe ] 3712 9.1 (1.) [O ] 3727 91 (9) 220 (23) 199 (21) 353 (37) 547 (57) 486 (51) H12 4](https://thumb-eu.123doks.com/thumbv2/123doknet/5445957.128224/9.918.151.744.97.926/table-same-table-lmc-n-fil-sup-fe.webp)