THESE
Pour l’obtention du Grade de
DOCTEUR DE L’UNIVERSITE DE POITIERS
(Faculté des Sciences Fondamentales et Appliquées)
(Diplôme National - Arrêté du 7 août 2006)
Ecole Doctorale : Ingénerie Chimique, Biologique et Géologique
Secteur de Recherche : Chimie Théorique, Physique, Analytique
Présentée par :
Seden BEYHAN
************************
SYNTHÈSE ET CARACTÉRISATION DE NANOPARTICULES
POUR L’OXYDATION DE L’ETHANOL DANS UNE PILE À
COMBUSTIBLE
************************
Directeurs de Thèse:
Jean-Michel LEGER, Directeur de Recherche au C.N.R.S
Figen KADIRGAN, Professeur
************************
Soutenue le 10 mai 2010 devant la Commission d’Examen
************************
JURY
M. Pascal BRAULT
Professeur, Université d’Orléans
Rapporteur
Mme. Deborah JONES
Professeur, Université de Montpellier II
Rapporteur
M. Jean-Michel LEGER
Directeur de Recherche au C.N.R.S, Université de
Poitiers
Examinateur
Mme. Figen KADIRGAN
Professeur, Technique Université d’Istanbul
Examinatrice
M. Christophe COUTANCEAU Professeur, Université de Poitiers
Examinateur
M. Iskender GOKALP
Professeur, Université d’Orléans
Examinateur
THESE
Pour l’obtention du Grade de
DOCTEUR DE L’UNIVERSITE DE POITIERS
(Faculté des Sciences Fondamentales et Appliquées)
(Diplôme National - Arrêté du 7 août 2006)
Ecole Doctorale : Ingénerie Chimique, Biologique et Géologique
Secteur de Recherche : Chimie Théorique, Physique, Analytique
Présentée par :
Seden BEYHAN
************************
SYNTHESIS AND CHARACTERIZATION OF NANOPARTICLES
FOR ETHANOL OXIDATION IN DIRECT ETHANOL FUEL CELL
(DEFC)
************************
Directeurs de Thèse:
Jean-Michel LEGER, Directeur de Recherche au C.N.R.S
Figen KADIRGAN, Professeur
************************
Soutenue le 10 mai 2010 devant la Commission d’Examen
************************
JURY
M. Pascal BRAULT
Professeur, Université d’Orléans
Rapporteur
Mme. Deborah JONES
Professeur, Université de Montpellier II
Rapporteur
M. Jean-Michel LEGER
Directeur de Recherche au C.N.R.S, Université de
Poitiers
Examinateur
Mme. Figen KADIRGAN
Professeur, Technique Université d’Istanbul
Examinatrice
M. Christophe COUTANCEAU Professeur, Université de Poitiers
Examinateur
FOREWORD
This work was carried out at the Chemistry Department, Faculty of Science and Letters, Istanbul Technical University, and at the Chemistry Department, University of Poitiers in the period January 2007-2010. The French Government is gratefully acknowledged for the award of a scholarship within the program ―co-tutelle‖.
First and foremost, I would like to express my deepest appreciation to my supervisors, Prof. Figen Kadirgan at Istanbul Technical University and Prof. Jean-Michel Léger at University of Poitiers for their guidance and encouragement and especially for giving me the creative freedom to approach science throughout my PhD study.
I would like to thank to Prof. Christophe Coutanceau for assistance with fuel cell measurements and for his enthusiastic and useful advice regarding my research. I am gratefully indebted to Mr. Stéphane Pronier for being willing to help me wholeheartedly with TEM measurements, and for his suggestions.
I am very grateful to my parents and my brother for their endless love, belief and support that they always gave me throughout my educational journey. They were always behind me that made everything about me possible. I feel so blessed to have them as a strong foundation in all of my life.
March 2010 Seden BEYHAN
TABLE OF CONTENTS
Page
FOREWORD ... vii
TABLE OF CONTENTS ...ix
ABBREVIATIONS ...xi
LIST OF TABLES ... xiii
LIST OF FIGURES ...xv
SUMMARY ... xxi
RESUME DETAILLE ... xxiii
1. INTRODUCTION ... 1
1.1 Background ... 1
1.2 Principle of Direct Ethanol Fuel Cell (DEFC) ... 1
1.3 Literature Survey ... 4
1.3.1 Overview of active catalysts for ethanol oxidation ... 4
1.3.2 Mechanistic aspects of ethanol oxidation reaction ... 5
1.4 Purposes and Scope ...10
1.5 Structural Organization of Thesis ...11
2. SYNTHESIS AND PHYSICAL CHARACTERIZATION OF CARBON SUPPORTED ANODE CATALYSTS FOR DEFC ...13
2.1 Introduction...13
2.2 Experimental Section ...14
2.2.1 Catalysts preparation ...14
2.2.2 Physical characterization ...17
2.3 Results and Discussion ...19
2.3.1 XRD analysis ...19
2.3.2 EDX and XPS analysis ...24
2.3.3 TEM analysis ...32
2.4 Conclusion ...46
3. ELECTROCHEMICAL ACTIVITY AND STABILITY OF CARBON SUPPORTED ANODE CATALYSTS FOR ETHANOL OXIDATION IN DEFC ...49
3.1 Introduction...49
3.2 Experimental Section ...50
3.2.1 Preparation of electrode ...50
3.2.2 Electrochemical measurements ...50
3.2.3 Preparation of membrane electrode assemblies (MEAs) ...50
3.2.4 Direct ethanol fuel cell performance test ...51
3.3 Results and Discussions...52
3.3.1 Electrochemical characterization ...52
3.3.2 Direct ethanol fuel cell performance tests ...74
3.4 Conclusions ...77
4. IN-SITU FOURIER TRANSFORM (FTIR) SPECTROSCOPY STUDIES ON Pt/C, PtSn/C and PtSnM(M=Ni, Co, Rh, Pd)/C CATALYSTS FOR ETHANOL
4.2.1 Solutions, electrode and cell ... 80
4.2.2 Instrumentation ... 80
4.2.3 Methods ... 81
4.2.4 Preparation of electrodes ... 82
4.2.5 Adsorption and oxidation of ethanol, acetaldehyde and acetic acid ... 82
4.2.6 In-situ reflectance spectra of some expected bulk products of ethanol oxidation ... 83
4.3 Results and Discussion ... 84
4.3.1 SPAIR spectroscopic studies of the adsorption and oxidation of ethanol .. 84
4.3.2 SPAIR spectroscopic studies of the adsorbed intermediate species coming from ethanol ... 96
4.4 Conclusions ... 105
4.4.1 Interpretation of the mechanism for ethanol electrooxidation ... 107
4.4.2 A general mechanism of ethanol adsorption and oxidation ... 113
5. CONCLUSIONS AND RECOMMENDATIONS ... 117
5.1 General Conclusions ... 117
5.2 Recommendations ... 119
REFERENCES ... 121
ABBREVIATIONS
AA : Acetic Acid
AAL : Acetaldehyde
BE : Binding Energy
CV : Cyclic Voltammetry
DEFC : Direct Ethanol Fuel Cell DFT : Density Functional Theory EAS : Electrochemical Active Surface
EDS : Energy Dispersive X-ray Spectroscopy EDX : Energy Dispersive X-ray Analysis EOR : Ethanol Oxidation Reaction
EXAFS : Extended X-ray Absorption Fine Structure FTIR : Fourier Transform Infrared
FFT : Fast Fourier Transform GDL : Gas Diffusion Layer
HREELS : High Resolution Electron Energy Loss Spectroscopy HRTEM : High Resolution Transmission Electron Microscopy HPLC : High Performance Liquid Chromatography
ICDD : International Center Diffraction Data IMFP : Inelastic Mean Free Path
IR : Infrared
IRRS : Infrared Reflectance Spectroscopy
JCPDS : Joint Commission on Powder Diffraction Standards
LPSIRS : Linear Potential Sweep Infrared Reflectance Spectroscopy LSV : Linear Sweep Voltammetry
MEA : Membrane Electrode Assembly
NIST : National Institute of Standards and Technology OCV : Open-Circuit Voltage
PTFE : Politetrafloroetylene
RHE : Reversible Hydrogen Electrode
SNIFTIRS : Subtractively Normalized Interfacial Fourier Transform Infrared
Reflectance Spectroscopy
SPAIRS : Single Potential Alteration Infrared Reflectance Spectroscopy
THF : Tetrahydrofuran
TEM : Transmission Electron Microscopy
TON : Turnover Number
XRD : X-ray Diffraction
LIST OF TABLES
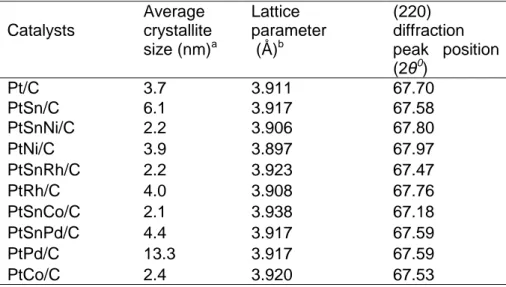
Page Table 2.1: X-ray diffraction data analysis of carbon supported Pt, bimetallic and ....22
trimetallic catalysts ...22
Table 2.2: Sn atomic fractions in the alloy as calculated by Vegard's law ...23
Table 2.3: The values of inelastic mean free paths (IMFPs) as a function of energy
for each element in the matrix, taken from Fig. 2.6. ...27
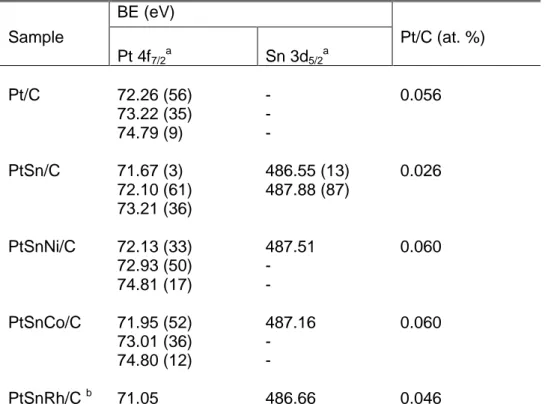
Table 2.4: Catalysts composition measured by EDX and XPS ...27 Table 2.5: XPS analysis of Pt/C, PtSn/C, PtSnNi/C, PtSnCo/C and PtSnRh/C
catalysts: Binding energies (eV) and Pt/C surface atomic ratios ...29
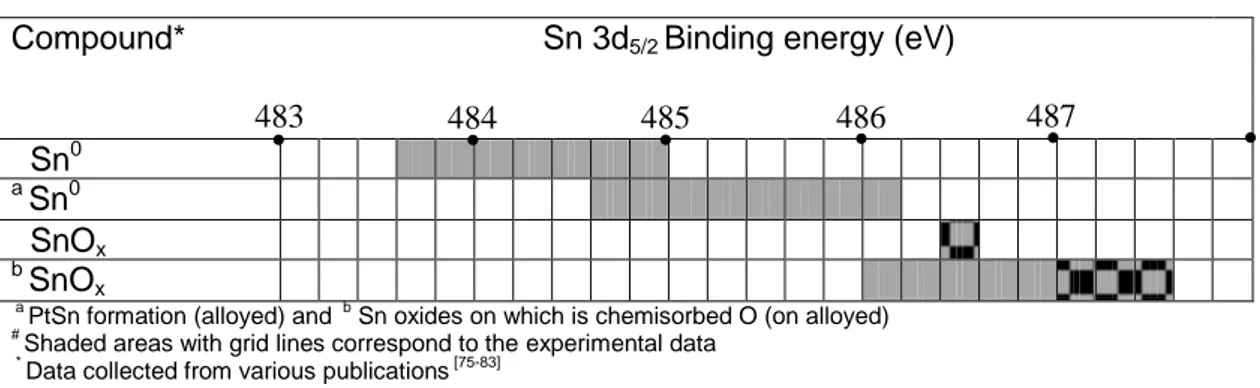
Table 2.6: Binding energy range of the Sn 3d5/2 level in the literature data ...32
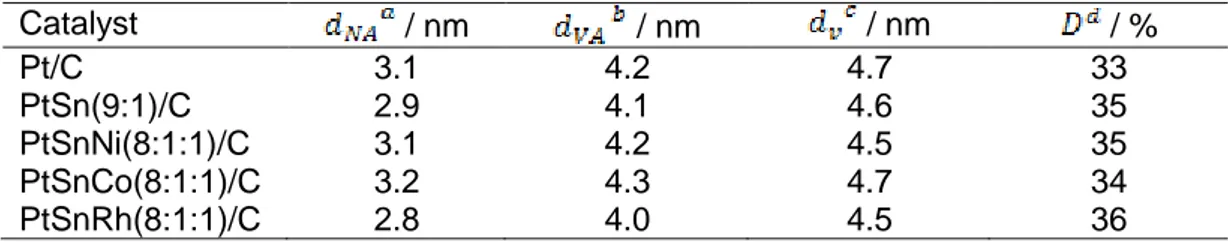
Table 2.7: The values of catalyst particle size and its dispersion, as determined by
TEM ...34
Table 2.8: Crystallographic data for Pt and Sn phases as adapted from ref. [93]....38 Table 2.9: Plane spacing of possible of metals and/or alloys as adapted from ref.
[93]. ...38
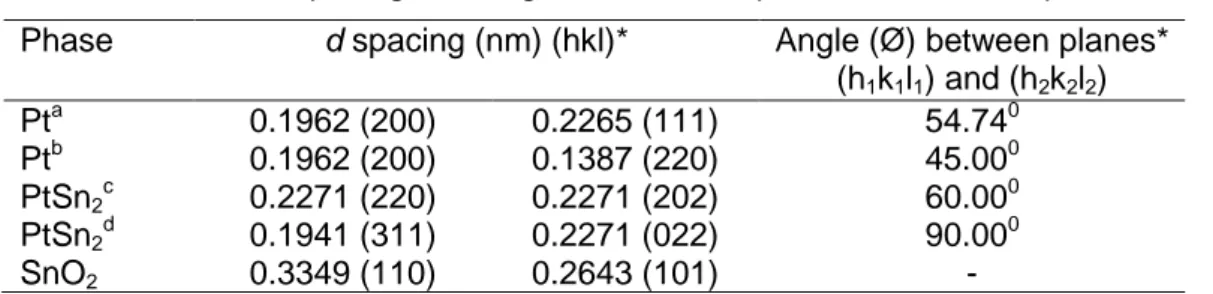
Table 2.10: Plane spacing with angle for the most probable interfacial phases ...39 Table 3.1: Comparison of hydrogen desorption charge, electrochemical active
surface area (EAS) and electrode roughness of various Pt-based catalysts. ...55
Table 3.2: Comparison of mass activity and onset potential for ethanol oxidation
reaction (EOR) of various Pt-based catalysts. ...57
Table 3.3: Possible shift in d-band centre and metal segregation for the elements of
Ni, Co, Pd and Rh in the trimetallic PtSnM (M=Ni, Co, Pd, Rh) alloys. ...59
Table 3.4: Variation of mass activity, specific surface area activity, turnover number
and poisoning rate of the Pt/C, PtSn/C, PtSnNi/C and PtSnCo/C catalysts as a function of potential. Values were taken from chronoamperometric
measurements in 0.1 M HClO4 + 1 M EtOH solution after 15 min.
polarization of potentials. ...70
Table 3.4: Continued ...71 Table 3.5: Atomic ratios determined from XPS data ...74 Table 3.6: Summary of performances of DEFCs Pt/C, PtSn/C and PtSnM(M=Rh, Pd,
Ni, Co)/C as anode catalysts ...76
Table 3.7: Comparison of ethanol concentration effect on DEFCs performance for
PtSnNi as the anode catalyst ...77
Table 4.1: Identification of different species and their band adsorption observed
LIST OF FIGURES
Page
Figure 1.1: Schematic presentation of a direct ethanol fuel cell. ... 2 Figure 2.1: A scheme used for the synthesis of colloidal nanoparticles. ...15 Figure 2.2: Scheme for stabilization of the metal core by NR4X as adapted from [16].
...16
Figure 2.3: Schematic illustration of the catalyst preparation procedure. ...17 Figure 2.4: (a) X-ray diffraction patterns of the PtSn(9:1)/C, PtCo(9:1)/C, tPd(9:1)/C,
PtRh(9:1)/C, PtNi(9:1)/C and Pt/C catalysts, (b) an expanded view of the (220) reflections of the fcc phase. ...21
Figure 2.5: (a) X-ray diffraction patterns of the PtSnPd(8:1:1)/C, PtSnNi(8:1:1)/C,
PtSnCo(8:1:1)/C and PtSnRh(8:1:1)/C catalysts (b) an expanded view of the (220) reflections of the fcc phase ...21
Figure 2.6: The illustrated model of the inelastic mean free paths [48-50], as a
function of energy for Pt80Sn10Ni10, Pt80Sn10Co10 and Pt80Sn10Rh10 catalysts. ...26
Figure 2.7: XPS spectra of Pt 4f7/2 level for (a) Pt/C, (b) PtSn/C, (c) PtSnNi/C and (d) PtSnCo/C catalysts ...30
Figure 2.8: XPS spectra of Sn 3d5/2 level for (a) PtSn/C, (b) PtSnNi/C and (c) PtSnCo/C catalysts ...31
Figure 2.9: (a) TEM image of Pt/C catalyst and (b) histogram of the Pt particle size
distribution ...35
Figure 2.10: TEM images of PtSn/C catalyst (scale bar: 20 and 500 nm,
respectively) (a) and (b), histogram of the PtSn particle size distribution (c). ...36
Figure. 2.11: TEM images and particle size distribution histograms of PtSnNi/C
catalyst (a) and (b), PtSnCo/C catalyst (c) and (d), PtSnRh/C catalyst (e) and (f). ...37
Figure 2.12: The single crystal spot transmission electron diffraction patterns for fcc
crystal structure. The crosses in one quadrant of the diagram indicate the positions of the spots for the ordered fcc (LI2) unit cell (zone axis is z, the beam direction is B, as indicated). ...39
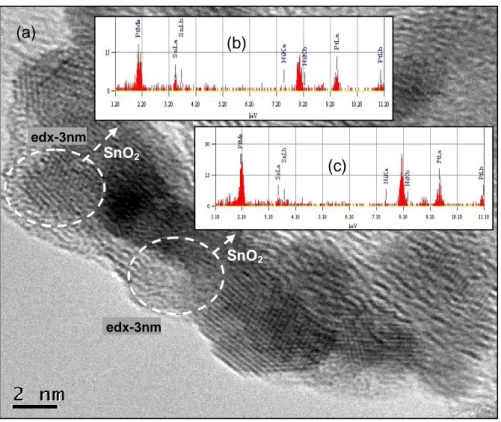
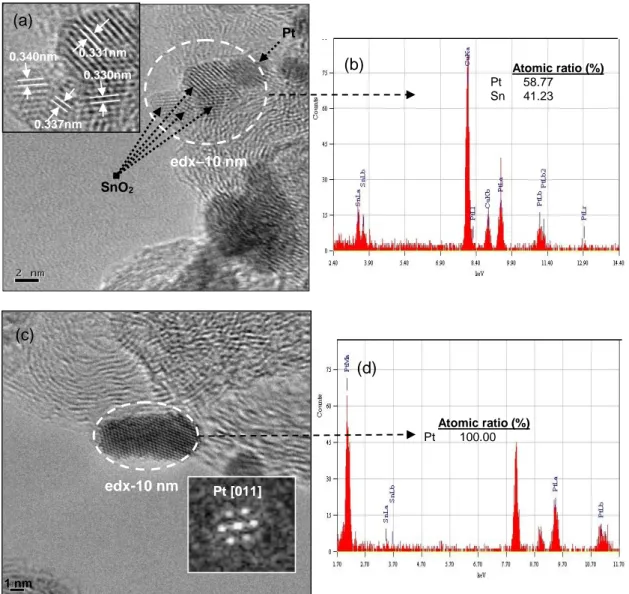
Figure 2.13: HRTEM analysis of PtSn/C catalyst (a and c), EDX analysis of the
selected areas using a 10 nm electron beam (b) and (d). ...41
Figure 2.14: HRTEM analysis of PtSn/C catalyst, showing likely core-shell Pt and
SnO2 structure (a) PtSn2 structures at [111] zone axis (b). ...42
Figure 2.15: (a) HRTEM analysis of PtSn/C catalyst, showing PtSn2 structures at [233] zone axis (b) EDX spectrum taken from the selected nanoparticle in the PtSn/C catalyst. ...43
Figure 2.16: HRTEM images of PtSnNi/C catalyst together with EDX analysis of
the selected areas, showing the particle has the Pt structure at [011]
zone axis (a) and the particle has the PtSn2 structure at [111] zone axis
Figure 2.18: HRTEM images of PtSnCo/C catalyst together with EDX analysis of
the selected areas, showing the particle has the PtSn2 structure at [111] zone axis (a) and the particle has the Pt structure at [011] zone axis. ... 45
Figure 2.19: HRTEM images of PtSnRh/C catalyst together with EDX analysis of
the selected areas, showing the particle has the SnO2 structure (a) and Pt structure (b) using a 5 nm electron beam and showing the presence of Pt, Sn and Rh in the nanocluster using a 10 nm electron beam (c). ... 46
Figure 2.20: A proposed structural model for trimetallic catalyst system (X = Ni, Co
and Rh) based on the EDX and XPS analysis. ... 47
Figure 2.21: A proposed model for carbon supported PtSnNi (a) and PtSn (b)
catalysts with the help of HRTEM, EDX and XPS analysis. ... 48
Figure 3.1: A schematic representation of the fuel cell compartment. ... 51 Figure 3.2: Cyclic voltammograms of Pt/C, PtNi/C, PtSn/C and PtSnNi/C
catalysts (a) Pt/C, PtCo/C, PtSn/C and PtSnCo/C catalysts (b), Pt/C, PtRh/C, PtSn/C and PtSnRh/C catalysts (c) and Pt/C, PtPd/C, PtSn/C
and PtSnPd/C catalysts (d) in 0.1 M HClO4 with a scan rate of
20mVs-1. ... 53
Figure 3.3: Linear sweep voltammograms for electrooxidation of 1M ethanol in
0.1 M HClO4(aq) on the (a) Pt/C and PtM/C(M=Sn, Rh, Pd, Ni, Co)
electrocatalysts (b) PtSn/C and PtSnM/C(M=Sn, Rh, Pd, Ni, Co) electrocatalysts. Scan rate: 1mVs-1, at room temperature. ... 56
Figure 3.4: Comparison of the mass-specific current densities for binary and ternary
PtSn-based catalysts in 0.1M HClO4 solution containing 0.1M EtOH (a, c) and 1M EtOH (b, d) at 0.5 V vs. RHE (v = 1mV.s-1). ... 58
Figure 3.5: Linear sweep voltammograms for electrooxidation of 0.1M acetaldehyde
in 0.1 M HClO4(aq) on the PtSn/C and PtSnM(M=Rh, Pd, Ni, Co)/C
electrocatalysts. Scan rate: 1mVs-1. ... 60
Figure 3.6: Cyclic voltammograms on Pt/C, PtM(M=Sn, Ni, Co)/C, PtSnM(M=Ni,
Co)/C electrodes obtained in N2 saturated 0.1M HClO4 solution at
20mVs−1. ... 61
Figure 3.7: Linear sweep voltammograms for electrooxidation of 1M ethanol in
0.1 M HClO4(aq) on the Pt/C, PtM/C(M=Sn, Ni, Co) and PtSnM/C(M=Sn,
Rh, Pd, Ni, Co) electrodes. Scan rate: 20mVs-1. ... 62
Figure 3.8: Potential step program used in the chronoamperometric experiments. 64 Figure 3.9: Comparison of chronoamperometric profiles measured on Pt/C, PtSn/C,
PtSnNi/C and PtSnCo/C electrodes in 0.1M HClO4 solution containing
1M ethanol. Electrode potential was stepped from 400 mV to 1000 mV vs. RHE and held constant for a 15 min at each 100 mV potential steps. ... 65
Figure 3.10: Potential step program used in the chronoamperometric experiments.
... 66
Figure 3.11: The obtained results from the potential sequence applied to the
different electrodes in 0.1M HClO4 solution containing 0.1M ethanol. 67
Figure 3.12: Cyclic voltammograms for Pt electrode in 0.1M HClO4 solution at a scan rate of 20 mV s-1. (a) The first cycle (solid line) before the chronoamperometric measurement and after holding at 300 mV for 45 min (dashed line). (b) The first cycle (solid line), after holding at 300 mV for 45 min and subsequently at 900 mV for 15 min (dashed line). ... 68
Figure 3.13: Chronoamperograms recorded on PtSnNi electrode at different
potentials in 0.1M HClO4 solution containing 1M ethanol. ... 69
Figure 3.14: Comparison of mass activity and poisoning rate evaluated in 0.1M
HClO4 solution containing 1M ethanol for Pt/C and PtSn(9:1)/C electrodes. Values were taken from the Table 3.4 ... 72
Figure 3.15: Comparison of mass activity and poisoning rate evaluated in 0.1M
HClO4 solution containing 1M ethanol for PtSn(9:1)/C, PtSnNi(8:1:1)/C (a) and
PtSn(9:1)/C, PtSnCo(8:1:1)/C (b) electrodes. Values were taken from the Table 3.4. ...72
Figure 3.16: Comparison of the turnover number and poisoning rate for Pt/C,
PtSn(9:1)/C, PtSnNi(8:1:1)/C and PtSnCo(8:1:1)/C electrodes in 0.1M
HClO4+1M EtOH solution. (a) and (c) at E= 0.4 V vs. RHE, (b) and (d) at E= 0.7
V vs. RHE, values were taken from the Table 3.2. ...73
Figure 3.17: Chronoamperometric profiles measured on Pt/C, PtSn/C, PtSnNi/C
and PtSnCo/C electrodes at 0.5 V vs. RHE for 1h in 0.1M HClO4 solution
containing 1M ethanol. Inset: Comparison of the stability of current density measured on PtSnNi/C electrode at 0.5 V for 1h and 12h. ...74
Figure 3.18: The polarization (a) and power density (b) curves for a direct ethanol
fuel cell using Pt/C, PtSn/C and PtSnM(M=Ni, Co, Rh, Pd)/C anode catalysts. Tcell = 800C; Anode: Pt/C 40%, Pt-X-Y/C 40% (2 mg/cm2 total metal loading);
Cathode: Pt/C 40% (E-TEK) [EtOH]=1M; P(EtOH)=1 bar; P(O2)=3 bar,
Electrolyte: Nafion® 117 membrane. ...75
Figure 3.19: Comparison of single cell polarization curves for the DEFC based on a
PtSnNi anode catalyst with different ethanol concentrations at 900C. ...76
Figure 4.1: Schematic presentation of the infrared spectroelectrochemical cell...81 Figure 4.2: IR spectrum of ethanol, acetic acid, acetaldehyde, ethylacetate and
formic acid...83
Figure 4.3: SPAIR spectra obtained on Pt electrode in 0.1 M CH3CH2OH + 0.1 M HClO4. A flat ZnSe window was used for acetaldehyde (933 cm-1) and acetic acid bands (1280 cm-1) (a) and a prismatic CaF2 window for CO (2050 cm-1),
CO2 (2340 cm-1) bands (b, c, d). The reference spectrum was collected at 0.05
V vs. RHE and the sample spectra were taken after applying potential steps towards more positive potentials. The CO region (c) was calculated with a reference spectrum taken at 0.9 V vs. RHE (after complete CO oxidation) from
spectra in (b). The CO2 region (d) was calculated with a reference spectrum
taken at 0.05 V vs. RHE (before CO oxidation). ...85
Figure. 4.4: SPAIR spectra obtained on PtSn/C (a, b, c) in 0.1 M CH3CH2OH + 0.1
M HClO4. A flat ZnSe window was used for acetaldehyde (933 cm-1) and acetic
acid bands (1280 cm-1) and a prismatic CaF2 window for CO (2050 cm-1), CO2
(2340 cm-1) bands. The spectra were obtained and computed as described in
Fig. 4.3. ...86
Figure 4.5: SPAIR spectra obtained on PtSnNi/C (d, e; f) and PtSnCo/C (g, h, i)
electrodes in 0.1 M CH3CH2OH + 0.1 M HClO4. A prismatic CaF2 window was
used for acetic acid bands (1280 cm-1) (a, d) and for CO (2050 cm-1), CO2
(2340 cm-1) bands (b, c, e, f). The spectra were obtained and computed as
described in Fig. 4.3. ...87
Figure 4.6: SPAIR spectra obtained on PtSnRh/C (a, b, c) and PtSnPd/C (d, e, f)
electrodes in 0.1 M CH3CH2OH + 0.1 M HClO4. A prismatic CaF2 window was
used for acetic acid bands (1280 cm-1) (a, d) and for CO (2050 cm-1), CO2
(2340 cm-1) bands (b, c, e, f). The spectra were obtained and computed as
described in Fig. 4.3. ...88
Figure 4.7: SPAIR spectra obtained on Pt/C (a), PtSn/C(b), PtSnNi/C(c), PtSnCo/C
(d), PtSnRh/C (e), PtSnPd/C (f) electrodes in 0.1 M CH3CH2OH + 0.1 M HClO4.
...89
Figure 4.8: Schematical representation of (a) CO 5ζ to metal dz2 donation (b) metal dxz/dyx to CO 2π* backdonation. ...90
corresponding the potential dependence of the band center frequency for
linearly bonded COL and bridge bonded COB (from spectra in Figs. 4.3, 4.4, 4.5
and 4.6). ... 92
Figure 4.10: Potential dependence of the band intensities for CH3COOH (1280 cm-1) and C=O from carbonyl (1715 cm-1) formed during the first anodic polarization of Pt/C (a), PtSn/C (b), PtSnNi/C (c), PtSnCo/C (d), PtSnRh/C (e) and PtSnPd/C (f) electrodes in 0.1M
CH3CH2OH + 0.1 M HClO4 (from spectra in Figs. 4.3 , 4.4 , 4.5, 4.6).
... 94
Figure 4.11: (a) SPAIR spectra obtained on PtSnCo/C electrode in 1M CH3CH2OH
+ 0.1 M HClO4. A flat ZnSe window was used for CH3CHO (933 cm-1)
band (b) Potential dependence of the band intensities for CH3CHO
(933 cm-1), CH3COOH (1280 cm-1) and CO2 (2345 cm-1) formed during
the first anodic polarization of PtSnCo/C electrode (from spectra as indicated in (a)). Inset: potential dependence of the band intensities for CH3COOH (1280 cm-1) and for CO2 (2345 cm-1) from spectra in Fig. 4.5 g and i. ... 95
Figure 4.12: SPAIR spectra obtained on Pt/C (a, b, c), PtSn/C (d, e, f) and PtSnNi/C
(g, h, i) electrodes in 0.1 M CH3CHO + 0.1 M HClO4. The reference
spectrum was collected at 0.05 V vs. RHE and the sample spectra were taken after applying potential steps towards more positive potentials. The CO region (b, e, h) was calculated with a reference spectrum taken at 0.9 V vs. RHE, i.e., after complete CO oxidation. The CO2 region (c, f, i) was calculated with a reference spectrum taken at 0.05 V vs. RHE, i.e., before CO oxidation. ... 98
Figure 4.13: SPAIR spectra obtained on PtSnCo/C (a, b, c), PtSnRh/C (d, e, f) and
PtSnPd (g, h, i) electrodes in 0.1 M CH3CHO + 0.1 M HClO4. The spectra were obtained and computed as described in Fig. 4.12. ... 99
Figure 4.14: Potential dependence of the band intensities for CO2 (2341 cm-1) and
COL (2050 cm-1)formed during the first anodic polarization of Pt/C (a),
PtSn/C (b), PtSnNi/C (c), PtSnCo/C (d), PtSnRh/C (e) and PtSnPd/C
(f) electrodes in 0.1M CH3CHO + 0.1 M HClO4, Insets: corresponding
the potential dependence of the band center frequency for linearly bonded COL (from spectra in Figs. 4.11 and 4.12). ... 100
Figure 4.15: SPAIR spectra obtained on Pt/C (a) and PtSn/C (b) PtSnNi/C (c),
PtSnCo/C (d), PtSnRh/C (e), PtSnPd/C (f) electrodes in 0.1 M
CH3COOH + 0.1 M HClO4. The reference spectrum was collected at
0.05 V vs. RHE and the sample spectra were taken after applying potential steps towards more positive potentials. ... 102
Figure 4.16: The configuration of acetate ions bonded on the metal site (M) as a
monodentate (a) and bidentate (bridge) (b) modes. ... 103
Figure 4.17: The possible structure of adsorbed acetic acid at the electrode solution
interface as assumed in ref. [170]. ... 103
Figure 4.18: Schematic representation of possible structures of adsorbed acetic
acid at the PtSn/C, PtSnNi/C and PtSnPd/C electrodes solution interface as derived from the present work. ... 104
Figure 4.19: Potential dependence of the band intensities for CO2 (2345 cm-1) (a) and COL (2040 cm-1) (b) for CH3COOH (1280 cm-1) (c) obtained on Pt/C, PtSn/C, PtSnNi/C, PtSnCo/C, PtSnRh/C and PtSnPd/C electrodes in 0.1 M CH3CH2OH + 0.1M HClO4 (from spectra in Figs. 4.3, 4.4, 4.5 and 4.6). ... 106
Figure 4.20: Potential dependence of the band intensities for CO2 (2345 cm-1) (a)
and COL (2040 cm-1) (b) obtained on Pt/C, PtSn/C, PtSnNi/C,
PtSnCo/C, PtSnRh/C and PtSnPd/C electrodes in 0.1 M CH3CHO +
Figure 4.21: Possible ethanol oxidation reaction mechanism on Rh surface via
oxametallacyle intermediate. ... 111
Figure 4.22: Scheme of reaction mechanism proposed for the production of CO2 from ethanol partial oxidation at PtSnRh/C catalyst. ... 112
Figure 4.23: Scheme of reaction mechanism proposed for the partial oxidation of
ethanol at Pt/C, PtSn/C, PtSnM (M= Ni, Co, Rh, Pd)/C catalysts .... 113
Figure 4.24: A general scheme for the mechanism of ethanol oxidation at Pt/C,
SYNTHESIS AND CHARACTERIZATION OF NANOPARTICLES FOR ETHANOL OXIDATION IN DIRECT ETHANOL FUEL CELL (DEFC)
SUMMARY
The direct ethanol fuel cell (DEFC) is a very promising power source for low power applications since ethanol is very attractive fuel regarding its high power energy density, low working temperature, non toxicity and natural availability. However, there are some problems that have to be overcome if we wish to see DEFCs in our everyday life. For the anode catalyst, there are two main drawbacks that cause problems with the DEFC, namely, expensive noble metals with high loading and long-term stability. On the other hand, an active anode catalyst for ethanol oxidation should be breaking the C-C bond to achieve maximum efficiency.
Currently, the best binary catalyst for ethanol oxidation is PtSn; however, the addition of Sn to Pt catalyst inhibits the breaking the C-C bond. This is not favorable for ethanol energy conversion efficiency and fuel cell utilization. On the other hand, further improvement in stability is needed. So far, a ternary PtSnRu catalyst seems to be the most promising for use in DEFC, however, an alternative ternary catalyst should be considered together with cost-saving effects.
The aim of this thesis is to develop alternative anode catalysts with high electrochemical activity in direct ethanol fuel cell applications. For this purpose, carbon supported (Vulcan XC72) monometallic Pt, bimetallic PtM(M=Sn, Co, Ni, Rh, Pd) and trimetallic PtSnM(M=Ni, Co, Rh, Pd) catalysts were synthesized by Bönnemann‘s colloidal precursor coreduction method. In order to evaluate the relationship between the catalyst structure and catalyst activity, various microscopic and spectroscopic characterization techniques were employed such as X-ray Diffraction (XRD), Transmission Electron Microscopy (TEM), Element Energy Dispersive Spectroscopy (EDS), X-ray Photoelectron Spectroscopy (XPS) and
in-situ Fourier Transform Infrared Spectroscopy (FTIR). Electrochemical
characterization of the catalysts regarding their onset potentials, activities and current densities towards ethanol oxidation were determined by linear sweep voltammetry. Furthermore, anode performance tests in a single ethanol fuel cell (DEFC) were also employed. The addition of a Ni or Co to PtSn catalyst showed the best catalytic activity for ethanol oxidation with low onset potential. Spectroscopic characterization results revealed that the presence of Ni and Co metals in the bulk composition lead to a lower energy levels of the Pt d states on the catalyst surface
and weaken the Pt-CO bond. On the other hand, separate SnO2 phase can oxidize
adsorbed CO-like intermediates. PtSnNi and PtSnCo ternary systems with less noble metal in the catalyst showed a higher anode performance in direct ethanol fuel cell operation.
Keywords: direct ethanol fuel cell, ethanol oxidation, anode catalyst, Pt-based binary
SYNTHÈSE ET CARACTÉRISATION DE NANOPARTICULES POUR L’OXYDATION DE L’ETHANOL DANS UNE PILE À COMBUSTIBLE
RESUME DETAILLE
Les piles à combustible à membrane échangeuse de protons à oxydation directe de l‘éthanol (DEFC, Direct Ethanol Fuel Cell) sont une technologie prometteuse pour les applications de faible puissance au regard de la grande densité d‘énergie contenue dans ce combustible, de la faible température de fonctionnement, de la non toxicité et de la disponibilité de ce composé. Cependant, quelques problèmes sont à surmonter si nous souhaitons voir émerger cette technologie pour le grand public. Pour le catalyseur situé à l‘anode, deux inconvénients majeurs posent problème avec les DEFCs, à savoir le coût des métaux nobles utilisés à fort taux de charge et la stabilité du catalyseur sur le long terme. De plus, un catalyseur anodique actif doit pouvoir rompre la liaison carbone-carbone afin d‘obtenir un rendement maximal.
Actuellement, le meilleur catalyseur bimétallique est l‘association PtSn; cependant, l‘addition d‘étain au platine inhibe la rupture de la liaison C-C. Ceci n‘est pas favorable quant à une utilisation pour les piles à combustible et, de plus, un accroissement de la stabilité de ce type de catalyseur est requis. Aussi, le catalyseur tri-métallique PtSnRu semble prometteur pour une utilisation dans les DEFCs mais un catalyseur tri-métallique alternatif d‘un moindre coût est nécessaire. Ainsi, un catalyseur tri-métallique présentant une forte activité et une grande stabilité ainsi qu‘une proportion plus faible de métaux nobles doit être développé pour dépasser les limitations actuelles.
Le cœur de ce projet de thèse a été de développer de nouveaux catalyseurs anodiques permettant de donner un aperçu de la manière dont ces problèmes et limitations peuvent être surmontés. Afin de réaliser cela, de nombreux catalyseurs bimétalliques à base de platine et tri-métalliques ont été synthétisés par différentes méthodes afin de préparer le meilleur catalyseur possible. Il a été vu que la méthode de synthèse choisie pour préparer le catalyseur joue un rôle crucial sur les performances catalytiques mesurées. Les catalyseurs préparés via le « précurseur colloïdal de Bönneman » ont permis de déterminer la procédure la plus efficace pour le développement de catalyseurs hautement actifs pour l‘oxydation de l‘éthanol dans les DEFCs.
Un système ternaire basé sur l‘association PtSn a été envisagé avec une réduction de la fraction de métaux. Pour cela, des métaux de transition tels que Ni ou Co ont été incorporés dans les matériaux étudiés. D‘autre part, l‘addition d‘autres métaux nobles (Rh et Pd) au couple PtSn a également été étudiée car un plus grand rendement était attendu. Les résultats de ce manuscrit montrent que les catalyseurs supportés sur carbone Pt80Sn10Ni10 et Pt80Sn10Co10 présentent des densités de courant importantes ainsi que des potentiels d‘initiation de l‘oxydation faibles, ce qui en fait les catalyseurs les plus prometteurs de l‘ensemble de ceux qui ont été
intermédiaires réactionnels carbonylés. Avec une telle formulation de catalyseur, de plus grandes performances ont été obtenues lors de test en pile avec une quantité inférieure de métaux nobles.
Mots-clés : pile à combustible à oxydation direct de l‘éthanol, oxydation de l‘éthanol,
catalyseur anodique, catalyseur bimétallique à base de Pt, catalyseur tri-métallique à base de PtSn.
1. INTRODUCTION
1.1 Background
Clearly, our world is in great trouble due to depletion of energy resources as the increased energy demands from overpopulation. Consequently, destruction of nature with the increasing of harmful exploitative human activities causes problems like air pollution and global climate change with the warning signs of carbon dioxide build-up. These issues are intimately related since the energy heavily relies on the combustion of fossil fuels, which are not only low in efficiency, but also the major contributor to environmental pollution. Therefore, the development of clean and renewable energy technology in place of conventional ones shows great significance.
Fuel cells, due to their high energy conversion efficiency and minimum pollutant emission, are the most promising candidates. Low temperature fuel cells, generally conceived around a proton electrolyte membrane, seem able to be used for a large range of power applications. Liquid fuels, such as ethanol is considered to be an attractive and promising because of its non-toxicity, natural availability, renewability, higher power density, and green-house contribution to the atmosphere.
1.2 Principle of Direct Ethanol Fuel Cell (DEFC)
The working principle of a direct ethanol fuel cell is illustrated in the Fig. 1.1. The ethanol aqueous solutions are fed to the anode compartment while humidified oxygen (air) flows through the cathodes compartment. With the aid of anode catalyst, ethanol is oxidized to produce carbon dioxide liberating simultaneously protons and
electrons. Protons H+ migrate through the membrane and electrons flow through an
external circuit and then arrive at the cathode. There, the oxygen (air) reacts with the protons and electrons transported from the anode to produce are water and
carbon dioxide CO2.
corresponding to an anode potential, E10 = +0.084 V vs. SHE.
Oxygen is reduced to the cathode according to the following reaction:
(1.2)
and corresponding to the cathode potential, E20 = +1.229 V/SHE. The standard
electromotive force is defined as
(1.3)
where F is the Faraday's constant (96,487 coulombs/g-mole electron) and the
corresponding to Gibbs energy change is ∆G0 = -1326 kJ.mol-1 for the overall
combustion reaction:
(1.4)
Figure 1.1: Schematic presentation of a direct ethanol fuel cell.
The specific energy can be therefore evaluated as follows:
(1.5)
where M = 46 g.mol-1 is the molecular weight of ethanol.
The enthalpy change ∆H0 = -1367 kJ.mol-1 allows us to calculate reversible energy
efficiency at equilibrium potential:
(1.6)
This is considerably higher than that of an H2-O2 fuel cell (i.e., 83%). On the other
hand, under normal operating conditions, at a current density j, the electrode + water Anode (-) Cathode (+) Electrolyte (membrane) Carbon dioxide Ethanol + water Oxygen (air) Water We = 8.01 kWhr.kg -1
potentials deviate from their equilibrium values as a result of large overpotentials, , at both electrodes.
(at the ethanol anode) (1.7) (at the oxygen cathode) (1.8) These overpotentials limit the kinetics of the electrochemical reaction at electrodes, and decrease the total fuel cell efficiency. Besides, a loss is due to the cell
resistance Re (resulting mainly from the proton conducting membrane). The cell
potential under working conditions is:
(1.9) Thus the energy efficiency will be decreased proportionally to the so called potential efficiency:
(1.10)
For example a DEFC working at 0.5 V, the potential efficiency is:
(1.11) When the electrochemical reaction is partial, the total energy efficiency is influenced by a faradic efficiency:
(1.12)
where is the number of electron effectively exchanged for the overall reaction
and is the theoretical number of exchanged electrons for a complete combustion.
If the combustion stops at acetic acid, then the faradic efficiency will be
. The overall energy efficiency at 0.5 V is then defined as follows:
(1.13)
The energy efficiency corresponds to mass density will be 8.01 * 0.141 = 1.129 kWhr.kg-1.
To improve the energy efficiency, one way is to decrease the overpotential with elaborating more effective bimetallic or multimetallic platinum-based catalysts. Another way is to increase the reaction rate with increasing the working temperature
1.3 Literature Survey
1.3.1 Overview of active catalysts for ethanol oxidation
The oxidation of ethanol is a multi step reaction with the necessity of 12 electrons transfer while oxidation of methanol involves 6 electrons only. Therefore, mechanism for oxidation of ethanol is more complex, leading to the formation of
several intermediates, which produce by-products and the final product (CO2).
High stability and activity of platinum in acid environment, makes it a suitable catalyst for the electrooxidation of many small chemical molecules. However, at room temperatures, the platinum is readily poisoned by strongly adsorbed by CO. Making alloys with a second or a third metal is a convenient way to modify the electrocatalytic properties of platinum in order to overcome poisoning due to ethanol electro-oxidation intermediates, especially the adsorbed CO.
To explain the enhancement of catalytic activity with addition second or third metals to Pt catalyst, three important theories were found, namely the bi-functional effect, the electronic (ligand) effect and the spillover effect.
The bi-functional effect states that the catalytic properties of each element combine in the alloy in a synergy to create catalytically more active than parent metals. This mechanism is well adapted to incorporation of Ru [1] and Sn [2] into Pt catalyst. For ethanol oxidation reaction on PtM (M=Sn, Ru, etc.) binary alloys, the adsorption of ethanol on Pt sites is more favored than the other metals such as Sn or Ru. On the other hand, Sn or Ru sites can provide water dissociation at lower potentials than Pt (Eq. 1.14). Consequently, the adsorbed surface OH groups on Sn or Ru sites react
with the adsorbed CO on Pt sites to form CO2 (Eq. 1.15).
(1.14)
(1.15) The second mechanism is the electronic (ligand) effect. This mechanism results in electron transfer from the promoter element to the d-band of Pt. Using an in-situ X-ray Absorption Spectroscopy (XAS) studies, Mukerjee and McBreen [3] showed that alloying Pt with Sn causes partial filling of the Pt d-band vacancies and increases in Pt-Pt bond distance which result in a weaker adsorption of CO on Pt sites. In this way, the decrease of CO poisoning on Pt sites can be provided.
The third mechanism is related to the so-called hydrogen spillover effect, which was proposed by Shen et al. [4] on Pt-WO3 catalyst in the case of methanol oxidation
reaction. In these reactions, the hydrogen atoms abstracted from methanol via Pt sites and then transferred to the WO3 sites, therefore, providing Pt-free sites for methanol adsorption. In the same manner, Stamenkovic et al. [5] and Davies et al. [6] also proposed OH spillover effect. According to these authors, OH species is formed on Ru or Sn sites than spill-over and diffusion to the adjacent Pt sites where react with CO. Using ab initio molecular dynamics calculations, Desai and Neurock [7] suggested that the presence of surface Ru-OH group promotes the water activation on a neighboring Pt sites via a low energy proton transfer path.
Consequently, an active anode catalyst should break the C-C bond rather than promoting mainly the C-O bond activation at low temperature and to completely oxidize the poisoning species at lower potential.
Thanks to the use of combined techniques such as in-situ infrared (IR) electrochemical spectroscopy and analyses of both product and reaction byproducts (chromatography, mass spectrometry) could be elucidated the reaction mechanism.
1.3.2 Mechanistic aspects of ethanol oxidation reaction
In this section, the past studies for the mechanism of electrooxidation of ethanol are presented. Discussion of other possible mechanism occurring as derived from this work is resumed in Chapter 4 based on the experimental results obtained from the in-situ infrared spectroscopic measurements.
Past studies on the electrooxidation of ethanol have been conducted in-situ (e.g. in operating fuel cell) and ex-situ (e.g. mass spectroscopy and infrared spectroscopy) on platinum and platinum alloys which have resulted in the observation of carbon
dioxide CO2, acetaldehyde CH3CHO (AAL) and acetic acid CH3COOH (AA) as the
major products [8-10]. The product ratio is dependent on the electrocatalyst utilized (e.g Pt vs. PtSn) and electrode potential which the reaction takes place in the
system. The strongly adsorbed COads species was mainly responsible for the
poisoning on platinum electrode, which was observed by in situ infrared spectroscopy. Nevertheless the nature of the adsorbed species during the ethanol adsorption in acid environment is more complex.
DEMS (Differential Electrochemical Mass Spectrometry) analysis combined with the in-situ infrared spectroscopy measurement, Bittins Cattaneo et al. [11] were able to identify different species formed during the adsorption of ethanol. The authors
with the results of Willsau and Heitbaum [12] who suggested the majority adsorbed
species in C2 (acetyl species) rather than CH4.
From previous work of Iwasita and Pastor [13, 14] and Rightmire et al. [15], it was shown that ethanol is dissociatively adsorbed on platinum sites either via an O-adsorption or a C-O-adsorption process:
By breaking the O-H bond which results in adsorbed ethoxy group:
(1.16)
By breaking the C-H bond of the α-C atom:
(1.17) Iwasita et al. [13, 14] were able to show the presence of another species, bonded by
two sites of platinum surface (Pt)2=COH-CH3, which was formed by deprotonation of
Pt-CHOH-CH3 according to the reaction (Eq. 1.18). Besides, Pt-CHOH-CH3 species
seemed to be a precursor of the acetyl species:
(1.18)
Then, methane can be produced during the C-C bond breaking of Pt-CO-CH3
species in the hydrogen adsorption region at 0.05 V:
(1.19)
Using on line mass spectrometry (DEMS) and the mass difference related to 13C
labelled ethanol at the α-carbon atom was linked to the quantity of ethane produces
from the (Pt)2=COH-CH3 species by hydrolyzing the O-H bond:
(1.20) According to their DEMS measurements, the ratio of methane and ethane is 6:1. Yields of adsorbed species of ethanol at 0.3 V on polycrystalline platinum are ethoxy
species Pt-OCH2-CH3 (32%), (Pt)2=COH-CH3 (5%), acetyl species Pt-COCH3
(29.5%) and carbon monoxide CO (33.5%).
In a controlled potential electrolysis study of Hitmi et al. [16] the elucidation of the reaction mechanism in perchloric acid environment based on the kinetic data is given. The authors thus showed the existence of oxidation reaction through parallel and sequential steps:
(1.22) The reaction (1.21) would occur at higher electrode potential (E > 0.8 V vs. RHE) where the oxygenated species were formed on the platinum surface; however, the reaction (1.22) would occur mainly at lower potential (E < 0.6 V vs. RHE) [17].
Besides, the formation of CH3CHO would be favored at higher ethanol concentration
while the CH3COOH would be at lower ethanol concentration. As it is well known, at
intermediate potential, 0.6 ≤ E ≤ 0.8 V vs. RHE, dissociative adsorption of water occurs on Pt sites:
(1.23) Thanks to the formation of oxygenated surface species on Pt sites, acetaldehyde can thus oxidize to acetic acid according to the following reaction:
(1.24)
Further oxidation to CO2 seemed to be difficult at ambient temperature. However,
CO2 can be produced from the dissociative adsorption of ethanol [16]:
Using in situ Fourier transform infrared (FTIR) spectroscopy and on-line DEMS studies Wang et al. [18] revealed that the addition of Sn or Ru to Pt does not enhance activity for C-C bond breaking in ethanol. However, alloying Pt with Sn or Ru leads to lower the COad surface coverage so the enhanced overall activity for ethanol oxidation. According to same authors, the yield of acetic acid on Pt/C, PtSn/C and PtRu/C catalysts increased with increasing electrode potential at the expense of acetaldehyde formation.
AA as the majority product. Besides, PtRu has a low activity for breaking C-C bond
due to the presence of CO2 at maximum 5% of the total products.
On the other hand, Fujiwara et al. [20] were performed cyclic voltammetry and
DEMS measurements in the 0.1M HClO4 medium for ethanol oxidation on
co-electrodeposited PtRu electrode. They found that the selectivity towards CO2 is
highest with the high Ru content (33 and 50%) at low temperatures; however, the overall activity of ethanol oxidation is small due to the inhibition of ethanol adsorption on Ru sites. In addition, optimum compositions of the electrode for overall reaction were found to be Pt0.67Ru0.33 at 5 0C and Pt0.85Ru0.15 at 250C and 400C.
Souza et al. [21] studied ethanol oxidation on electrodes of PtRh at different compositions using the combination of the DEMS and FTIRS techniques. According to their results, the AAL yield decreases when Rh added to the Pt electrode.
However, CO2 formation over AAL was improved on the electrodes Pt73Rh27 and
Pt55Rh45 compared to Pt; the better selectivity was obtained by composition of (73:
27). They concluded that Rh increases the ability for C-C bond dissociation in ethanol; however, PtRh is not a good catalyst owing to decreasing overall rate of ethanol oxidation reaction.
Vigier et al. [22] reported that the addition of Sn to Pt/C catalyst favors the dissociative adsorption of ethanol and the cleavage of the C-C bond at lower potentials. According to their results, ethanol adsorbs only on platinum sites and the first step can be the same as for platinum alone (Eqs. 1.14 and 1.15). However, CO species is formed on PtSn/C catalyst takes place at lower potentials than on a Pt/C catalyst, between 0.1 V and 0.3 V vs. RHE, whereas on a Pt catalyst the dissociative adsorption of ethanol occurs at potentials between 0.3 V and 0.4 V vs. RHE. Then, it can be stated that reactions from (1.14) to (1.16) occur at very low
potentials and with relatively rapid kinetics. Once intermediate species like Pt-CH3
-CO (Eq. 1.18) and Pt–-CO (Eq. 1.19) are formed, they can be oxidized at potentials lower than 0.35 V vs. RHE because of the adsorbed OH species are formed on Sn sites at this potential.
(1.25)
(1.26)
They found that the higher efficiency of PtSn in forming AA compared to Pt at low potentials (E < 0.35 V vs. RHE) due to the bifunctional mechanism. On the other hand, the yield in CO2 for Pt/C catalyst is two times higher than PtSn/C catalyst. This was explained that the need to have several adjacent platinum sites to adsorb ethanol molecule dissociatively and to break the C-C bond.
Concerning the study of ternary catalysts for the ethanol oxidation reaction mechanism is little in the literature, because of complexity for the determination of the elusive mechanism. Nevertheless, several PtRu-based and PtSn-based ternary systems were studied in the framework of the oxidation of ethanol. Regarding the activity for ethanol oxidation, PtSn-based catalysts showed increased performances in comparison with PtRu-based catalysts [23].
Rousseau et al. [24] found that the addition of Ru to PtSn/C catalyst does not change the distribution products, however, the increased catalytic activity towards ethanol oxidation.
Riberio et al. [25] were prepared PtSnIr/C catalyst using Pechini-Adams modified method. They found that the presence of Ir in the catalyst may increase the catalyst roughness or structural defects which make the better catalytic activity than PtSn/C catalyst. Moreover, the increased surface oxophilicity owing to the Ir in the PtSn/C catalyst bring forth an increasing the Sn-O bond strength and the acidity of SnOH sites which favor the ethanol oxidation at lower potentials. They also suggested that the presence of acetic acid is more important for Sn and Ir containing electrocatalysts which activate the interfacial water necessary for its formation the presence of small amount of adsorbed CO also indicated its easy removal of the
surface of the catalysts through CO2 formation.
Zhu et al. [26] was prepared PtSnIn/C catalyst using NaBH4 as a reducing agent in
ethylene glycol solution. They were analyzed the anode products of the DEFCs at
0.5 V. They found that C2 species are the major anode products which were similar
to Rousseau‘s [24] results. Moreover, the yield of AAL on PtSnIn(60:20:20)/C is much higher than that on PtSn(60:40)/C. They proposed that the addition of In into PtSn/C catalyst leads to promotion of the α-H dissociation from ethanol which can enhance the performance of ethanol oxidation on the catalyst.
1.4 Purposes and Scope
The main objectives of the thesis work were to focus on developing high catalytic performance (in terms of activity and stability) and cost-effective anode electrocatalysts for use in direct ethanol fuel cell (DEFC). In this scope, this thesis involves the following activities:
To find a method of preparation of catalytic materials that offers a good dispersion in order to allow decreasing poisoning in comparison with the massive materials,
To determine the most active catalysts for ethanol oxidation using the conventional electrochemical techniques,
To examine the catalyst surface and structural properties of the most active catalysts for ethanol oxidation using a various physical characterization techniques, which can be used to correlate with catalytic performance and guide for the design of catalyst,
To evaluate the single ethanol fuel cell measurements adapting a method for prepared carbon supported anode catalyst from practical point of view, To establish an approach to the ethanol oxidation reaction mechanism on the
different catalysts with help of in-situ Fourier transform infrared (FTIR) spectroscopy techniques.
In first step, several carbon supported catalysts were prepared by different preparation colloidal method such as Bönnemann, microemulsion and polyol. Among these methods, catalysts synthesized with Bönnemann colloidal precursor showed rather high activity and stability for ethanol oxidation by employing conventional electrochemical techniques. Therefore, it was decided to focus on this catalyst preparation method as the most promising electrocatalytic activity and stability for practical application in fuel cell.
In the literature, PtSn-based ternary catalysts systems seem to have better performance so far regarding ethanol oxidation. In this work, therefore, the research on anode materials for ethanol oxidation will be focused on PtSn-based ternary catalysts. The activity of several PtSn-based ternary catalysts and their corresponding Pt-based binary catalysts will be evaluated and compared. The addition of second or third elements to platinum may result to allow the activation of the C-C bond at low temperature and to decrease the poisoning by weakly or strongly adsorbed intermediates.
1.5 Structural Organization of Thesis
This thesis is presented in the following order:
Introduction to the thesis which gives the background and literature works as well as the purposes and scope are given in Chapter 1.
Carbon supported catalysts preparation and their characterization by various techniques such as X-ray diffraction (XRD), X-ray photon electron microscopy (XPS), Transmission electron microscopy (TEM) and Energy dispersive X-ray analysis (EDX) are given in Chapter 2.
The electrochemical activity and stability of the prepared catalysts for ethanol oxidation reaction correlating with the performance in direct ethanol fuel cell (DEFC) are given in Chapter 3.
Investigation of the ethanol, acetaldehyde and acetic acid adsorption and oxidation reaction mechanism on prepared catalysts using in-situ Fourier transform infrared (FTIR) spectroscopy is given in Chapter 4.
2. SYNTHESIS AND PHYSICAL CHARACTERIZATION OF CARBON SUPPORTED ANODE CATALYSTS FOR DEFC
2.1 Introduction
Various catalyst preparation methods provide the formation of different nanostructures which lead to a huge differencies in electrocatalytic activity for catalysts. However, the search for understanding the influence of the nanoparticle morphology, size and surface composition on the catalytic performance is a permanent challenge.
In this work, we focused on the catalyst preparation via Bönnemann precursor method [27-32] which offers high catalytic performance, durability and easy to scale up for future technological applications in fuel cells. In this method, the colloidal nanoparticles are protected against agglomeration by using lipophilic surfactant such as tetraalkylammonium halides, which has a remarkable solubility and extraordinary stability in organic solvents. The tetraalkylammonium stabilized colloidal nanoparticles are supported on electron conducting commercial carbon support, e.g. Vulcan XC72, and then heat treatment of the supported colloid is followed. This method is applicable for metal salts in groups 4-11 (and tin) in the periodic table. Moreover, several Pt based bimetallic colloidal nanoparticles such as PtRh [27, 29-30] PtPd [29,30], PtSn [32-35], PtRu [32, 35-40] PtCo [30, 41] and PtCu [30] can be prepared by coreduction of different metal salts. Besides there are few reports in the literature on the preparation of Pt based plurimetallic colloidal nanoparticles such as PtSnRu [34, 38], PtRuMo [35, 38] and PtRuW [38].
In this chapter, carbon supported Pt, Pt-based bimetallic and PtSn-based trimetallic
catalysts were prepared by coreduction using Bönnemann‘s colloidal precursor
method. The nominal atomic ratio of Pt:X (X=Sn, Ni, Co, Rh, Pd) and Pt:Sn:Y (Y=Ni, Co, Rh, Pd) in the catalysts were designed to be 9:1 and 8:1:1, respectively. In order to evaluate the relationship between catalyst structure and catalytic activity, various characterization techniques was employed including X-ray diffraction (XRD), X-ray photon electron spectroscopy (XPS), Transmission electron microscopy
2.2 Experimental Section
2.2.1 Catalysts preparation
The preparation method of the Pt-based bimetallic and PtSn-based trimetallic catalysts is based on the procedure described by Bönnemann et al. [27-32], but slightly modifying as shown in the following steps:
The reducing agent (tetraoctylammonium triethylhydroborate) was prepared by mixing the solution of tetraoctylammonium bromide and potassium triethylhydroborate in THF,
Pre-prepared reducing agent was added slowly to the metal salts which were dissolved in THF,
Metal colloidal nanoparticles were deposited on high surface area of Vulcan XC72,
The carbon supported metal colloid was exposed to air atmosphere at 3000C
for 1 h 30,
Finally, the catalyst powder was washed several times with ethanol and distilled water after dried in a vacuum descicator.
All experiments were carried out under argon atmosphere, using non-hydrated metal chlorides salts and dry solvents. Bimetallic Pt9X1 (X = Sn, Ni, Co, Rh, Pd) and trimetallic Pt8Sn1Y1 (M = Ni, Co, Rh, Pd) colloidal nanoparticles were prepared by coreduction of different metal salts. These bimetallic and trimetallic colloidal nanoparticles can be stable for months without any metal precipitation. In any event, these highly dispersed colloidal nanoparticles can be supported on a high surface area carbon (Vulcan XC72) in the form of a redispersible catalyst powders.
2.2.1.1 Synthesis of tetraoctylammonium triethylhydroborate
35 mmol 1M KBEt3H (reducing hydride species) solution was added to 35 mmol
N(C8H17)4Br (protecting agent) salt, which was dissolved in 150mL tetrahydrofuran (THF) solution, for 30 min at room temperature with constant stirring, is given in the following reaction:
(2.1) After leaving for 3 hours with stirring, KBr was precipitated. This precipitate was filtered off on a glass frit and washed with THF (48mL). The tetraoctylammonium
triethylhydroborate N(C8H17)4BEt3H (reducing agent), was obtained as colorless solution (0.15 M), which was kept in the freezer.
2.2.1.2 Synthesis of colloidal Pt nanoparticles
PtCl2 (1.5 mmol) metal salt was dissolved in THF solution (40 mL) for 1 hour with constant stirring. The reducing agent (3 mmol, 0.03 M) was added drop wise to a
suspension of PtCl2 under constant stirring at five hours (Fig. 2.1). The color of the
solution mixture was turned into black following the reduction reaction of platinum metal salt (Eq. 2.1).
Figure 2.1: A scheme used for the synthesis of colloidal nanoparticles.
(2.2) The resulting solution mixture was then stirred overnight. Consequently, the colloidal platinum nanoparticles (2 g/L) were successfully obtained.
The resultant metal colloid is surrounded by the protecting NR4+ groups, which
Figure 2.2: Scheme for stabilization of the metal core by NR4X as adapted from [16].
2.2.1.3 Synthesis of colloidal bimetallic and trimetallic nanoparticles
The synthesis procedure was the same as described for the monometallic Pt nanoparticles. However, bimetallic or trimetallic colloids often showed better activity and selectivity compared to monometallic colloids due to a synergy between metal particles [45].
By coreduction of metal salts with the reducing agent, PtSn [32-35], PtRh [27, 29-30], PtNi, PtCo [30, 43], and PtPd [29-30] bimetallic and PtSnNi, PtSnCo, PtSnRh and PtSnPd trimetallic colloidal nanoparticles were obtained. With the nominal composition of bimetallic Pt9X1 (X = Sn, Ni, Co, Rh, Pd) and trimetallic Pt8Sn1Y1 (Y = Ni, Co, Rh, Pd) colloidal nanoparticles were successfully prepared according to the Eq. (2.3) and (2.4), respectively.
(2.3) x = 2 or 3, R = C8H17 , M = Sn, Ni, Co, Rh, Pd x = 2 or 3, R = C8H17, M = Ni, Co, Rh, Pd
(2.4)
2.2.1.4 Deposition of colloidal metal nanoparticles onto carbon support
Primarily, the commercial carbon black (Vulcan XC72 by Cabot) was thermally
pre-treated at 4000C under nitrogen atmosphere before using as a supporting material.
Then, the catalyst was supported on Vulcan XC72 with the metal loading of 40 wt.% by combining with a mixture of 40 mL metal colloidal solution (2 g/L) in THF and 120 mg Vulcan XC72. This suspension mixture was then placed in an ultrasonic bath and sonicated until all the solvent was evaporated. As a result, the carbon supported
metal colloids were obtained as waxy, black residue. In order to eliminate the
organic surfactant shell (NR4Cl), the waxy colloids were exposed to the thermal
treatment under air atmosphere at 3000C [34, 39] for 1 h 30. Finally, the dried catalyst powder was obtained after washing several times with ethanol and distilled water and then drying overnight in a vacuum descicator.
In brief, the pathway of colloidal nanocatalyst preparation can be schematically presented in Fig. 2.3 (M = Pt / Pt-X / Pt-Sn-Y, where X = Sn, Ni, Co, Rh, Pd and Y = Ni, Co, Rh, Pd).
Figure 2.3: Schematic illustration of the catalyst preparation procedure. 2.2.2 Physical characterization
2.2.2.1 X-ray diffraction (XRD)
X-ray diffraction patterns were collected on a Brucker D5005 diffractometer fiited with an AR monochromator and scintillation detector was used to determine catalysts structure and evaluate the particle size. The angle of the incident beam to the substrate surface was approximately 0.5º, and the detector was rotated to scan
the samples. The 2ϴ angular region between 200 and 800 was explored at a scan
rate of 0.10 s-1 step. The Pt (220) peak was fitted well by Pearson 7 function using
linear baseline correction for accurate measurements of full width at half maximum (fwhm) and peak position. The width of the Pt (220) peak was used to calculate the average crystallite size according to Scherer‘s equation and the Bragg formula was employed to calculate the lattice parameters of the catalysts. The diffraction patterns were recorded and analyzed by comparing them with standard powder diffraction data such as Joint Commission on Powder Diffraction Standards (JCPDS) powder diffraction patterns (National Institute of Standards and Technology, NIST).
+ Vulcan XC72
Δ 3000C
2.2.2.2 X-ray photon electron spectroscopy (XPS)
Photoelectron spectra of selected catalysts were acquired with an ESCALAB 3 MKII de VG spectrometer equipped with a hemispherical electron analyzer and Mg Kα (hν = 1254.6 eV) 300 W X-ray source. The spectra were collected at pass energy of 20 eV, which is typical of high-resolution conditions. The quantitative evaluation of each species was carried out by dividing the integrated peak area by empirical atomic sensitivity factors [46]. A background in spectral lines caused by inelastically scattered photoelectrons was removed using the well-known iterative integral method by Shirley [47] and fitting of the experimental curve to a combination of Lorentzian and Gaussian lines of variable proportions. All binding energies were determined by referencing to the C 1s peak at 284.9 eV.
The inelastic mean free path (IMFP) was calculated using a Java applet (IMFP grapher) [48] based on the modeling functions from Refs. [49-50].
2.2.2.3 Transmission electron microscopy (TEM)
Transmission electron microscopy (TEM images recorded with Philips CM 120 microscope with a resolution of 0.35 nm) was used to observe the morphology of the nanoparticles on Vulcan XC-72 carbon and to determine the particle size distribution. High-resolution TEM (HR-TEM) lattice images of the nanoparticles were obtained by JEOL JEM-2100VRP electron microscope working at 200 kV accelerating voltage with LaB6 emitter. The point and linear resolution were 0.19 nm and 0.14 nm, respectively. The point-dissolved EDX analysis was performed at 200 kV equipped
with a LaB6 filament and a CCD camera (Gatan Ultrascan 2Kx2K) attached to the
microscope. Identification of the crystalline phases was carried out using PCPDFWIN software (PDF-2 version of the International Center for Diffraction Data-ICDD) and indexing of the electron diffraction patterns was done using the CaRIne Crystallography 3.1 software. The samples for TEM were prepared by adding a drop of the suspension, made by ultrasonically dispersing the catalyst in ethanol, onto a copper grid (200 meshes) covered with carbon film, and then evaporating the ethanol.
2.3 Results and Discussion
2.3.1 XRD analysis
X-rays have wavelength in the Angstrom range, which is appropriate to cause diffraction through crystal planes. These possible reflections are given by the Bragg equation [51].
(2.5)
where λ is the wavelength of X-rays used (1.54056 Å for Cu Kα1 radiation), d is the
perpendicular distance between two parallel crystal planes and n gives the order of reflection. The d value with indices (h,k,l) for cubic crystal is calculated from the following formula,
(2.6)
The sample is rotated to remove any effect due to any preferred orientation of crystals and enhance the number of particles that contribute to diffraction. The particles of the supported catalyst possess a long-range and randomly oriented, but the size of the ordered domains is small and therefore peak-broadening is observed. From this peak broadening, however, the average crystallite size can be estimated according to the Debye-Scherrer equation [51]:
(2.7)
Where L is the average crystallite size, is the angle at the position of the peak
maximum and is the width of the peak (in radians). The average crystallite size
obtained from this width gives an average diameter, which is comparable to the
volume weighted diameter ( ) determined in TEM analysis (see details in the
further section of TEM ). Therefore one should be very careful while comparing the particle size data from XRD and TEM.
The lattice parameters of catalysts are evaluated by substituting the equation (2.6) for the d spacing into the Bragg equation (2.5) and squaring gives:
(2.8)
The (220) peak of the Pt face centered cubic (fcc) structure around 2ϴ = 700, where
the diffraction spectrum of the carbon support contributes only in terms of a linear background [52], is used for the calculation of the average crystallite size and the lattice parameter of the catalysts. Therefore, the calculation of the lattice parameter using the (220) reflection peak in the Eq. (2.8) simplifies:
(2.9)
where a, is the lattice parameter (nm) and all other symbols have same meanings as in Eq. (2.7).
X-ray diffraction patterns of all the studied supported catalysts are given in Figs. 2.4 and 2.5, which reveal the structural information for the bulk of catalyst nanoparticles
together with its carbon support. The diffraction peak centered at 20-250 is attributed
to Vulcan XC-72 carbon support whereas the other peaks are reflections of the fcc crystal lattice of Pt (vertical dotted lines represent peak positions for Pt fcc lattice) correspond to the planes (111), (200) and (220), respectively. The position of the Pt (220) diffraction peaks extracted from the XRD patterns of the various catalysts are shown in Figs 2.4(b) and 2.5(b).
The diffractograms of the different catalysts show that Pt fcc is the main crystalline phase in the catalysts. However, with the main characteristic feature of the fcc Pt
structure in the catalysts, there is also a small diffraction peak at around 340
attributed to PtSn(9:1)/C and PtSnPd(8:1:1)/C catalysts. This which could be
indexed to the tetragonal structure of SnO2 with the (101) plane (JCPDS File No.
41-1445). Also, the (110) diffraction peak of SnO2 at around 270 overlaps with the (002)
diffraction peak of carbon support, which probably induces the enhancement intensity of carbon support in the XRD patterns of PtSn(9:1)/C and PtSnPd(8:1:1)/C catalysts as compared to the other catalysts. Furthermore, the existence of platinum and/or tin oxide micro crystals cannot be ruled out, because these oxides may present in an amorphous state in the catalysts which could not be detected by XRD.
![Table 2.8: Crystallographic data for Pt and Sn phases as adapted from ref. [93]](https://thumb-eu.123doks.com/thumbv2/123doknet/8052857.269958/62.892.109.732.134.355/table-crystallographic-data-pt-sn-phases-adapted-ref.webp)
![Figure 2.14: HRTEM analysis of PtSn/C catalyst, showing likely core-shell Pt and SnO 2 structure (a) PtSn 2 structures at [111] zone axis (b)](https://thumb-eu.123doks.com/thumbv2/123doknet/8052857.269958/66.892.182.588.107.773/figure-hrtem-analysis-catalyst-showing-likely-structure-structures.webp)
![Figure 2.15: (a) HRTEM analysis of PtSn/C catalyst, showing PtSn 2 structures at [233] zone axis (b) EDX spectrum taken from the selected nanoparticle in the PtSn/C catalyst](https://thumb-eu.123doks.com/thumbv2/123doknet/8052857.269958/67.892.174.789.364.642/figure-analysis-catalyst-structures-spectrum-selected-nanoparticle-catalyst.webp)