Maisonnave: Post Doc Fellow, Economics Department, University of the Free State [email protected]
Cahier de recherche/Working Paper 09-36
Does South African Affirmative Action Policy Reduce Poverty? A CGE
Analysis
Hélène Maisonnave
Bernard Decaluwé
Margaret Chitiga
Abstract:
This paper presents a computable general equilibrium model (CGEM) able to measure
the impacts of the affirmative action policy set up in South Africa. In order to decrease
inequalities inherited from the former regime, the government encourages firms to
employ Historically Disadvantaged Persons (HDP). Through this study, we evaluate the
impact of this policy on employment, poverty and inequality. To evaluate impacts on
poverty and inequality, we use a CGE Top Down approach. The paper analyses two
scenarios; the first one deals with the impact of affirmative action on skilled jobs. The
second scenario adds to the previous by including semi skilled workers in the simulation.
Both of these scenarios show a deep decrease in unemployment as well as a fall of
poverty for each population groups.
Keywords: Computable general equilibrium model, top down analysis, South Africa,
poverty, inequality, labor market
1 INTRODUCTION
After the collapse of the Apartheid regime, South Africa faces difficult issues, notably in the labour market and on poverty levels. Indeed, during this regime, the labour market was racially organised, skilled labour was reserved for White people, and unskilled labour for other population groups, in particular African. This segmentation on the labour market has led to huge inequality and poverty differences among the population. Aware of this situation, the South African government committed itself to decrease inequalities in the labour market, and proposed in 1998 the Employment Equity Act, an incentive for firms to hire Historically Disadvantaged Persons (HDP) as skilled workers. What are the implications of changing skilled shares for firms? Does the setting of this policy lead to a decrease in terms of poverty and inequality levels?
This paper analyses the impacts of this affirmative action policy on labour market and poverty and inequality using a Computable General Equilibrium Model (CGEM). We focus on the impacts of this policy on economic growth and income distribution. To capture impacts on poverty and inequality levels, we use a Top Down approach.
Four sections follow this introduction. First, relevant information explaining the South African context is presented, followed by a brief review of the South African CGEM. The CGE model results are then presented. A final section concludes.
2 APARTHEID LEGACIES: A SEGMENTED LABOUR MARKET AND STRONG POVERTY AND INEQUALITY DIFFERENCES AMONG
POPULATION
Under the Apartheid regime, race was the relevant factor to obtain a skilled job. Whites were systematically advantaged compared to other
population groups. This segmentation was reinforced by several laws4. With
the end of the regime, discriminatory laws were abolished. However, as shown in Burger and Woolard (2005), the South African labour market is faced with
long run effects of an inadequate education system5, international isolation,
and firms’ capital intensive policies.
One of the main issues in South Africa is the high levels of unemployment whether defined broadly or narrowly. In 2003, 30% of the active population was unemployed according to the strict definition, whereas 42% was unemployed if we use the broad one, (Kingdon and Knight, 2005). These rates are not uniform among population groups. Indeed, the White
4
See Van der Berg and Bhorat (2001) for an historical review.
5
The education system was also racially organized: Whites could attend the best schools whereas other population group studied in poor quality schools. Thus the system created very few skilled workers and a lot of unskilled workers. South Africa suffers now from skills shortage.
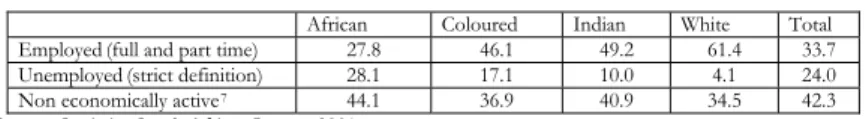
unemployment rate (4.1%) is nearly seven times lower than African’s (Table 1). Unemployment is a structural issue in South Africa because there is a mismatch between an excess of unskilled workers, and a shortage of skilled people, that firms are looking for.
Table 1: Status of people aged 15-65 years old on the labour market by population group in 20016(%)
African Coloured Indian White Total Employed(full and part time) 27.8 46.1 49.2 61.4 33.7 Unemployed(strict definition) 28.1 17.1 10.0 4.1 24.0
Non economically active7 44.1 36.9 40.9 34.5 42.3
Source: Statistics South Africa, Census, 2001
The South African labour market has not created enough jobs between 1995 and 2004, and thus, it was not able to absorb the labour force growth. Indeed, Oosthuizen (2006) shows that the South Africa economy did not create enough jobs. Moreover, Pauw et al (2008) show that unemployment for skilled jobs has increased due to the mismatch of students’ skills and what firms look for.
According to Kingdon and Knight (2005), unemployment rate has increased between 1995 and 2003 for each population group. Oosthuizen (2006) explains this increase as being due to the high propensity for the population to enter the labour market and the weak job creation.
In the same study, Kingdon and Knight (2005) estimate that in 1995, an African person was around 30 percentage points more likely to be unemployed than a White person with the same characteristics. This probability has risen by 6.5 percentage points in 2003 (Kingdon and Knight (2005)).
Burger and Jafta (2006) analyse the employment gap for population groups between 1995 and 2003. They find that White-Black employment gap increased strongly between 1995 and 2000 and then stabilised. They use the Oaxaca-Blinder technique to decompose this gap and find that unexplained component did not decline in the post apartheid period. They suggest that the fact that there is no decrease in the unexplained component could mean that affirmative action is not really successful in reducing discriminatory practices. However, they moderate their finding by explaining the important role for the quality of education.
The post apartheid government has implemented a series of remedial measures, notably an affirmative action policy to reduce inequalities in the labour market and the Black Economic Empowerment (BEE) that aims for a better distribution of productive capital8.
6
As our SAM is based on 2001, we will focus on this year.
7
Includes students, the retired and people that choose not to work
8
In 2004, government decided to go further because changes were very slow in the labour market. It created a scorecard where firms that have good results in the scorecard can apply for government offers. These offers represent 12% of the South African GDP, (Lettre d’Afrique du Sud et Australe, French Trade Commission, (April, 2007)). To have a good mark in the scorecard, a firm has to have equitable ownership which includes previously disadvantaged people, and to have a significant proportion of black persons in the executive management. Employment equity component is another part of the scorecard. Thus, not being compliant with the law means losing an opportunity to get government offers.
Moreover, the situation in the labour market has direct implications on poverty and inequality levels. As pointed out by Burger and Jafta (2006), there is a persistent association between race and poverty. Indeed, Africans are still poorer that other population groups.
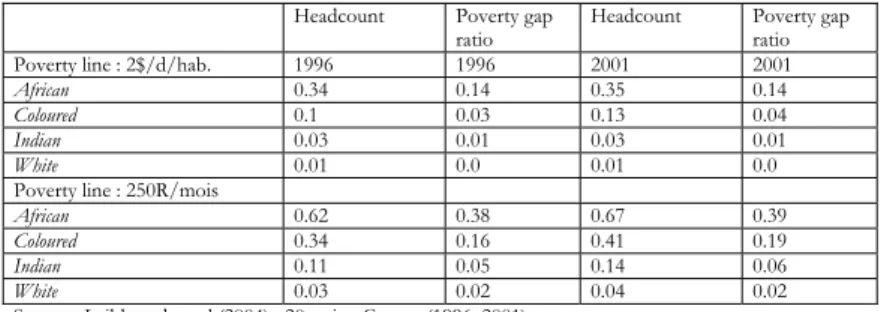
Leibbrandt et al (2004) show an increase of poverty between 1996 and 2001, whatever the poverty line chosen (Table 2). Van der Berg et al (2005) have shown that poverty has recently declined due to the increase of government subsidies, but remains at a high level. Chitiga and Mabugu (2007) compute poverty levels using a low poverty line (322R/m/h) and a high
poverty line9 (593R/m/h), and they find respectively a headcount of 52.6 and
70.4.
Table 2 : Poverty levels by population groups:
Headcount Poverty gap ratio Headcount Poverty ratio gap Poverty line : 2$/d/hab. 1996 1996 2001 2001
African 0.34 0.14 0.35 0.14
Coloured 0.1 0.03 0.13 0.04
Indian 0.03 0.01 0.03 0.01
White 0.01 0.0 0.01 0.0
Poverty line : 250R/mois
African 0.62 0.38 0.67 0.39
Coloured 0.34 0.16 0.41 0.19
Indian 0.11 0.05 0.14 0.06
White 0.03 0.02 0.04 0.02
Source : Leibbrandt et al (2004)p.20, using Census (1996, 2001)
Leibbrandt et al (2004) also find that the inequality level has risen between 1996 and 2001. Hoogeveen and Ozler (2004) and Seekings et al (2004) find results in the same direction. Seekings et al (2004) focus on the fact that intra group inequality has risen, whereas inter group inequality has declined as shown in Table 3.
Table 3 : Gini coefficients’ in households income repartition, 1995-2000
9
Hoogeven and Ozler (2004) find that an appropriate poverty level for South Africa is between this space
1995 2000 African 0.56 0.61 White 0.44 0.46 Coloured 0.50 0.55 Indian 0.47 0.5 Total 0.65 0.69
Source: Census data from Whiteford and Van Seventer (2000) and Income and Expenditure Survey (2000), and Seekings et
al (2004) (pg 11)
As we can see, poverty and inequality levels remain very high. Poverty and inequalities levels are greater for the African group. The government believes that in order to decrease these levels, it is necessary to facilitate its policies of Affirmative Action. This paper investigates to what extend the government policy of Affirmative Action, specifically, employing HDP, decreases inequality and poverty in South Africa.
3 LITERATURE REVIEW
Many CGE models have been built for the South African economy, but to our knowledge, no one deals with affirmative action issues. Most of the models contribute to analysing the impact of trade liberalisation or world price negative shock impacts. Thus, Gelb et al (1992) developed a dynamic one sector CGEM to evaluate the impact of a negative external shock and the setting of a program of government stimuli. Moreover, many experts of the World Bank have developed CGEM (Van der Mensbrugghe (1995, 2005), Devarajan and Van der Mensbrugghe (2000)) to understand the impacts of trade liberalisation and increases in public spending. Thurlow and Van Seventer (2002) propose a standard CGE modelling framework for South Africa.
Cockburn et al (2005) evaluate gender discrimination on labour market after trade liberalisation. They develop a CGE that takes into account household’s home production. They find that trade liberalisation has a better impact on men’s salaries than on women’s, due to the sectoral employment repartition. Thurlow (2006) finds that trade liberalisation has affected men and women differently and that it has worsened inequality in the country.
Heraut (2005) analyses the impact of trade liberalisation using all the information contained in household’s survey. He finds that whatever the
closure, neoclassical or Keynesian, trade liberalisation seems to be pro-poor.
Employment creation in the formal sector seems to be the cause of this decrease on poverty. In terms on inequality, intra group inequalities decrease whereas inter group increase.
McDonald and Van Schoor (2005) and Essama-Nssah et al. (2007) use a CGE macro-micro framework to understand the structural and distributional consequences of oil price increases for South Africa. Fofana et al. (2007) follow this approach and show that oil price increases would have negative effects on the economy and welfare.
Chitiga and Mabugu (2007) analyse the impact of protection in textile sector on poverty levels, using a dynamic micro simulation CGEM. They find that increasing protections in this sector is not good for the whole economy, welfare decreases and poverty increases.
4 DATA USED
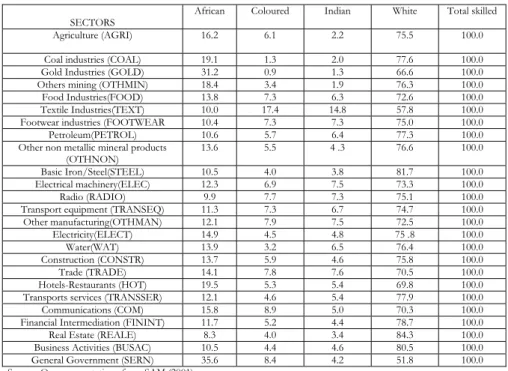
We use the same Social Accounting Matrix as Cockburn et al (2005) based on 2001 data. We took the same elasticity and Frisch parameter as them. To calibrate unemployment rates, we use the Labor Force Survey (2001). Given our specific study, we present in Table 4 the disaggregation of skilled workers by race for each activity. Analysing this Table, we find that except in the government sector, White workers represent the main share of skilled labour. Indeed, their share is between 66.6% in gold sector and 84.3% in real estate. In the government sector, the difference between races is less important, Africans represent 35.6% of total skilled workers and Whites 51.8%. What we want to analyse is an increase of these share for each population group except White in the first scenario.
Table 4 : Skilled labour disaggregation by race for 2001
SECTORS African Coloured Indian White Total skilled Agriculture (AGRI) 16.2 6.1 2.2 75.5 100.0 Coal industries (COAL) 19.1 1.3 2.0 77.6 100.0 Gold Industries (GOLD) 31.2 0.9 1.3 66.6 100.0 Others mining (OTHMIN) 18.4 3.4 1.9 76.3 100.0 Food Industries(FOOD) 13.8 7.3 6.3 72.6 100.0 Textile Industries(TEXT) 10.0 17.4 14.8 57.8 100.0 Footwear industries (FOOTWEAR 10.4 7.3 7.3 75.0 100.0
Petroleum(PETROL) 10.6 5.7 6.4 77.3 100.0 Other non metallic mineral products
(OTHNON) 13.6 5.5 4 .3 76.6 100.0 Basic Iron/Steel(STEEL) 10.5 4.0 3.8 81.7 100.0 Electrical machinery(ELEC) 12.3 6.9 7.5 73.3 100.0 Radio (RADIO) 9.9 7.7 7.3 75.1 100.0 Transport equipment (TRANSEQ) 11.3 7.3 6.7 74.7 100.0 Other manufacturing(OTHMAN) 12.1 7.9 7.5 72.5 100.0 Electricity(ELECT) 14.9 4.5 4.8 75 .8 100.0 Water(WAT) 13.9 3.2 6.5 76.4 100.0 Construction (CONSTR) 13.7 5.9 4.6 75.8 100.0 Trade (TRADE) 14.1 7.8 7.6 70.5 100.0 Hotels-Restaurants (HOT) 19.5 5.3 5.4 69.8 100.0 Transports services (TRANSSER) 12.1 4.6 5.4 77.9 100.0 Communications (COM) 15.8 8.9 5.0 70.3 100.0 Financial Intermediation (FININT) 11.7 5.2 4.4 78.7 100.0 Real Estate (REALE) 8.3 4.0 3.4 84.3 100.0 Business Activities (BUSAC) 10.5 4.4 4.6 80.5 100.0 General Government (SERN) 35.6 8.4 4.2 51.8 100.0 Source: Own computations from SAM (2001)
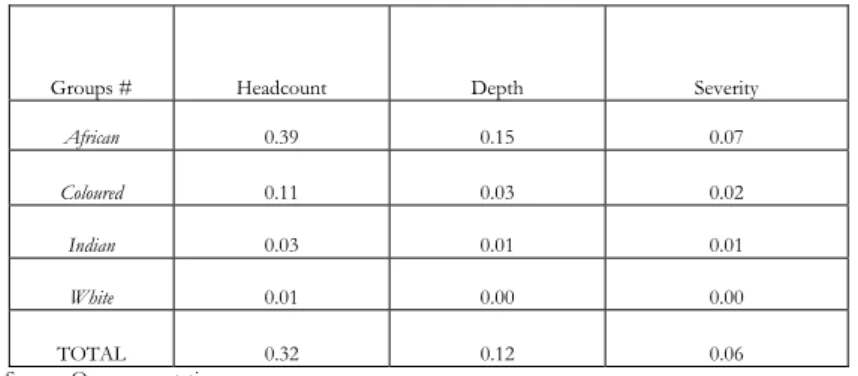
To compute poverty index, we use Foster, Greer and Thorbecke (FGT) (1984) indexes. We take Simkins (2004) poverty line, of 800 rands per household per month. At the base year, we find the indexes indicated in Table 5.
Table 5 : FGT indexes at the base year (2001)
Groups # Headcount Depth Severity
African 0.39 0.15 0.07
Coloured 0.11 0.03 0.02
Indian 0.03 0.01 0.01
White 0.01 0.00 0.00
TOTAL 0.32 0.12 0.06 Source: Own computations
We are also interested in inequality levels. To evaluate this, we use Gini index as well as Theil index. At the base year, we found a Gini index equals to 0.66 for the whole population. Each poverty and inequality index is computed with Distributive Analyse Stata Package DASP, (Arrar and Duclos (2007)).
Table 6 : Theil index at the base year (2001)
Entropy index Within 0.864436 Between 0.289268 TOTAL 1.153704
Source: Own computations
5 THE MODELLING FRAMEWORK
Our model is inspired by the pedagogical model EXTER developed by Decaluwé et al (2001). We have changed some assumptions for this model. First, our model has two production factors, capital and labour, but to take into account South Africa’s specificities, we have disaggregated labour by population group and skill levels so that we end up with twelve different labour categories. Each activity uses both production factors. However, we assume that there is unemployment on each labour market. We also assume that capital is mobile across sectors such that we have a middle run analysis. We have also disaggregated households such that we have households by population groups (African, Coloured, Indian and White). Then, we have specified households’ consumption with a Linear Expenditure System (LES)
of Stone Geary (1954) function, and we assume that transfers between institutions are significant. Finally, we consider that South Africa can not export as much as it wants by introducing an export demand function with determined elasticity.
The CGE model has 25 activities. The production function technology is assumed to be of constant returns to scale and is presented in a five-level production process. At the first level, output is a Leontief input-output of value added and intermediate consumption.
At the second level, a CES function is used to represent the substitution between an aggregate labour and capital.
At the third level, composite labour demand is also a Cobb Douglas function of three different labour skills (skilled, semi skilled and low skilled).
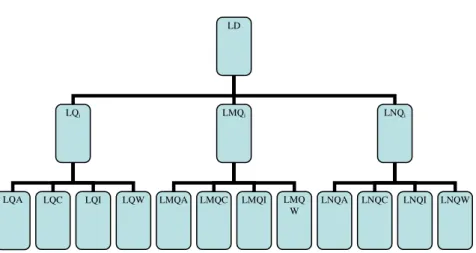
To take into account the South African labour market characteristics, we have disaggregated each sectoral labour demand by population group. We know that, for historical reasons, job opportunities for same skilled level are not the same for a White worker as for another race. This systematic bias does not only answer to economical factors (workers productivity, wage rates etc.). To take into account these elements, we assume that firms keep constant their share of workers given their population group. Thus, in technical terms, we assume that for each skilled level, race composition is determined by a Leontief function. In that way, a skilled White worker can not be a substitute to another skilled worker. These shares are assumed fixed and are the result of social behaviours unexplained by strictly economic factors.
Figure 1 gives the labour market structure.
Figure 1: The labour market structure
LD
LQi LMQi LNQi
LQA LQC LQI LQW LMQA LMQC LMQI LMQ W
LNQA LNQC LNQI LNQW
We know that South Africa is faced with unemployment issues. Actually, unemployment rates are different given population groups and skilled levels. Following Blanchflower and Oswald (1995), we assume that at equilibrium,
there is an equilibrium wage rate compatible with the unemployment rate. The authors show the existence of an empirical relation linking wage rates and unemployment rates. This wage curve is stable econometrically, whatever the country or socio-economic category. The relation shows a negative slope between unemployment rates and wage rates. We will follow this approach for
t, a 10% crease in the unemployment rate leads to a 1% decrease in wages.
of their bacco’s consumption even though it is not essential consumption.
nment income less its consumption and ansfers paid to other institutions.
our twelve labour markets.
Kingdon and Knight (2006) have pointed out a wage curve for South Africa, meaning that wages are decreasing strongly when unemployment rate increase. They find the same result as OECD countries, and specifically tha
in
As we mentioned previously, we have four households. The model distinguishes three sources of income, labour income (salaries and wages), capital income and transfers income from institutional sectors (households, firms, government and rest of the world) .Household’s income is composed of different labour income and transfers received from other institutions. Note that African households are the only ones who receive transfers from other population groups. Available households’ income is equal to households’ income net of income taxes and transfers paid to other institutions. Households’ savings is a fixed proportion of its available income, adjusted by an adjustment variable. This adjustment variable is added to assure savings investment equilibrium. In other words, if an agent’s savings is decreasing, the adjustment will come from households. They are forced to save (or dis save). Household sectoral consumption is modelled by a Linear Expenditure System and subject to its budget constraint. Consequently, sectoral consumption depends on total consumption, specified minimum consumption levels and the vector of consumer prices. Minimum consumption represents the volume of a product that a household wants to maintain to keep its standard living unchanged, Decaluwé et al (2001). This minimum reflects habits of the household and corresponds to consumption needs that are not affected by price changes. For instance, smokers can have a minimum level
to
Firm’s income is equal to their share in sectoral capital incomes plus transfers from other institutions. After paying income tax and transfers to other institutions, the remaining income constitutes firm’s savings. Government income is composed of direct taxes paid by households and firms, indirect taxes on domestic sales, import tariffs, transfers from the rest of the world and a share of capital income. Government consumption spending is on the non tradable sectors’ production (in volume) multiplied by their prices. Government savings is equal to gover
tr
The relationship between the rest of the world and the domestic economy is determined by the substitutability between imported and domestic goods on
the consumption side, and by the substitutability between the domestic and international markets on the production side. The relative prices of foreign goods determine the allocation of supply and demand between the domestic and international markets. To qualify exports and imports behaviour, we use the traditional approach of CGE modelling. We assume that South Africa is a small open economy, meaning that it does not have any influence on world
rices.
is represented by a Constant Elasticity of Transformation (CET)
by ports and transfers paid abroad, net of exports and transfers received.
that transfers between institutions are exogenous, as well as factors
s income or in its real consumption will lead to an crease in its welfare.
6 RESULTS OF THE POLICY -1: Affirmative action applied to skilled workers:
p
The model allows for imperfect substitution in consumption and production between domestic and foreign goods. Consumers have a choice between local or imported products. Their choices are specified by a Constant Elasticity of Substitution (CES) function following the Armington assumption. This function specifies that products are not perfectly substitutable, and that strong quality differences can exist depending on where the product is from. The substitution elasticities vary across sectors, with lower elasticities reflecting greater differences between domestic and imported goods. The demand for imports relative to domestically produced goods is derived from cost minimization subject to the CES function. Substitution possibilities exist also between production for domestic or foreign markets. This decision of producers
function.
We have assumed that South Africa is a small country. However, we reject the hypothesis that South Africa has an infinite exports demand for its products. Indeed, we assume that South African producers can’t sell as much as they want on international markets. To sell more on these markets, South African producers will have to be more competitive than other producers. Thus, export supply is constrained by export demand, which is assumed to have a finite elasticity, reflecting the competitiveness of local products on the international market. Finally, the current account balance is obtained im
We assume that the real exchange rate is our numeraire. Then, world prices are fixed, following the assumption that South Africa is a small country. We assume
supply.
To capture the impact of affirmative action policy on poverty and inequality, we assume that the current account balance is fixed, as well as total investment in volume as well as government production in volume. In that case, an increase in household’
in
The aim of the simulation is to find the impact of an increase of the shares of historically disadvantaged people in skilled positions. We increase African’s skilled share by 10%, and both Coloured and Indian by 5% each. As we have shown in Table 4, initial shares of these three population groups were very low.
Due to this policy, we expect skilled labour demand to increase for each population group except for White. Indeed, the results show that labour demands for HDP increases, with the amount depending on sector. We can point out that increases in government and gold sectors are less important in terms of magnitude than in other sectors. Actually, as we have already mentioned, the shares of HDP in these two sectors were not as low as in other sectors. The impact on White skilled labour demand is surprising. One expects a decrease in the demand but we find that skilled labour demand for Whites increases except in government and gold sectors. However, the decrease in these two sectors is such that total labour demands for skilled White decreases (-0.17%). Total skilled labour demand increase by 0.68%. Semi skilled total labour demand and unskilled labour demand increase respectively by 0.22% and 0.26%. This leads to an increase in total labour demand, of 0.37%.
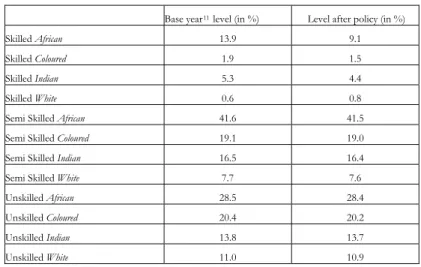
These impacts on the labour demand also have consequences on unemployment and wages for workers. Unemployment rates are decreasing,
except for White skilled workers, and wages follow the opposite direction10.
Table 7: Impact on unemployment rates
Base year11 level (in %) Level after policy (in %)
Skilled African 13.9 9.1
Skilled Coloured 1.9 1.5
Skilled Indian 5.3 4.4
Skilled White 0.6 0.8
Semi Skilled African 41.6 41.5 Semi Skilled Coloured 19.1 19.0 Semi Skilled Indian 16.5 16.4
Semi Skilled White 7.7 7.6
Unskilled African 28.5 28.4 Unskilled Coloured 20.4 20.2 Unskilled Indian 13.8 13.7 Unskilled White 11.0 10.9
10
At the base year, all wages are equal to one, meaning we have indexes of wage. We do not take into account the differential in productivity between workers nor differential in their wages
11
Unemployment rates at the base year are calibrated using the Labour Force Survey (2001)
For instance, unemployment rate for African skilled workers falls by 9.1%, which is a huge decrease. If we consider sectoral wages, we would not be surprised that sectoral wages for unskilled and semi skilled are increasing. However, skilled sectoral wage is decreasing, due to the strong decline of the White wage.
We know that labour demand is increasing in most of the sectors, so we can expect an increase in production leading, ceteris paribus, to an imbalance on the goods market. Production is indeed increasing in all sectors except gold and government. Due to initial shares (higher than in others) in the gold sector, this policy is expensive for the gold sector that has to fire people. For the government sector, we assume that its production is constant in volume. This imbalance on the goods market leads to a decrease in producer prices. Due to the production increase in most of the sectors, and the decrease of producer local price, it is relatively more attractive for producers to export their production. Actually, only the gold sector is decreasing its exports (-0.21%), due to the decrease of its production. Thus this policy boosts supply. We expect households’ income to increase. As explained above, it is composed of transfers and incomes from production factors. Households consumption is increasing as well as direct taxes paid to government. Firms also see their income increasing, because of the increase of capital rate of return. Government’s income is increasing due to the increases of direct taxes received and taxes on products. Its saving increases by 0.3%.
We assumed that households savings were linked to an adjustment variable in
order to realise investment-savings equilibrium12, in case one agent’s savings
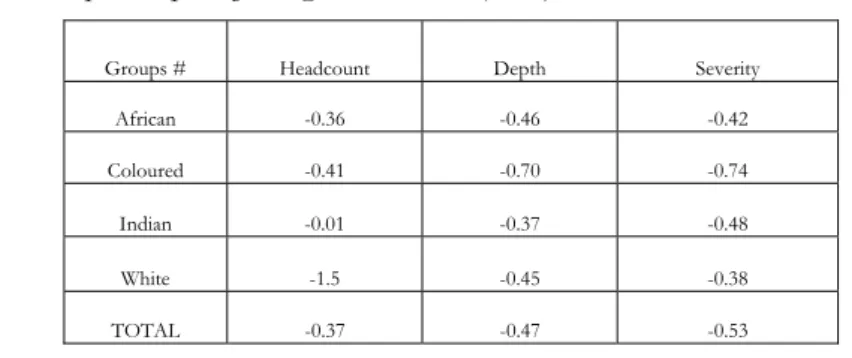
would decrease. Here, each institution’s savings is increasing (or constant for foreign savings), so households’ saving is decreasing. Households’ welfare is increasing, due to the rise of their income and the decline of prices. If we look at Table 8, we find that poverty decreases for each population group. However, Gini and Theil indexes are slightly increasing.
Table 8 : Impact on poverty using FGT indexes (en %)
Groups # Headcount Depth Severity
African -0.36 -0.46 -0.42 Coloured -0.41 -0.70 -0.74 Indian -0.01 -0.37 -0.48 White -1.5 -0.45 -0.38 TOTAL -0.37 -0.47 -0.53
12
Gini and Theil indexes both increase by 0.01%. Within group inequality contributes 0.864413 and between group 0.289397. Within group poverty has slightly decreased whereas between groups poverty has increased.
6-2: Affirmative action applied on skilled and semi skilled workers:
In this scenario, we are interested to analyse what would be the effects of a stronger affirmative action policy. We analyse an increase of 5% of African semi skilled share, combined with the previous scenario. Knowing that unemployment rate for semi skilled Africans is relatively high, we expect this policy to have stronger effects on poverty and inequality.
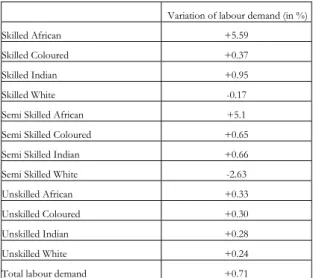
On total labour demand, the impact of this policy is stronger than in the previous scenario; total labour demand increases by 0.73%. As shown in Table 9, consequences of this policy on labour demand are very positive. All labour demands are increasing except skilled white and semi skilled white but that was expected.
Table 9: Impact on labour demands
Variation of labour demand (in %) Skilled African +5.59
Skilled Coloured +0.37 Skilled Indian +0.95 Skilled White -0.17 Semi Skilled African +5.1 Semi Skilled Coloured +0.65 Semi Skilled Indian +0.66 Semi Skilled White -2.63 Unskilled African +0.33 Unskilled Coloured +0.30 Unskilled Indian +0.28 Unskilled White +0.24 Total labour demand +0.71
Due to the increase of total labour demand, we expect that unemployment rates are decreasing. Compared to the previous scenario, decreases in unemployment rates are deeper.
Table 10: Unemployment rates
Base year Scenario 2 Skilled African 13.9 9.1 Skilled Coloured 1.9 1.5 Skilled Indian 5.3 4.4
Skilled White 0.6 0.8 Semi Skilled African 41.6 38.6 Semi Skilled Coloured 19.1 18.6 Semi Skilled Indian 16.5 15.9 Semi Skilled White 7.7 10.1 Unskilled African 28.5 28.3 Unskilled Coloured 20.4 20.2 Unskilled Indian 13.8 13.6 Unskilled White 11.0 10.8
Wages will follow the opposite direction to unemployment rates for each labour category as expected. As far as sectoral wages are concerned, unskilled mean sectoral wage is increasing, whereas both semi skilled and skilled sectoral wages are decreasing. Indeed, for these two categories, the decline in White wage leads to a decline in the mean sectoral wage. For skilled, it is more the initial repartition that leads to a fall, whereas for semi skilled, it is the deep decrease of white wages (-2.63%). In terms of production, we expect the same effects as in the previous scenario: production is rising except for gold sector (-0.28%) whose increases in African wages are too important. In most of the sectors, prices are decreasing.
Concerning institutions, household’s income is increasing, and so is their consumption expenditure. They benefit from an increase of their income and also from a decrease of local prices. They will increase their consumption, as well on local and foreign markets.
Government’s income is increasing (+0.38%) due to the rise of direct, indirect and import taxes. Moreover, it reduces its current deficit.
What are the impacts of this reinforced affirmative action policy on poverty and inequality levels? As shown in Table 11, poverty is decreasing more in this scenario for each population group.
Table 11: Impact on poverty
Groups # Headcount Depth Severity
African -0.58 -0.69 -0.68 Coloured -1.37 -1.03 -1.09
Indian -0.01 -0.99 -0.70 White -1.67 -0.65 -0.58 TOTAL -0.60 -0.70 -0.80
Gini coefficient increases very slightly, but a little more than in the previous scenario. This result is reinforced by Theil index; which is also increasing.
Within group inequality decreases but between group inequality increasing more such that total inequality is rising.
7 CONCLUSION AND POLICY RECOMMENDATIONS
The paper estimated the effects of the affirmative action policy both on unemployment rates, poverty and inequality levels in South Africa. It presented two scenarios, the first one deals with a better repartition of skilled workers in each activity, improving historically disadvantaged peoples’ shares. The second scenario adds to this policy an increase of African semi skilled shares in each activity.
Results found show that this policy is very encouraging in terms of unemployment and poverty reduction, two main problems in South Africa. Indeed, unemployment rates are decreasing for most of the labour categories as jobs are created. These findings are stronger in the second scenario. In terms of poverty, FGT computations show that poverty is decreasing for each population group, and the decrease is deeper in the second scenario. There is however a very slight increase of inequality.
REFERENCES
ARRAR, A. and DUCLOS, J.Y. (2007). DASP: Distributive Analysis Stata Package, Laval University, World Bank, PEP and CIRPEE.
BLANCHFLOWER, D.G. and Oswald A.J, (1995). An Introduction to the Wage Curve, The Journal of Economic Perspectives.9 (3): 153-167.
BURGER, R. and JAFTA, R. (2006). Returns to Race: Labour market, Discrimination in Post Apartheid South Africa, Stellenbosch Economic Working
Paper
BURGER, R. and WOOLARD, I. (2005). The state of the labour market in South Africa after the first decade of democracy, CSSR, WP n° 133.
CHITIGA, M and MABUGU, R. (2007). La protection du secteur des textiles et la pauvreté en Afrique du Sud: une analyse en équilibre général calculable dynamique micro-simulé, Cahier de recherche MPIA n°1, PEP, Université Laval COCKBURN, J. (2001). Trade liberalization and Poverty in Nepal: A CGE Micro Simulation Analysis, WP 01-18, CREFA, Université Laval
COCKBURN, J., FOFANA, I., DECALUWE, B., CHITIGA, M., and MABUGU, R. (2005). A Gender Aware Macroeconomic Model for Evaluating Impacts of Policies on Poverty Reduction in Africa: The Case of South Africa, WP, Université Laval
DECALUWE, B., MARTENS, A. and SAVARD, L. (2001). La politique économique du développement et les modèles d’équilibre général calculable,
Les Presses de l’Université Montréal, Canada
DEVARADJAN, S. and Van Der Mensbrugghe, D. (2000). Trade Reform in South Africa: Impacts of Households, Mimeo, The World Bank, Washington
ESSAMA-NSSAH, B., GO, D., KEARNEY, M., KORMAN, V.,
ROBINSON, S. and THIERFELDER, K. (2007)
Economywide and Distributional Impacts of an Oil Price Shock on the South African Economy. Policy Research Working Paper 4354, Washington D.C.: The World Bank. FOFANA, I., MABUGU, R. and CHITGA, M. (2007). Oil Prices and the South African Economy: Macro-Meso-Micro Modelling Approach, Report Prepared for the Financial and Fiscal Commission, South AfricaFOSTER, J., GREER, J., and THORBECKE, E. (1984). A class of Decomposable Poverty Measures. Econometrica, 52: 761-765
GELB, S., B.GIBSON, B., TAYLOR, L., and VAN SEVENTER, J.(1992). Modeling the South African Economy- Real Financial interactions, Macro Economic Research Group, Working Paper
HERAULT, N. (2005).
Building and linking a microsimulation model to a CGE Model: The South African Microsimulation Model, Centre d’Economie duDéveloppement, Bordeaux
HOOGEVEEN, J.G. and OZLER, B. (2004). Not separate, not equal : Poverty and inequality in post apartheid South Africa, Mimeo, Washington DC, World Bank
KINGDON, G. and J. KNIGHT, J. (2006). How flexible are wages in response to local unemployment in South Africa? Industrial and Labour Relations
Review, 59(3) : 471-495
KINGDON, G. and J. KNIGHT, J. (2005). Unemployment in South Africa, 1995-2003, CSAE Working Paper
LEIBBRANDT, M., NAIDOO, P., WELCH, M. and WOOLARD, I. (2004). Measuring recent Changes in South African Inequality and poverty using 1996 and 2001 Census Data, CSSR, WP n°84, University of Cape Town
LETTRE D’AFRIQUE DU SUD ET AUSTRALE (2007) Mission économique de Johannesburg, avril 2007.
MC DONALD, S. and VAN SCHOOR, M. (2005). A Computable General Equilibrium (CGE) Analysis of the Impact of an Oil Price Increase in South Africa, PROVIDE Project Working Paper, 2005:1
OOSTHUIZEN, M. (2006). The post apartheid labour market: 1995-2004,
DPRU Working Paper 06-103, Cape Town
PAUW, K., OOSTHUIZEN, M. and VAN DER WESTHUIZEN, C. (2008). Graduate unemployment in the face of skills shortages: a labour market paradox, South African Journal of Economics, 76(1) : 45-57
SEEKINGS, J., LEIBBRANDT, M. and NATTRASS, N. (2004). Income inequality after apartheid. CSSR, WP n° 75
SIMKINS, C.E.W. (2004). What happened to the distribution of income in South Africa between 1995 and 2001? Unpublished draft (on line www.sarpn.org)
STATISTICS SOUTH AFRICA, (2002). Census 2001, Pretoria, South Africa. STATISTICS SOUTH AFRICA (2001). Labor Force Survey, South Africa. STONE, R. (1954). Linear Expenditure System and Demand Analysis : An application to The Pattern of British Demand. Economic Journal, 64 :521-527 THURLOW, J. (2006). Has Trade liberalization in South Africa affected men and women differently? DSGD Discussion Paper No 36, International Food
Policy Research Institute, Washington
THURLOW, J. and VAN SEVENTER, D. (2002). A standard Computable General Equilibrium Model for South Africa, TMD Discussion Paper No 100, International Food Policy Research Institute, Washington
VAN DER BERG, S. and BHORAT, H. (2001). The present as a legacy of the Past: The labour market, Inequality and Poverty in South Africa, DPRU Working Paper 01-29
VAN DER BERG, S BURGER, R., LOUW, M. and YU, D. (2005). Trends in poverty and inequality since the political transition, Stellenbosch Economic
Working Paper, 01-05
VAN DER MENSBRUGGHE, D. (2005). Prototype Model for Single Country Real Computable General Equilibrium Model, Development Prospects Groups, World Bank
VAN DER MENSBRUGGHE, D. (1995). Technical description of the World Bank CGE of the South African Economy, Unpublished Rapport, OECD Development Center, Paris
WHITEFORD, A. and VAN SEVENTER, D. (2000). Understanding Contemporary Households Inequality in South Africa. Studies in Economics and Econometrics, 24(3):7-30.