Journal Pre-proof
Use of grinded hardened cement pastes as mineral addition for http://google.fr/ mortars
Mohamed ElKarim Bouarroudj, Sébastien Rémond, David Bulteel, Guillaume Potier, Frederic Michel, Zengfeng Zhao, Luc Courard
PII: S2352-7102(20)33496-3
DOI: https://doi.org/10.1016/j.jobe.2020.101863 Reference: JOBE 101863
To appear in: Journal of Building Engineering
Received Date: 10 June 2020 Revised Date: 2 October 2020 Accepted Date: 2 October 2020
Please cite this article as: M. ElKarim Bouarroudj, S. Rémond, D. Bulteel, G. Potier, F. Michel, Z. Zhao, L. Courard, Use of grinded hardened cement pastes as mineral addition for http://google.fr/mortars,
Journal of Building Engineering, https://doi.org/10.1016/j.jobe.2020.101863.
This is a PDF file of an article that has undergone enhancements after acceptance, such as the addition of a cover page and metadata, and formatting for readability, but it is not yet the definitive version of record. This version will undergo additional copyediting, typesetting and review before it is published in its final form, but we are providing this version to give early visibility of the article. Please note that, during the production process, errors may be discovered which could affect the content, and all legal disclaimers that apply to the journal pertain.
Author statement
Mohamed Elkarim Bouarroudj : Conceptualization, Methodology, Acquisition, Writing
original draft. Sébastien Rémond: Methodology, Funding, Acquisition, Supervision,
Writing-review and editing. David Bulteel : Funding, Acquisition, Writing-Writing-review and Editing. Guillaume
Potier: Data curation, Resources. Frederic Michel: Writing-review and editing. Zengfeng Zhao:
Writing-review and editing. Luc Courard: Funding, Acquisition, Writing-review and Editing
Use of grinded hardened cement pastes as mineral addition for
mortars
Mohamed ElKarim Bouarroudja,b*, Sébastien Rémondc, David Bulteela, Guillaume Potiera, Frederic Michelb, Zengfeng Zhaob, Luc Courardb
a
Univ. Lille, IMT Lille Douai, ULR 4515 - LGCgE, Laboratoire de Génie Civil et géo-Environnement, F-59000 Lille, France
b
University of Liège, Urban and Environment Engineering, ArGEnCo Department, GeMMe Building Materials, Liège, Belgium
c
Univ Orléans, Univ Tours, INSA CVL, LaMé, EA 7494, France E-mail : bouarroudj.mohamedelkarim@gmail.com
Postal address : 764 Boulevard Lahure, 59500 Douai
Abstract
Recycled Concrete Aggregates (RCA) are not enough used in the construction sector due to their high porosity and water absorption capacity. Fine particles which are composed of large amounts of attached hardened cement paste are even more difficult to valorize, while they could be used as mineral admixture in mortar or concrete. The objective of this work is to find a recovery track for this material as mineral addition. The use of a porous powder as mineral admixture in cementitious mortars raises the question of the effective water definition in such systems. Two powders are used, the first one is a grinded hardened cement paste (porous), and the second one is a limestone filler (non-porous). A comparison of the hydration degree, porosity, fresh, and hardened behaviors between cement pastes and mortars manufactured with the two powders is carried out. The results show that the porosity of the grinded hardened cement paste has an impact on the properties of cementitious materials. Depending on the studied properties (fresh or hardened properties), the substitution of cement by the porous powder could be done with, or without taking into account the water absorption. Taking into account the water absorption allows maintaining the fluidity of the mixture but decreases significantly the compressive strength for cement replacement percentages larger than 20%.
Keywords : Effective water, mineral addition, Recycled concrete aggregates, water absorption, and porosity
1.
Introduction
In the last decades, reducing the CO2 emissions has become a challenge to face. The construction sector is
responsible for 25% of the total CO2 emissions, amongst which no less than 5-8% come from the
manufacture of cement [1]. The CO2 emissions produced during the cement fabrication are caused not
only by the energy needed for the calcination of the raw material (40% of the total emission) but also by the decarbonation of calcite [2]. Replacing part of the clinker by mineral additions such as limestone filler,
fly ash… can be a good way to reduce CO2 emissions. Substituting part of cement by industrial
by-products in the manufacture of concrete also reduces CO2 emissions[3,4].
Using construction and demolition wastes (CDW) as a substitution of clinker can be a good way to reduce CO2 emissions and can be also an alternative material in the construction sector to preserve natural
resources. Recycled concrete aggregates (RCA) represent a significant part of the CDWs. Comparing to natural material, RCAs have a higher water absorption (between 4 and 12%) and a lower density (between 2.1 and 2.5 g/cm3) [5] due to the adherent hardened cement paste. The coarse fraction of RCA is easier to valorize than the finer one in the construction sector. Up to now, research on RCA has been more focused on using RCA as aggregates in concrete production [6-8] than for manufacturing cement [9,10] or as a mineral addition in concrete production [11,12].
Oksri-Nelfia et al. [11] studied the influence of partial substitution of cement by grinded recycled concrete aggregate on mortar and concrete properties. The results show that the volume of cement could be replaced up to 25% without altering the properties of mortars. In a similar study, Bordy et al. [12] made a substitution of Portland cement by grinded recycled cement paste. The results show that the substitution does not provide any additional filler effect and nucleation sites in comparison to limestone filler. Neither Oksri-Nelfia et al.[11], nor Bordy et al.[12], take into consideration the eventual water absorption of the grinded recycled fine aggregate.
Many research works quantified the water absorption (WA) coefficient of the coarse fraction of RCA [13-15].But none of them were interested to measure the WA of the finer fraction of RCA (<500µm). De Juan et al.[16] showed that when the size of RCA decreases, the content of attached cement paste increases. Due to the fact that the attached cement paste is porous, the WA in RCA is proportional to that hardened cement paste content. Zhao et al. [17] and Le et al.[18] showed that standard EN 1097-6 [19] or IFSTTAR protocol [20] to measure the WA can only be used for particles larger than 0.5mm, due to agglomeration effects between the finer particles [21,22]. Up to know only Bouarroudj et al.[23,24] proposed a method to estimate the WA of finer particles (< 500µm) based on a theoretical approach. This method takes into account the particle size distribution of the powder and the pore size distribution of the monolith (the coarse material before grinding into a powder) by mercury intrusion porosimetry. According to the size of pores and the size of grains, the theoretical model computes the remaining porosity of the powder.
Effective water in concrete is generally defined as the quantity of water that is present in the cement paste, that is to say the amount of water that will be available for cement hydration[25,26]. However, this definition can be questioned if a porous powder is added or substituted to cement in the paste. In that case, the quantity of water present in the paste includes the water that might be absorbed by porous particles. However, it is no more equivalent to the amount of water that will be available for cement hydration, as the water absorbed in the fine particles will not be available (or much less available) than the one present in the intergranular space. The main goal of this paper is to study the effect of the porosity of a grinded hardened cement paste (GHCP) on the hydration and the fresh and hardened behaviors of a cementitious material. Cement pastes and mortars are manufactured by substituting a given volume of cement by a corresponding volume of GHCP. The latter corresponds either to the absolute volume of GHCP (i.e. the solid volume only, excluding any accessible pore inside the powder) or the envelop volume of the GHCP (i.e. the solid volume and the volume of intra granular porosity). A comparison is made with limestone filler (LF), which is considered as a non-porous powder.
The paper is organized as follows. First the preparation of GHCP and its characteristics are presented in part 2. The comparison between the hydration degree and porosity of hardened cement pastes manufactured with GHCP and LF is presented in part 3. In part 4, the mortars composition and the fresh and hardened properties of mortars are presented. Finally, the conclusions and perspectives are formulated in part 5.
2.
Materials characterization
2.1
Materials
The used cement is a CEM I 52.5N from CBR Belgium, complying with standard EN 197-1. The LF is provided by Carmeuse Belgium. According to the technical document provided by the manufacturer, the porosity of the original limestone from which the LF is produced is 1% (measured on the monolith limestone according to standard EN 1097-6 [19]). So, in this research the LF is considered as a non-porous powder. The GHCP is produced from a cement paste having a water to cement ratio of 0.5. To insure a good homogenization during the fabrication of cement paste, the half quantity of cement is first added to the water and mixed for 90 seconds, after that the second part is added and 90 seconds of mixing are performed. Thereafter, the fresh cement paste is poured in 1 liter hermetic plastic bottles. The cement paste is gently vibrated to minimize the presence of air bubbles. In the end, the fresh cement paste is sealed and rotated during 6 hours in order to avoid segregation and bleeding during setting. The hardened cement paste (HCP) is hydrated during 90 days in closed containers to insure a high hydration degree as reported in the literature [27].
The HCP is crushed in two phases, firstly with a jaw crusher with an opening size of 8mm and secondly with a ball mill in order to obtain a fine powder with dimensions lower than 200 µm, and having a close particle size distribution to that of LF. Several crushing steps of 15 minutes with the ball mill have been done. The PSD has been controlled after each step using laser granulometry in liquid phase with ultra-sonic (to avoid agglomeration). This method allows controlling the d10% and d50% (diameter of 50% and
10% passing). Sieving particles at 200 µm allows controlling the d90% (diameter of 90% passing).
Having close particle size distributions between the two powders (LF and GHCP) facilitates the comparison by limiting the geometric differences.
2.2 Characterization protocol
The characterization procedure is carried out in two steps: firstly, on the monolithic material (particle sizes between 4mm and 20mm), and secondly on the grinded material.
Two characterization tests are carried out on the crushed HCP (4/20 mm):
- First, the water absorption is determined according to standard EN 1097-6 [19]. For this test, the aggregate is immersed in water for 24 hours, after that the surface water is removed with dry paper, and the surface dry mass of the aggregate is recorded (Mssd). The aggregate is placed in an
oven until constant mass (Mdry). For each sample, this test is carried out five times to assure a
good repeatability. The water absorption (WA) is computed with (eq.1). The drying temperature for HCP is reduced to 60°C, in order to avoid an excess drying, which would lead to a partial dehydration of hydrates and overestimate the water absorption.
WA= ………….(1)
- The pore size distribution is then measured using Micrometritics autopore IV with a mercury pressure between 0 and 200MPa. Five tests are performed with samples of approximately 1x1x1 cm3. For HCP, the sample is taken in different parts of the material, to verify that HCP is homogenous.
For the grinded powder, the following tests are done:
- The particle size distribution is determined with laser diffraction granulometer (Mastersizer 2000). Because of the anhydrous particles eventually present in GHCP, the laser granulometer test is made with ethanol for both GHCP and LF.
- The remaining intra granular porosity (φ ) of the powder has been computed with the theoretical model developed by Bouarroudj et al. [23,24]. This model is presented with (eq.2) where Rj
corresponds to the radius of grain, ri is the pore radius, is the initial porosity, xi is the volume
fraction of each size of pore, yj corresponds to the volume fraction of each size of grain, and R5%
coresponds to the radius of 5% of the passing particles.
φ = × ∑& $ × ∑! $ + ∑ !"# × (1 − 3 + 3 − )%……… (2)
With ' ' < '"#, *+' , = 1 .+ , = /
!< 0.1547 × 56% 8/9 '!"# ≥ 0.1547 × 56%
- The absolute density (ρa) is measured with helium and water pycnometers. The water absorption
of the powder is then computed with (eq.3), and the real density (ρ) is obtained with (eq.4). WA = ; φ
<×(# φ )……….. (3)
ρ = ρa× (1 − φ )………. (4)
- The water demand comparison between GHCP and LF is carried out by making different slump flow tests (S) using different water to powder ratios [28] (mini-cone, h=60 mm, d= 70 mm, and D= 100 mm). The results are presented by plotting the relative flow (R) calculated from (eq.5) as a function of the ratio of the effective water and the volume of powder ==>
? (for GHCP, the volume of powder is presented with and without considering the intra granular porosity). [28] demonstrated that, for pastes made with any particular powder, the water to powder volume ratio and the relative flow are linear and can be presented with (eq.6). Where βp is considered as
comprising the water needed to fill the voids in the powder system and provide sufficient disposal of the particles(water demand), and Ep is the deformation coefficient depending on the used
powder.
R=@ABABA……..(5)
=>
=? = βp+R.Ep……….(6)
2.3 Experimental results and discussion
Table 1 presents the initial porosity, absolute density (ρa), and real density (ρ) obtained with the MIP on
the monolith HCP. In the same table, the water absorption obtained according to the EN 1097-6, and the absolute density obtained with the helium and water pycnometers are also presented.
The absolute density measured with helium pycnometer is higher than the one measured with MIP, this difference is due to the fact that the absolute density with helium is measured on a grinded material, which is not the case with MIP. A small difference is observed between the absolute density measured with helium and water, which could mean that almost all the porosity present in the material is accessible to water.
The porosity and absolute density measured with water are higher than those measured with MIP. This can be explained by the fact that the porosity accessible to water is larger than the one accessible to mercury (with a maximum pressure of 200MPa).
Table 1: Absolute density (with helium and water), Water absorption, average porosity computed and measured using MIP, and real density. Standard deviations are computed from 5 replicates on HCP or
GHCP.
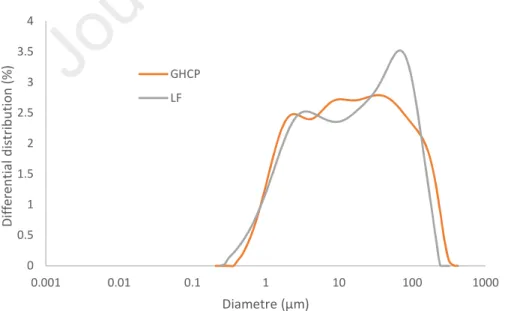
Figure 1 presents the particle size distributions (PSD) of GHCP and LF, and figure 2 presents the pore size distribution of HCP, both figures have the same x-axis scale. The average diameter of pores for HCP is 0.07µm. The crushing procedure of HCP allows a close PSD between LF and GHCP. The average diameter of the GHCP and LF is about 20µm.
Figure 1: Particle size distributions of GHCP and LF determined by laser diffraction.
0 0.5 1 1.5 2 2.5 3 3.5 4 0.001 0.01 0.1 1 10 100 1000 D if fe re n ti a l d is tr ib u ti o n ( % ) Diametre (µm) GHCP LF ρa helium (g/cm3) ρa water (g/cm3) WA EN 1097-6 (%mass) Water accessible Porosity (%vol) ρ water (g/cm3) ρa MIP (g/cm3) Porosity MIP (%vol) ρ MIP (g/cm3) 2.4 ±0,01 2.39 ±0.02 30 ±0.4 42 ±1.1 1.4 2.12 ±0.01 25.9 ±0.8 1.57
Journal Pre-proof
Figure 2: Pore size distribution of the HCP determined by MIP.
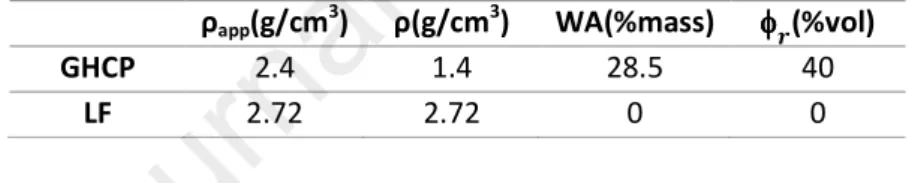
Table 2 presents the characteristics of GHCP and LF. The porosity of GHCP is computed with (eq.3). A small difference is observed between the porosity obtained in HCP and the one computed for GHCP. This result is attributed to the fact that the size of particles is much higher than the size of pores (comparison between figure 1 and figure 2). The WA and the real density are computed respectively with (eq.4) and (eq.5).
Table 2: Absolute density, computed porosity, water absorption and real density of GHCP and LF
ρapp(g/cm3
) ρ(g/cm3) WA(%mass) φφφφC(%vol)
GHCP 2.4 1.4 28.5 40
LF 2.72 2.72 0 0
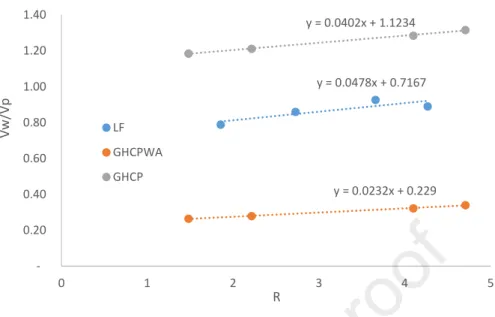
Figure 3 presents the relative flow (R) as function of the water to powder volume ratio made with LF and GHCP with and without considering the intra granular porosity of GHCP. The βp (water demand) for LF,
GHCP and GHCPWA are respectively 0.71, 0.23 and 1.12. It’s shown that when the porosity is not considered for GHCP the βp (water demand) is higher than the one of LF. However, the water demand of
LF is higher than the one of GHCPWA. Given the close PSDs and morphological characteristics of the two powders, the difference on the water demand can be attributed mainly to the agglomeration.
0 10 20 0.001 0.01 0.1 1 10 100 1000 D if fe re n ti a l d is tr ib u ti o n ( % ) Diametre (µm)
Journal Pre-proof
Figure 3: comparison between βp (water demand) of pastes made with GHCP and LF. GHCP WA
presents the result where the intra granular porosity is considered.
3.
Hydration degree and porosity of cement pastes with GHCP
and LF
3.1
Methodology and experimental procedure
To identify the influence of GHCP and its porosity on cement hydration in comparison to LF, cement pastes are manufactured with LF and GHCP. This part is carried out on pastes to simplify the studied systems.
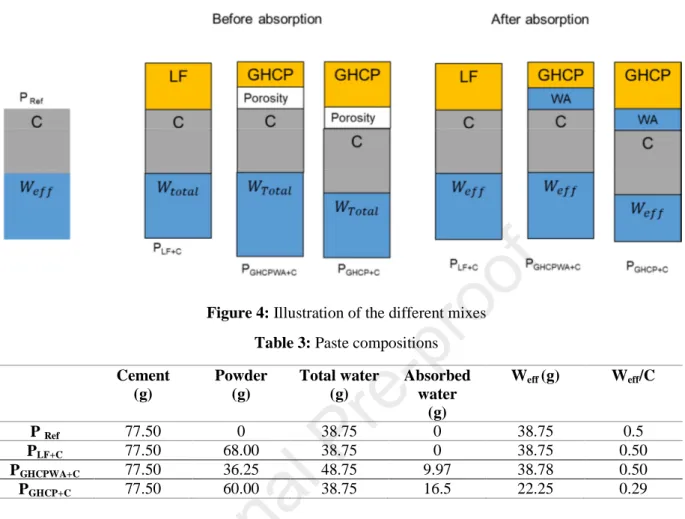
Figure 4 presents the principle adopted for cement pastes composition. The mixes with mineral addition (LF and GHCP) are manufactured by adding the later with a volume corresponding to 50% of the cement volume of the reference mix. For the pastes made with GHCP, the addition is carried out in two different ways. Firstly, the envelope volume of grains is considered, and the added volume is computed with the real density (the porosity and water absorption of the powder are considered here). Secondly, the absolute volume is considered, where the porosity and the WA are not taken into consideration (only the solid volume). These different mixtures are prepared in order to study the impact of the mineral addition porosity on the hydration of cement.
Thermo Gravimetric Analyses (TGA) and mercury intrusion porosity tests (MIP) have been carried out on the different pastes at different ages (1, 2, 7 and 28 days) in order to identify the hydration degree and the porosity of the different pastes, and make the comparison between the one manufactured with GHCP and LF with those manufactured without mineral addition (reference mix). Table 3 presents the compositions of the manufactured cement pastes.
y = 0.0478x + 0.7167 y = 0.0232x + 0.229 y = 0.0402x + 1.1234 0.20 0.40 0.60 0.80 1.00 1.20 1.40 0 1 2 3 4 5 V w /V p R LF GHCPWA GHCP
Journal Pre-proof
Figure 4: Illustration of the different mixes Table 3: Paste compositions Cement (g) Powder (g) Total water (g) Absorbed water (g) Weff (g) Weff/C P Ref 77.50 0 38.75 0 38.75 0.5 PLF+C 77.50 68.00 38.75 0 38.75 0.50 PGHCPWA+C 77.50 36.25 48.75 9.97 38.78 0.50 PGHCP+C 77.50 60.00 38.75 16.5 22.25 0.29
To ensure a good homogeneity for the pastes, a mini mixer where only 200 ml can be produced is used. The followed steps are:
- Add all the amount of water in the mixer,
- Add the first half of the powders (cement + mineral addition),
- Mix for 90 seconds,
- Stop the mixer for 30 seconds, and add the second part of the powders,
- Mix for 90 seconds.
The paste is poured into small hermetic containers (15ml). Each container is rotated for 6 hours in order to avoid segregation and bleeding of cement pastes during setting [29]. The obtained paste is stored in hermetic containers at 20°C for 1, 2, 7 and 28 days. Then, the hardened paste is cut into small pieces (1x1x1 cm3) and immersed in isopropanol for 1 week to stop the hydration of cement[30,31]. After that, the paste is dried at 40°C until constant mass and put in sealed bottles to avoid any carbonation or rehydration.
3.2
Hydration degree
To estimate the hydration degree of the cement mixtures, the quantity of Portlandite produced at a given time and the maximum quantity of Portlandite that can be produced during the complete hydration of the cement are needed.
3.2.1 Quantification of Portlandite produced for total hydration of the cement
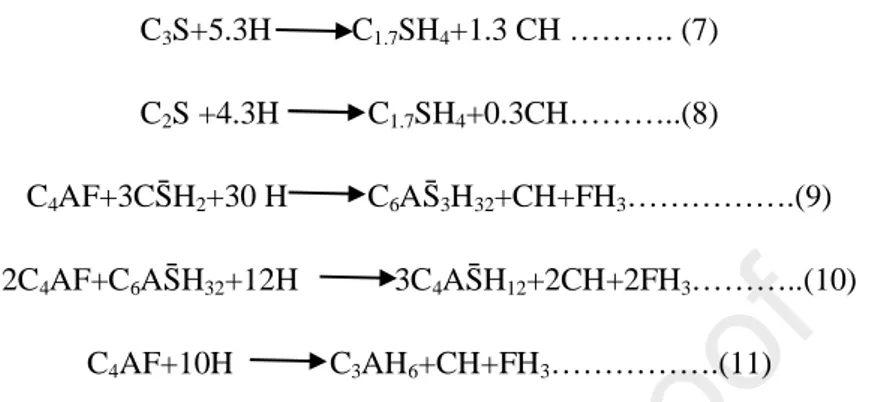
According to [32-38] the simplified reactions that produce Portlandite from ordinary Portland cement (OPC) are presented in (eq.7), (eq.8), (eq.9), (eq.10) and (eq.11). The amount of Portlandite formed is identical for the 3 hydration equations of C4AF.
C3S+5.3H C1.7SH4+1.3 CH ………. (7)
C2S +4.3H C1.7SH4+0.3CH………..(8)
C4AF+3CS̄H2+30 H C6AS̄3H32+CH+FH3……….(9)
2C4AF+C6AS̄H32+12H 3C4AS̄H12+2CH+2FH3………..(10)
C4AF+10H C3AH6+CH+FH3……….(11)
Table 4 shows the composition of the used cement obtained by XRF combined with Bogues method. The percentage mass of Portlandite produced for each phase is calculated. The total amount of obtained Portlandite for the total hydration of the cement is equal to 0.294g/g of anhydrous cement.
Table 4: Portlandite production for a complete hydration of cement Anhydrous
phases
Mass content in cement (%)
CH mass per unit of anhydrous phase
(g/g cement)
CH mass for 1 gram of anhydrous cement (g/g cement) C3S 61.9 0.42 0.261 C2S 11.2 0.13 0.014 C3A 6 0 0 C4AF 12 0.15 0.018
3.2.2 Portlandite quantification for the different mixes at different ages
TGA analysis is used in order to quantify the Portlandite produced in the different mixes. The samples are heated up to 1000°C in a platinum crucible at 10°C/min, under argon. The mass variation is due to dehydration of hydrates and decarbonation of calcite.
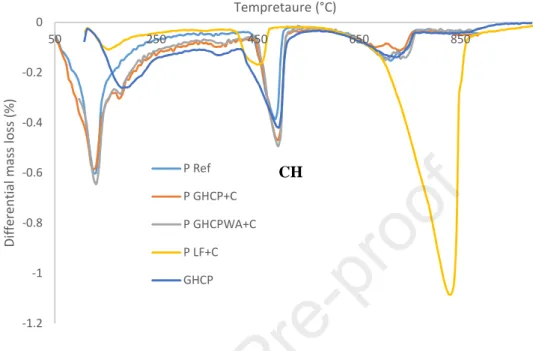
Figure 5 presents the obtained TGA results for pure GHCP and the different pastes after 1 day of hydration. Three peaks are observed. The first peak corresponds to the dehydration of C-S-H, the second one to the dehydration of Portlandite and the last one corresponds to the decarbonation of CaCO3. It is
noted that the PGHCP WA+C has the highest peak for Portlandite compared to the other mixtures (pastes
manufactured with LF and GHCP). The PGHCP WA+C and PGHCP+C mixtures have larger Portlandite amounts
than the PLF+C mixture. A peak of CaCO3 is also observed for the different mixtures. The PLF+C mixture has
a large CaCO3 peak compared to the GHCP, PGHCP+C and PGHCP WA+C due to the fact that LF is essentially
composed of CaCO3. A small peak of CaCO3 is obtained for GHCP, this can be explained by the fact that
a part of the cement paste has been carbonated. The carbonation of the different pastes has been limited by making the TGA tests directly after stopping hydration. The obtained peaks of CaCO3 in PGHCP+C and
PGHCPWA+C are therefore caused by the former carbonation of GHCP and not by the carbonation of
newformed hydration products.
Figure 5: TGA results for GHCP and different mixtures after 1 day of curing
Equation 12 (eq.12) is used in order to calculate the Portlandite quantity (CH(t)total) for the different
mixtures. Where DEF$6°H 6I$°H (%) is the mass loss of samples between 405°C and 560°C obtained with TGA results. MCH is the molar masse of Portlandite (74.09 g/mol) and MH2O is the molar mass of water
(18g/mol).
CH(t) total =J!KLM° NOMPL° N× NQ
QAR ……. (12)
For the PGHCP WA+C and PGHCP+C mixtures, the amount of Portlandite brought by the GHCP is subtracted
from the total quantity in order to only take into account the neo-formed Portlandite (CH (t)neo-formed)
(eq.13) where mGHCP and mC are respectively the mass of GHCP and cement. (eq.14) is used to compute
the quantity of neo-formed Portlandite for 1 gram of cement (CH(t)neo-formed/g cement).
CH(t)neo-formed=CH(t)total–CHGHCP×!!TQNU
TQNU"!N...(13)
CH(t)neo-formed/g cement= CH(t)neo-formed×!N"!V WX <Y <! Z RW
N ……….(14)
3.2.3 Degree of hydration
The calculation of hydration degree is presented according to the cement quantity in the mixture and is computed with (eq.15), where CH (t)neo-formed/gcement corresponds to the quantity of neo-formed Portlandite
produced at time t (1, 2, 7 and 28 days) for 1 g of cement. CHC total is the amount of total Portlandite that
can be produced if 1 gram of cement is 100% hydrated [36-38].
-1.2 -1 -0.8 -0.6 -0.4 -0.2 0 50 250 450 650 850 D if fe re n ti a l m a ss l o ss ( % ) Tempretaure (°C) P Ref P GHCP+C P GHCPWA+C P LF+C GHCP CH
Journal Pre-proof
α = H\(])^_`Oa`bc_d/fg_c_^h
H\NZRZ<Y ………..(15)
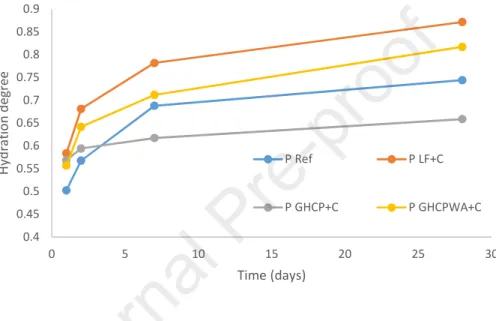
The results of the degrees of hydration are presented in figure 6. The reference mixture presents a lower degree of hydration at early ages compared to those made with GHCP and LF. Thus, the addition of GHCP and LF accelerates the hydration of cementitious pastes. The PGHCP WA+C mixture has a lower
hydration degree at 1, 2, 7 and 28 days than PLF+C. The PGHCP+C presents a high hydration degree at 1 day,
but its further hydration is less compared to other cement pastes, which can be explained by the fact that the PGHCP+C mixture has a low Weff/C ratio (0.27).
Figure 6: Hydration degree of the different mixes
3.3
Porosity measurement
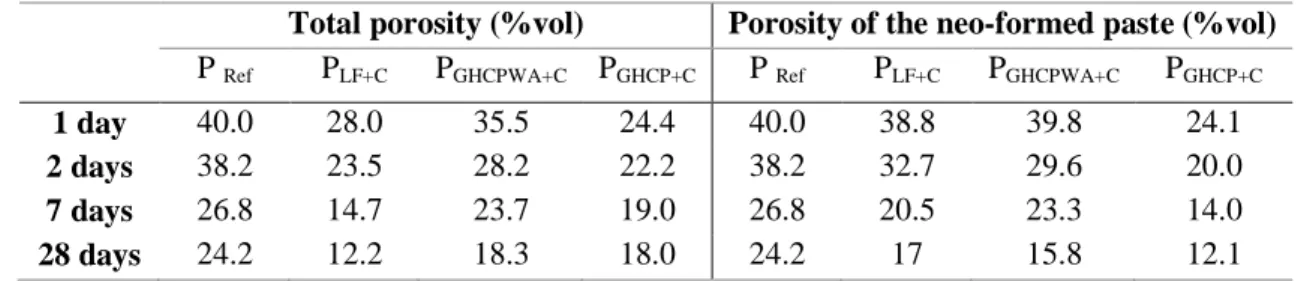
The porosity of the different mixes is measured by Mercury Intrusion Porosimetry (MIP) at 1, 2, 7 and 28 days. Table 5 presents the obtained results. The porosity has been corrected for the different mixes in order to compute the porosity of the neo-formed cement paste, excluding that of the mineral addition. (eq.16) is used to make the porosity corrections, where φneo-formed presents the porosity of the neo-formed
cement paste, PTotal is the total porosity obtained with MIP , φ powder is the porosity of the mineral addition,
and Vpowder, VWeff and Vcement are respectively the volume of mineral addition, effective water, and cement.
φneo-formed = (φtotal – φpowder×= =?R> X
?R> X "=N"=iXjj)× (=?R> X "=N"=iXjj) (=?R> X "=N) ………(16) 0.4 0.45 0.5 0.55 0.6 0.65 0.7 0.75 0.8 0.85 0.9 0 5 10 15 20 25 30 H y d ra ti o n d e g re e Time (days) P Ref P LF+C P GHCP+C P GHCPWA+C
Journal Pre-proof
Table 5: Porosity of the different mixes
Total porosity (%vol) Porosity of the neo-formed paste (%vol) P Ref PLF+C PGHCPWA+C PGHCP+C P Ref PLF+C PGHCPWA+C PGHCP+C
1 day 40.0 28.0 35.5 24.4 40.0 38.8 39.8 24.1 2 days 38.2 23.5 28.2 22.2 38.2 32.7 29.6 20.0 7 days 26.8 14.7 23.7 19.0 26.8 20.5 23.3 14.0 28 days 24.2 12.2 18.3 18.0 24.2 17 15.8 12.1 It is noted, for the mixtures before correction, that the reference mixture and PGHCP WA+C present the highest
porosity whatever the ages. The lowest porosity is obtained for PLF+C.
After correction, the PGHCP WA+C mixture has a similar porosity comparing to the PLF+C mixture, which is
due to the fact that the Weff/C is similar for the two mixes (Weff/C=0.5). Despite the fact that the reference
mixture has the same Weff/C ratio than PLF+C and PGHCP WA+C mixes, a higher porosity comparing to the
PLF+C and PGHCP WA+C mixture is obtained. This can be explained by the fact that the hydration degree of the
mixes made with LF and GHCP is higher than the reference one. The PGHCP+C presents the smallest
porosity. This is due to the Weff/C ratio, which is smaller than the other mixes (0.27). The porosity results
are in accordance with the hydration degree results.
Thus, we can conclude that the water present in the paste is not the same as the water available to cement hydration when porous mineral addition are used. Moreover, the addition of GHCP into a cementitious mixture can accelerate the one day hydration of the cement. Also the GHCP has an impact on the hydration degree and the total porosity of the manufactured mixes by decreasing the amount of available water for the cement hydration. The next step of this work is to study the effect of adding GHCP on mortar properties.
4.
Fresh and hardened behavior of mortars with GHCP and LF
4.1
Methodology and experimental procedure
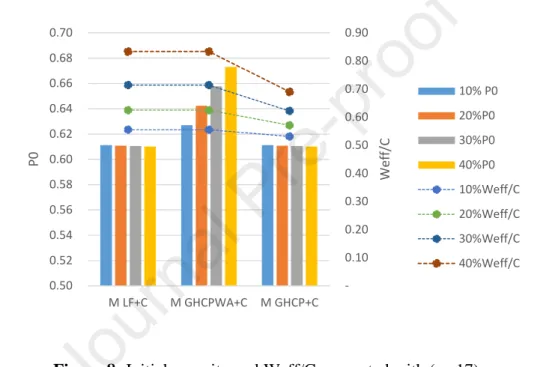
In order to identify the effect of the GHCP porosity on fresh and hardened behaviors of mortar, the calculation of the total porosity is needed. The initial porosity of the mixture is presented with (eq.17) in which Weff, Vpore, Vpowder, Vair and Vc are respectively the effective water, the pore volume of the powder,
the solid volume of the powder, the volume of air in mortar, and the cement volume: P0 == =kR
ZRZ<Y =
lXjj"=?R X"=<
lXjj"=?R> X "=?R X"=N"=< ……….(17)
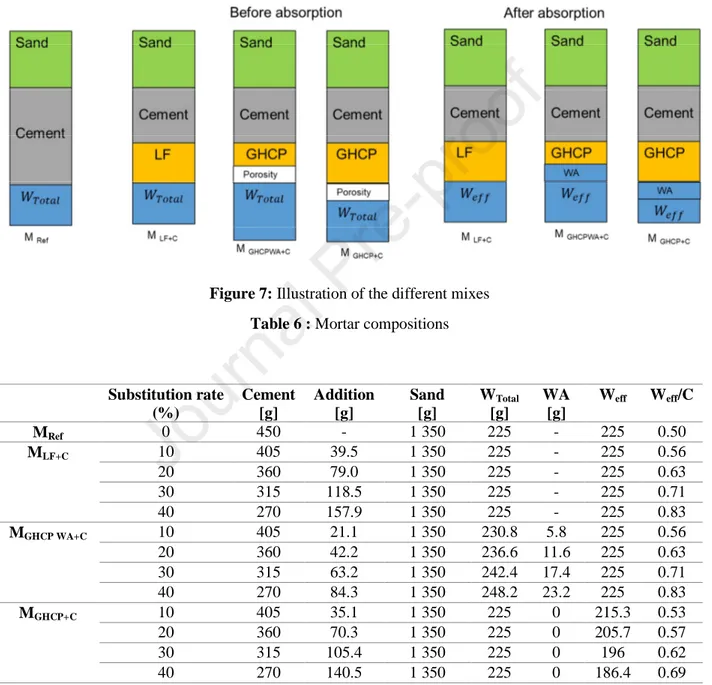
Mortar compositions are made with a volume substitution of cement by GHCP and LF, the following mixes are made:
- MLF+C: volume substitution of the cement by LF at 10, 20, 30 and 40% by using the absolute
density
- MGHCP WA+C: volume substitution of the cement by GHCP at 10 ,20 ,30 and 40% by using the real
density
- MGHCP+C: volume substitution of the cement by GHCP at 10, 20, 30 and 40% by using the absolute
density.
The mortar compositions are presented in table 6. The reference composition complies with standard EN 196-1. Figure 7 illustrates the followed approach to study the fresh and hardened behavior for the different mortars.
Figure 7: Illustration of the different mixes Table 6 : Mortar compositions
Substitution rate (%) Cement [g] Addition [g] Sand [g] WTotal [g] WA [g] Weff Weff/C MRef 0 450 - 1 350 225 - 225 0.50 MLF+C 10 405 39.5 1 350 225 - 225 0.56 20 360 79.0 1 350 225 - 225 0.63 30 315 118.5 1 350 225 - 225 0.71 40 270 157.9 1 350 225 - 225 0.83 MGHCP WA+C 10 405 21.1 1 350 230.8 5.8 225 0.56 20 360 42.2 1 350 236.6 11.6 225 0.63 30 315 63.2 1 350 242.4 17.4 225 0.71 40 270 84.3 1 350 248.2 23.2 225 0.83 MGHCP+C 10 405 35.1 1 350 225 0 215.3 0.53 20 360 70.3 1 350 225 0 205.7 0.57 30 315 105.4 1 350 225 0 196 0.62 40 270 140.5 1 350 225 0 186.4 0.69
Journal Pre-proof
Figure 8 presents the initial porosities computed with (eq.17), the air volume is considered equal to 0. The mix MLF+C presents a similar porosity to the mix MGHCP+C. This is due to the fact that in the latter the water
absorption is not taken into account, and the solid volume of GHCP is equal to that of LF. A difference is observed between the mix MGHCP WA+C and both MLF+C and MGHCP+C. This difference is due to the water
absorption which is considered in the added water in MGHCP WA+C.
In the following, the fresh and hardened behavior comparison is made with MLF+C, MGHCPWA+C and
MGHCP+C. Given the porosity of GHCP, the effective water and the solid volume of GHCP between
MGHCPWA+C and MGHCP+C are not the same. This procedure allows: first to make a comparison between LF
and GHCP using the same effective water and envelope volume and second to make a comparison using the same initial porosity of mortar made with LF and GHCP.
Figure 8: Initial porosity and Weff/C computed with (eq.17)
The mixing of the different mortars is 4 minutes long. The cement, addition and all the water are first mixed at low speed for 30 seconds; thereafter the sand is introduced gradually for 30 seconds. An additional mixing of 30 seconds at low speed is then performed. Subsequently, the bowl is scraped for 15 seconds, followed by 1 minute 15 seconds of rest. Finally, high speed mixing for 1 minute is performed. The mortar’s workability is measured with the MBE cone (“Mortiers de Béton Equivalent’’ that can be translated as ‘‘Equivalent Mortars to Concrete’’) according to the procedure described in [39]. The cone is filled in 3 layers of equivalent volume and each layer is compacted 15 times with the tamping rod. The upper surface of the cone is leveled to remove the excess mortar. The cone is lifted vertically in 3 seconds. The slump is measured by considering the highest point [39].
0.10 0.20 0.30 0.40 0.50 0.60 0.70 0.80 0.90 0.50 0.52 0.54 0.56 0.58 0.60 0.62 0.64 0.66 0.68 0.70 M LF+C M GHCPWA+C M GHCP+C W e ff /C P 0 10% P0 20%P0 30%P0 40%P0 10%Weff/C 20%Weff/C 30%Weff/C 40%Weff/C
Journal Pre-proof
Figure 9: MBE cone [39]
Air content is measured on all mortars with CONTROLS/1L. The compressive strength is determined on 4×4×16 cm3 samples. The samples are demolded after 24 hours and stored under water at 20°C until the day of the test (28 days). The compressive strength is expressed as the mean value of 6 samples as reported in the standard EN 196-1.
4.2
Fresh properties
Figure 10 presents the workability results of mortars made with LF and GHCP as a function of the cement substitution percentage. The workability of the MLF+C is almost constant regardless of the substitution
percentage. For the mix MGHCP+C the slump decreases very rapidly with the substitution rate and becomes
null beyond 30% of substitution, which is due to the absorption of water by GHCP. For the mix MGHCP WA+C, considering the porosity and water absorption of the powder gives a better workability than the
mortar made with LF. The increase in workability of MGHCP WA+C in comparison to MLF+C can certainly be
attributed to different behaviors of the two powders regarding agglomeration (water demand of powders), to physical differences between the powders, and/or to uncertainties in the estimation of the water absorption of GHCP.
Figure 11 shows the results of air content obtained for the different mixtures. It is noted that the air content is slightly higher for mortars made with GHCP compared to those made with LF. However, it can be considered that, considering the water absorption of GHCP does not affect significantly the air content of mortars, but it affects significantly their workability.
These results show that, if the water absorption of the powder is not considered, a sharp decrease in the workability of the mortar occurs as the substitution rate increases, because of the decrease in the interstitial water of the mix. Hence, if one wants to design mixes where GHCP would replace LF without changing too much the workability of the mix, the WA of the substitute powder has to be taken into account.
Figure 10: Slump of the different mixes, in function of the substitution rate
Figure 11: Air content variation in function of the substitution rate for the different mixes
4.3
Hardened properties
Table 7 presents the compressive strengths obtained for the mortars made with LF and GHCP. It’s observed that the mechanical resistance decreases when the substitution rate of GHCP and LF increases. The substitution percentages of cement by GHCP and LF in mortar compositions have been made by the solid and envelope volume. In order to have knowledge about the influence of adding GHCP as a mineral addition, the compressive strengths are compared as a function of the total water (effective + absorbed water) to cement ratio.
Figure 12 presents the variation of compressive strength as a function of the total water (effective water + absorbed water) to cement ratio at 7 and 28 days. The results show close variations of compressive strength for the different samples. So, the compressive strength of mortars mainly depends on the amount of cement (reactive phase of the binder), and initial porosity of the mixes, including the internal porosity of the GHCP. Considering the water absorption in the mix design to compensate for a loss of workability (as stated in the previous section), leads to a decrease in the compressive strength of mortars.
10 20 30 40 50 60 70 80 90 100 0% 10% 20% 30% 40% 50% S lu m p ( m m ) Cement Substitution MLF+C MGHCP+C MGHCPWA+C 0% 1% 2% 3% 4% 5% 6% 7% 8% 0% 10% 20% 30% 40% 50% a ir c o n te n t Cement substitution MLF+C MGHCP+C MGHCPWA+C
Journal Pre-proof
Table 7: Compressive strength (Cs) result of mortars made with LF and GHCP (with and without considering the WA) at 7 , and 28 days
Volumique substitution rate (%) Cs 7 Days (MPa) Cs 28 Days (Mpa) MRef 0 51.5 56.6 MLF+C 10 43.6 46.5 20 36.3 43 30 31.2 38.3 40 24.5 28.3 MGHCP WA+C 10 42.2 45 20 34.5 40.2 30 24.4 28.3 40 16.1 20.2 MGHCP+C 10 39.9 45 20 31.7 38.2 30 25.7 30.9 40 21.6 26.9
Journal Pre-proof
Figure 12: Compressive strength (Cs) results expressed as function of the total water to cement ratio for mortar made with GHCP and LF.
5.
Conclusion
Cementitious mixes manufactured with the grinded hardened cement paste (GHCP) have been compared with others containing limestone filer (LF). The TGA and MIP analyses on pastes showed that both GHCP and LF allow the acceleration of the cement hydration. Also, when using the GHCP, the water present in the paste (effective water) is not the same as the one available for cement hydration due to the absorption of part of the water by fine particles.
Using a constant total porosity makes it possible to obtain equivalent mechanical strengths between the mixtures manufactured with LF and the GHCP. But a worse workability is obtained for the mixes with GHCP. However, if the water absorption is taken into consideration when the cement substitution is proceeded, the workability increases and the mechanical resistance decreases. The decrease of the
10.00 20.00 30.00 40.00 50.00 60.00 0.4 0.5 0.6 0.7 0.8 0.9 1 C s( M P a ) Wtotal/C
7 days
MLF+C MGHCPWA+C MGHCP+C 0 10 20 30 40 50 60 0.4 0.5 0.6 0.7 0.8 0.9 1 C s( M P a ) Wtotal/C28 days
MLF+C MGHCPWA+C MGHCP+CJournal Pre-proof
mechanical strength is caused by the porosity present in GHCP. In fact, the neo-formed porosity of the paste of both MGHCP WA+C and MLF+C are identical, but the total porosity of the MGHCP WA+C increases due to
the porosity of the mineral addition, which makes the compressive strength decrease. Taking into consideration the envelope volume with the absorbed water of GHCP when manufacturing a mortar or concrete seems to be the best recommended procedure. It means moreover that, when using that GHCP in mortar or concrete production, the mixing water should include the effective water (the needed water to hydrate the cement), and the absorbed water by aggregate and GHCP.
In the standard EN 206-1, the limestone filler can be used as a mineral addition to replace cement. The former can be used at a maximum substitution rate of 20% by weight, which corresponds to 23% by volume substitution. If its water absorption is taken into consideration, the use of the GHCP, with similar volume substitution, is clearly possible.
The recycled fine powders from RCA do not contain 100% of hardened cement paste. Other non-porous materials (natural aggregates) that can significantly decrease the porosity are present in RCA. Thus, if the recycled powders from RCA are well characterized, they can be incorporated as a mineral addition in the manufacture of mortar or concrete and the fresh and hardened behaviors of mortar or concrete can be controlled.
Acknowledgment
This research work has been carried out in the frame of the VALDEM project (convention n°1.1.57 of Interreg France-Wallonie-Vlaanderen 2014-2020), partly financed by the European Regional Development Funds and Wallonia.
References
[1] R. Kajaste and M. Hurme, “Cement industry greenhouse gas emissions - Management options and abatement cost,” J. Clean. Prod., vol. 112, pp. 4041–4052, 2016, doi:
10.1016/j.jclepro.2015.07.055.
[2] V. Rompaey, “Etude de la réactivité des ciment riches en laitier, à basse température et à temps court, sans ajout chloruré,” Université Libre de Bruxelles (ULB), 2013.
[3] G. Habert and N. Roussel, “Study of two concrete mix-design strategies to reach carbon mitigation objectives,” Cem. Concr. Compos., vol. 31, no. 6, pp. 397–402, 2009, doi:
10.1016/j.cemconcomp.2009.04.001.
[4] G. Habert and N. Roussel, “Comment concevoir un béton ayant un faible impact
environnemental ?,” XXVIèmes Rencontres Univ. Génie Civ. AUGC 2008, Jun 2008, Fr., 2008. [5] E. Khoury, W. Ambrós, B. Cazacliu, C. H. Sampaio, and S. Remond, “Heterogeneity of recycled
concrete aggregates, an intrinsic variability,” Constr. Build. Mater., vol. 175, pp. 705–713, 2018, doi: 10.1016/j.conbuildmat.2018.04.163.
[6] S. Omary, E. Ghorbel, and G. Wardeh, “Relationships between recycled concrete aggregates characteristics and recycled aggregates concretes properties,” Constr. Build. Mater., vol. 108, no. February, pp. 163–174, 2016, doi: 10.1016/j.conbuildmat.2016.01.042.
[7] M. E. Bouarroudj, S. Remond, F. Michel, Z. Zhao, D. Bulteel, and L. Courard, “Use of a reference limestone fine aggregate to study the fresh and hard behavior of mortar made with recycled fine
aggregate,” Mater. Struct., 2019.
[8] L. Evangelista and J. de Brito, “Mechanical behaviour of concrete made with fine recycled concrete aggregates,” Cem. Concr. Compos., vol. 29, no. 5, pp. 397–401, 2007, doi: 10.1016/j.cemconcomp.2006.12.004.
[9] C. Diliberto, A. Lecomte, J.-M. Mechling, L. Izoret, and A. Smith, “Valorisation of recycled concrete sands in cement raw meal for cement production,” Mater. Struct., vol. 50, no. 2, p. 127, 2017, doi: 10.1617/s11527-017-0996-8.
[10] H. Krour et al., “Incorporation rate of recycled aggregates in cement raw meals,” Constr. Build.
Mater., vol. 248, p. 118217, 2020, doi: 10.1016/j.conbuildmat.2020.118217.
[11] L. Oksri-Nelfia, P. Mahieux, O. Amiri, P. Turcry, and J. Lux, “Reuse of recycled crushed concrete fines as mineral addition in cementitious materials,” Mater. Struct., vol. 49, no. 8, pp. 3239–3251, 2016, doi: 10.1617/s11527-015-0716-1.
[12] A. Bordy, A. Younsi, S. Aggoun, and B. Fiorio, “Cement substitution by a recycled cement paste fine: Role of the residual anhydrous clinker,” Constr. Build. Mater., vol. 132, pp. 1–8, 2017, doi: 10.1016/j.conbuildmat.2016.11.080.
[13] F. Delobel, D. Bulteel, J. M. Mechling, A. Lecomte, M. Cyr, and S. Rémond, “Application of ASR tests to recycled concrete aggregates: Influence of water absorption,” Constr. Build. Mater., vol. 124, pp. 714–721, 2016, doi: 10.1016/j.conbuildmat.2016.08.004.
[14] E. Khoury, B. Cazacliu, and S. Remond, “Impact of the initial moisture level and pre-wetting history of recycled concrete aggregates on their water absorption,” Mater. Struct. Constr., vol. 50, no. 5, pp. 1–12, 2017, doi: 10.1617/s11527-017-1093-8.
[15] A. Z. Bendimerad, E. Roziere, and A. Loukili, “Combined experimental methods to assess absorption rate of natural and recycled aggregates,” Mater. Struct. Constr., vol. 48, no. 11, pp. 3557–3569, 2015, doi: 10.1617/s11527-014-0421-5.
[16] M. S. de Juan and P. A. Gutiérrez, “Study on the influence of attached mortar content on the properties of recycled concrete aggregate,” Constr. Build. Mater., vol. 23, no. 2, pp. 872–877, 2009, doi: 10.1016/j.conbuildmat.2008.04.012.
[17] Z. Zhao, S. Remond, D. Damidot, and W. Xu, “Influence of hardened cement paste content on the water absorption of fine recycled concrete aggregates,” J. Sustain. Cem. Mater., vol. 2, no. 3–4, pp. 186–203, 2013, doi: 10.1080/21650373.2013.812942.
[18] T. Le, S. Rémond, G. Le Saout, and E. Garcia-Diaz, “Fresh behavior of mortar based on recycled sand - Influence of moisture condition,” Constr. Build. Mater., vol. 106, pp. 35–42, 2016, doi: 10.1016/j.conbuildmat.2015.12.071.
[19] E. 1097-6, “Tests for mechanical and physical properties of aggregates – Part 6: Determination of particle density and water absorption .,” 2013.
[20] IFSTTAR. Test Methode No.78, “Tests on granulats in concrte: measurment of total water absorption of crushed sand,” 2011.
[21] M. Strømme Mattsson, P. Hedenus, G. A. Niklasson, and R. Ek, “A new method of characterising liquid uptake within particles over short time periods,” Int. J. Pharm., vol. 199, no. 2, pp. 179–185, 2000, doi: 10.1016/S0378-5173(00)00381-1.
[22] P. Hedenus, M. Strømme Mattsson, G. A. Niklasson, O. Camber, and R. Ek, “Characterisation of
instantaneous water absorption properties of pharmaceutical excipients,” Int. J. Pharm., vol. 202, no. 1–2, pp. 141–149, 2000, doi: 10.1016/S0378-5173(00)00436-1.
[23] M. E. Bouarroudj, S. Remond, A. Grellier, D. Bulteel, F. Michel, Z. Zhao, L.Courard,
“Determination of the porosity of powder: modeling and experimentation,” Subimited to Materials
and structures.
[24] M. E. Bouarroudj, “Utilisation de matériaux naturels modèles pour la formulation de mortier contenant des sables et des fines de granulats recyclés Mohamed Elkarim Bouarroudj To cite this version : HAL Id : tel-02497234 Génie Civil par Mohamed ElKarim Bouarroudj Titre de la,” Ecole nationale supérieure Mines-Télécom Lille Douai; Université de Liège, 2019.
[25] A. . Neville, Properties of concrete. 1988.
[26] David A. Williams, Aaron W. Saaka, and Hamlin M. Jennings, “The influence of mixing on the rheology of fresh cement,” Cem. Concr. Res., vol. 29, pp. 1491–1496, 1999.
[27] M. Frías and J. Cabrera, “Pore size distribution and degree of hydration of metakaolin-cement pastes,” Cem. Concr. Res., vol. 30, no. 4, pp. 561–569, 2000, doi: 10.1016/S0008-8846(00)00203-9.
[28] H.-W. Domone, P.L., Chai, “Testing of binders for high performance concrete,” Cem. Concr. Res., vol. 27, no. 8, pp. 1141–1147, 1997, doi: 10.1016/S0008-8846(97)00107-5.
[29] H. Maimouni, S. Remond, F. Huchet, P. Richard, V. Thiery, and Y. Descantes, “Quantitative assessment of the saturation degree of model fine recycled concrete aggregates immersed in a filler or cement paste,” Constr. Build. Mater., vol. 175, pp. 496–507, 2018, doi:
10.1016/j.conbuildmat.2018.04.211.
[30] J. Zhang and G. W. Scherer, “Comparison of methods for arresting hydration of cement,” Cem.
Concr. Res., vol. 41, no. 10, pp. 1024–1036, 2011, doi: 10.1016/j.cemconres.2011.06.003.
[31] T. Le, G. Le Saout, E. Garcia-Diaz, D. Betrancourt, and S. Rémond, “Hardened behavior of mortar based on recycled aggregate: Influence of saturation state at macro- and microscopic scales,”
Constr. Build. Mater., vol. 141, pp. 479–490, 2017, doi: 10.1016/j.conbuildmat.2017.02.035. [32] W. Chen, “HYDRATION OF SLAG CEMENT,” University of Twente, 2007.
[33] A. Bordy, “Influence des conditions thermo-hydriques de conservation sur l ’ hydratation de matériaux cimentaires à base d ’ une fine recyclée,” Université de Cergy-Pontoise, 2016. [34] V. Baroghel-Bouny, “Caractérisation microstructurale et hydrique des pâtes de ciment et des
bétons ordinaires et à très hautes performances,” L’ECOLE NATIONALE DES PONTS ET CHAUSSEES, 1994.
[35] A. Younsi, “Carbonatation de bétons à forts taux de substitution du ciment par des additions minérales Akli Younsi To cite this version,” UNIVERSITÉ DE LA ROCHELLE, 2012.
[36] H. J. H. Brouwers, “The work of Powers and Brownyard revisited: Part 1,” Cem. Concr. Res., vol. 34, no. 9, pp. 1697–1716, 2004, doi: 10.1016/j.envpol.2008.11.024.
[37] D. P. Bentz and P. E. Stutzman, “Curing, hydration, and microstructure of cement paste,” ACI
Mater. J., vol. 103, no. 5, pp. 348–356, 2006.
[38] W. Deboucha, N. Leklou, A. Khelidj, and M. N. Oudjit, “Hydration development of mineral additives blended cement using thermogravimetric analysis ( TGA ): Methodology of calculating the degree of hydration,” Constr. Build. Mater., vol. 146, pp. 687–701, 2017, doi:
10.1016/j.conbuildmat.2017.04.132.
[39] A. Schwartzentruber and C. Catherine, “La mdthode du mortier de bdton quivalent ( MBE ) - Un nouvel outil d ’ aide h la formulation des bdtons adjuvantds,” Mater. Struct., vol. 33, no. October, pp. 475–482, 2000.
Highlights:
Valorization of grinded hardened cement paste (GHCP) as mineral addition;
Comparison between the hydration degree of paste made with limestone filler and GHCP;
Effect of the intra granular porosity of GHCP in the mechanical performance of mortar;
Highlights:
• Valorization of grinded hardened cement paste (GHCP) as mineral addition;
• Comparison between the hydration degree of paste made with limestone filler and GHCP; • Effect of the intra granular porosity of GHCP in the mechanical performance of mortar;
Conflicts of interest:
The authors declare that they have no conflicts of interest .