WFPC2 Photometry from Subtraction of
Observed PSFs
J. Surdej1,2, S. Baggett3, M. Remy1, M. Wiggs3 October 3, 1997
ABSTRACT
Based on observed PSFs from the WFPC2 calibration programs, a series of PSF subtrac-tion tests have been performed and the resulting photometry analyzed. We find that using a composite observed PSF, constructed from optimally selected PSFs based on location and breathing values, yields single photometric values affected by an RMS of ~0.01-0.02 mag. While resampling does not appear to have much of an effect on the photometric results, the color of the PSF employed is important.
1. Introduction
Subtraction of scaled PSFs from direct CCD images of quasars (or stars) not only offers the possibility of detecting the presence of host or foreground galaxies (or compan-ions like brown dwarfs or planets) but also provides a means of deriving accurate
photometry of the primary objects.
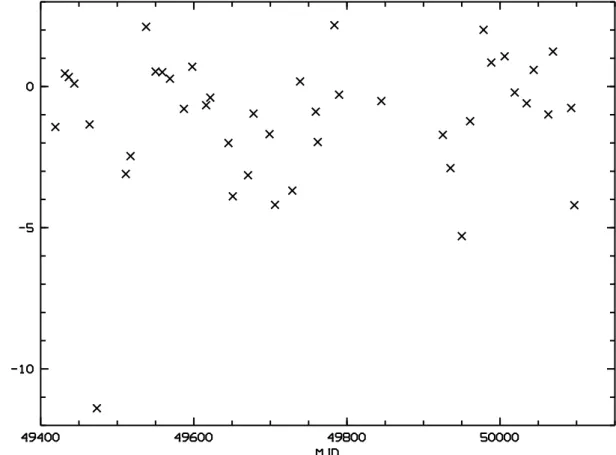
The observations used for the tests described here were taken from the WFPC2 photo-metric monitoring programs; primarily F555W in the PC was used, although separate independent tests were also done with a subset of the F814W and F439W, PC and WF3, images. The target in all cases was the spectrophotometric standard GRW+70D5824, a DA3 white dwarf (V=12.77, B-V=-0.09). Details of the F555W images are provided in the table in Appendix A; tabulated are the image rootname, the PSF positions on the original chip, the row and column position of the PSF in the mosaic frame (see Figure in Appendix A), the date and MJD for the start of the observations, the exposure time (in seconds), the relative defocus of the secondary mirror (in microns) and finally, the X,Y components of coma (in microns) of wavefront error. The relative focus was determined using the phase retrieval code of Krist and Burrows (1995) to reproduce the detailed shape of the observed PSFs; the derived focus positions are illustrated in Figure 1 as a function of Modified
1. Institut d’Astrophysique, Université de Liège, Belgium 2. Research Director (FNRS, Belgium)
Julian Date (MJD). Figure 5 in Appendix A provides a greyscale mosaic of the 43 observed PSFs.
Figure 1: Relative focus positions (in microns) as a function of Modified Julian Date.
In the MIDAS environment, Remy (1996, Ph.D. thesis) has developed a general, auto-matic procedure to derive optimal photometric measurements of (multiple) point sources. A composite PSF is determined by summation of the selected images of the spectrophoto-metric standard regularly observed with WFPC2, after recentering at the same position by bi-quadratic interpolations. Photometric measurements of single observations are then determined by fitting in flux and position the above composite PSF, using a chi-squared minimization method. A description of this automatic procedure may also be found in Remy et al. (1997).
to adequate results provided that it is close in location and focus to the target. However, the use of an observed PSF whose relative focus position differs by 6 microns or more may result in a systematic photometric error that exceeds 0.1 mag.
Composite of 42 Observed PSFs - F555W, PC
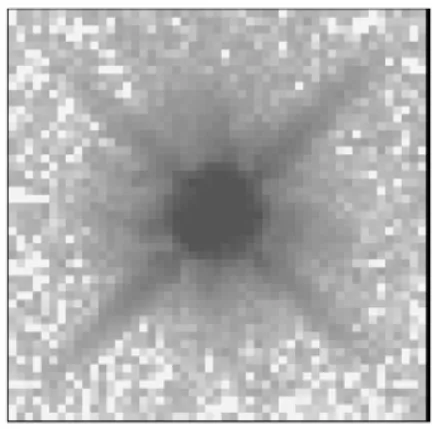
A composite PSF image constructed from 42 of the observed F555W PSFs is shown in Figure 2 (one of the 43 PSFs, namely the file with rootname u2a70105t, was omitted since it was so far out of focus compared to the others).
Figure 2: Composite F555W PC PSF based on 42 direct images of GRW+50D5824.
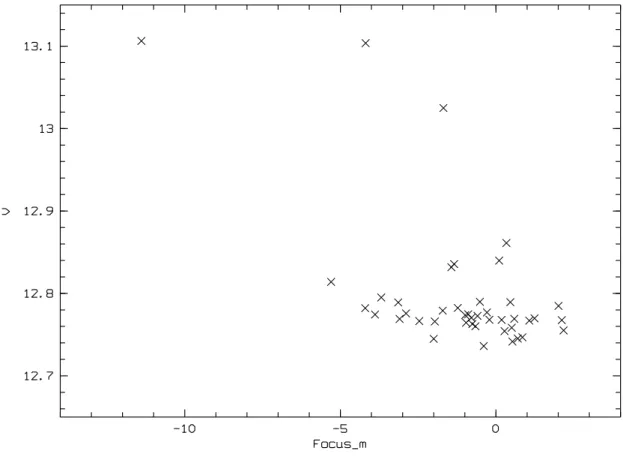
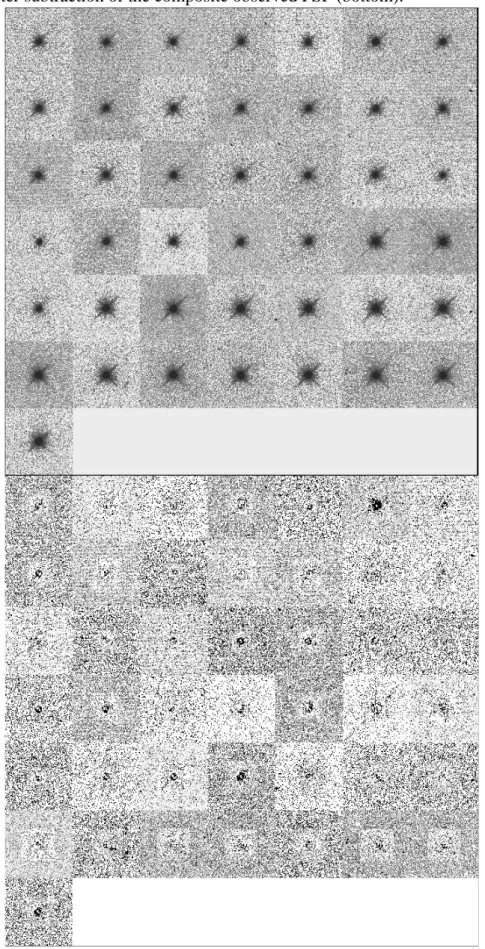
This composite PSF was subtracted from each of the 43 original observations; a grey-scale representation of the subtraction results is illustrated in Figure 5 in Appendix A. Because of the PC image undersampling, concentric rings are indicative that the centering may be slightly different from the center of the composite; fainter features around the periphery are probably due to focus differences (breathing, i.e. the PSF variations seen over the timescale of an HST orbit). The photometry results achievable when using this 42-image composite PSF are plotted in Figure 3 in the form of magnitudes obtained as a function of focus. The scatter affecting the photometric results of the 34 reliable (see below) observations of GRW+70D5824 is 0.014 mag. Note that no systematic dependence of the derived V magnitude as a function of the relative focus position is noticeable. These good photometric results are certainly due to the high S/N of the composite PSF con-structed from the 42 single observations.
Figure 3: Magnitudes, obtained via PSF subtraction of the 42-image composite, as a
func-tion of focus (in microns).
Composite of 34 Observed PSFs - F555W, PC
Immediately apparent in the photometric results of the previous test (Figure 3, using the composite of 42) are eight outliers; five of these appear to be due to PSFs with larger coma or PSFs which are in a substantially different location on the chip while three of the PSFs were taken under different conditions: clocks=ON and therefore, the exposure time was slightly shortened (two in Dec 94) and at a warmer operating temperature (one in Feb 94). For these reasons, a second observed composite was constructed, omitting these ques-tionable PSFs as well as the one PSF dropped earlier (very far from the average focus). The photometry results using this composite of 34 images are also listed in Table 1. The photometric results derived from the 34 composite PSF are comparable (0.014 mag scat-ter) to those based on the 42 composite PSF.
Position and Spectral Type Dependence
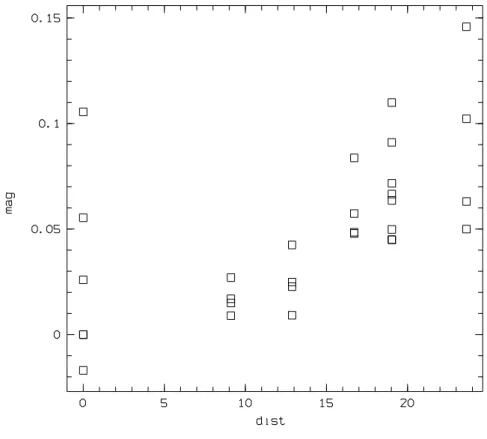
Figure 4 demonstrates the scatter in the resulting photometry when TinyTim (Krist, 1993) model PSFs at a range of angular distances away from the target are used. Also in the same figure (at distance = 0) are the results when using TinyTim PSFs of various spec-tral types. As can be seen, a mismatch in specspec-tral type can result in nearly as much error as when using a PSF ~15-20” away from the target.
Figure 4: Changes in photometry as a function of radial distance from center (in arcsec).
Additional data points at dist = 0 are the results of using TinyTim PSFs of various spectral types (B-V= -0.297, -0.155, 0.126, 0.619, and 1.590; note: for dist > 0, magnitudes were computed using B-V=-0.155).
3. Conclusions
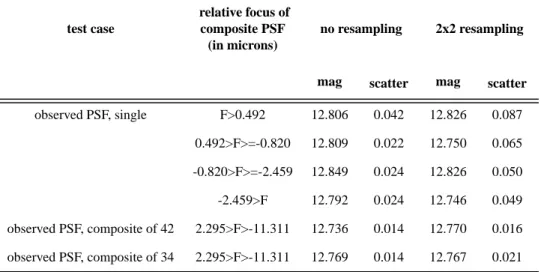
Table 1 below summarizes the average magnitude and scatter obtained from the PSF subtraction photometry of GRW+70D5824 when using the noted (composite or single) PSF type and focus range. These results indicate that the best PSF subtraction photometry
is obtained when using a composite PSF close in relative focus to the target, originating from a location on the chip as close as possible to the target (typically less than 10”) and having a spectral type as similar to the target’s type as possible, in that order of impor-tance. Owing to the better S/N, a composite PSF fared better than a single PSF, however,
the specific number of PSFs used in the composite was found to be relatively unimportant. In addition, resampling did not improve the resulting photometry. Additional tests were also done with a subset of F814W and F439W PC and WF3 images, corroborating the F555W PC results. A WFPC2 PSF Library has been established to enable users to carry out more experiments (see WWW page, under WFPC2 Software Tools). An investigation of photometric measurements based upon subtraction of TinyTim model PSFs has been performed by Remy et al. (1997).
Table 1. Summary of the F555W PSF subtraction photometry results. The average
magni-tudes and scatters were calculated from the 34 reliable observations (see text).
test case
relative focus of composite PSF
(in microns)
no resampling 2x2 resampling
mag scatter mag scatter observed PSF, single F>0.492 12.806 0.042 12.826 0.087 0.492>F>=-0.820 12.809 0.022 12.750 0.065 -0.820>F>=-2.459 12.849 0.024 12.826 0.050 -2.459>F 12.792 0.024 12.746 0.049 observed PSF, composite of 42 2.295>F>-11.311 12.736 0.014 12.770 0.016 observed PSF, composite of 34 2.295>F>-11.311 12.769 0.014 12.767 0.021
4. References
Hasan, H., and Bely, P., 1994, in The Restoration of HST Images and Spectra II, R. Hanisch and R. White, eds., p. 157.
Casertano, S., 1995, Instrument Science Report, OTA 18.
Krist, J., 1993, in Astronomical Data Analysis Software and Systems II, ASP Confer-ence Series 52, R. J. Hanisch, R. J. V. Brissenden, and J. Barnes, eds., 530.
Krist, J., and Burrows, C., 1995, Applied Optics, 34, 4951. Remy, M., 1996 (thesis).
Remy et al., 1997, in Calibration Workshop Proceedings.
Wiggs, M., Baggett, S., Surdej, J., and Tullos, C., 1997, Instrument Science Report # Tiny Tim manual http://scivax.stsci.edu/~krist/tinytim.html
5. Appendix A
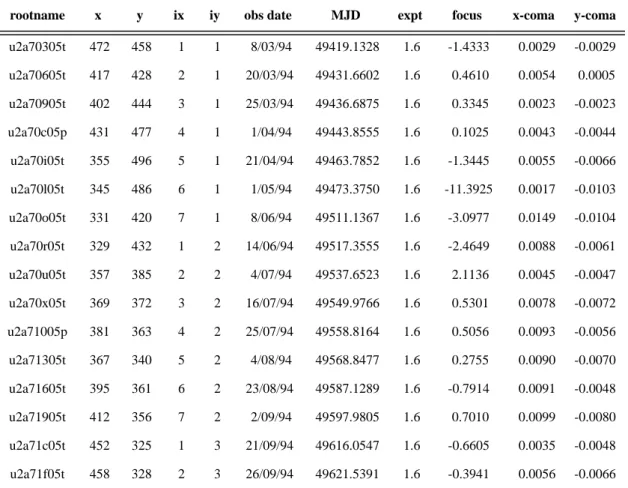
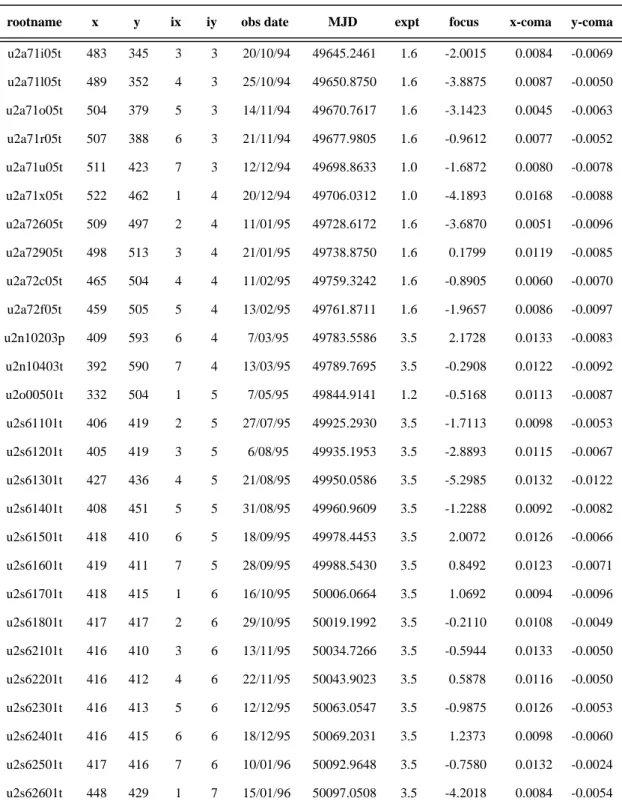
Table 2. Log of PC1 F555W images used for tests described in this paper.
rootname x y ix iy obs date MJD expt focus x-coma y-coma u2a70305t 472 458 1 1 8/03/94 49419.1328 1.6 -1.4333 0.0029 -0.0029 u2a70605t 417 428 2 1 20/03/94 49431.6602 1.6 0.4610 0.0054 0.0005 u2a70905t 402 444 3 1 25/03/94 49436.6875 1.6 0.3345 0.0023 -0.0023 u2a70c05p 431 477 4 1 1/04/94 49443.8555 1.6 0.1025 0.0043 -0.0044 u2a70i05t 355 496 5 1 21/04/94 49463.7852 1.6 -1.3445 0.0055 -0.0066 u2a70l05t 345 486 6 1 1/05/94 49473.3750 1.6 -11.3925 0.0017 -0.0103 u2a70o05t 331 420 7 1 8/06/94 49511.1367 1.6 -3.0977 0.0149 -0.0104 u2a70r05t 329 432 1 2 14/06/94 49517.3555 1.6 -2.4649 0.0088 -0.0061 u2a70u05t 357 385 2 2 4/07/94 49537.6523 1.6 2.1136 0.0045 -0.0047 u2a70x05t 369 372 3 2 16/07/94 49549.9766 1.6 0.5301 0.0078 -0.0072 u2a71005p 381 363 4 2 25/07/94 49558.8164 1.6 0.5056 0.0093 -0.0056 u2a71305t 367 340 5 2 4/08/94 49568.8477 1.6 0.2755 0.0090 -0.0070 u2a71605t 395 361 6 2 23/08/94 49587.1289 1.6 -0.7914 0.0091 -0.0048 u2a71905t 412 356 7 2 2/09/94 49597.9805 1.6 0.7010 0.0099 -0.0080 u2a71c05t 452 325 1 3 21/09/94 49616.0547 1.6 -0.6605 0.0035 -0.0048 u2a71f05t 458 328 2 3 26/09/94 49621.5391 1.6 -0.3941 0.0056 -0.0066
u2a71i05t 483 345 3 3 20/10/94 49645.2461 1.6 -2.0015 0.0084 -0.0069 u2a71l05t 489 352 4 3 25/10/94 49650.8750 1.6 -3.8875 0.0087 -0.0050 u2a71o05t 504 379 5 3 14/11/94 49670.7617 1.6 -3.1423 0.0045 -0.0063 u2a71r05t 507 388 6 3 21/11/94 49677.9805 1.6 -0.9612 0.0077 -0.0052 u2a71u05t 511 423 7 3 12/12/94 49698.8633 1.0 -1.6872 0.0080 -0.0078 u2a71x05t 522 462 1 4 20/12/94 49706.0312 1.0 -4.1893 0.0168 -0.0088 u2a72605t 509 497 2 4 11/01/95 49728.6172 1.6 -3.6870 0.0051 -0.0096 u2a72905t 498 513 3 4 21/01/95 49738.8750 1.6 0.1799 0.0119 -0.0085 u2a72c05t 465 504 4 4 11/02/95 49759.3242 1.6 -0.8905 0.0060 -0.0070 u2a72f05t 459 505 5 4 13/02/95 49761.8711 1.6 -1.9657 0.0086 -0.0097 u2n10203p 409 593 6 4 7/03/95 49783.5586 3.5 2.1728 0.0133 -0.0083 u2n10403t 392 590 7 4 13/03/95 49789.7695 3.5 -0.2908 0.0122 -0.0092 u2o00501t 332 504 1 5 7/05/95 49844.9141 1.2 -0.5168 0.0113 -0.0087 u2s61101t 406 419 2 5 27/07/95 49925.2930 3.5 -1.7113 0.0098 -0.0053 u2s61201t 405 419 3 5 6/08/95 49935.1953 3.5 -2.8893 0.0115 -0.0067 u2s61301t 427 436 4 5 21/08/95 49950.0586 3.5 -5.2985 0.0132 -0.0122 u2s61401t 408 451 5 5 31/08/95 49960.9609 3.5 -1.2288 0.0092 -0.0082 u2s61501t 418 410 6 5 18/09/95 49978.4453 3.5 2.0072 0.0126 -0.0066 u2s61601t 419 411 7 5 28/09/95 49988.5430 3.5 0.8492 0.0123 -0.0071 u2s61701t 418 415 1 6 16/10/95 50006.0664 3.5 1.0692 0.0094 -0.0096 u2s61801t 417 417 2 6 29/10/95 50019.1992 3.5 -0.2110 0.0108 -0.0049 u2s62101t 416 410 3 6 13/11/95 50034.7266 3.5 -0.5944 0.0133 -0.0050 u2s62201t 416 412 4 6 22/11/95 50043.9023 3.5 0.5878 0.0116 -0.0050 u2s62301t 416 413 5 6 12/12/95 50063.0547 3.5 -0.9875 0.0126 -0.0053 u2s62401t 416 415 6 6 18/12/95 50069.2031 3.5 1.2373 0.0098 -0.0060 u2s62501t 417 416 7 6 10/01/96 50092.9648 3.5 -0.7580 0.0132 -0.0024 Table 2. Log of PC1 F555W images used for tests described in this paper.
Figure 5: Greyscale representation of the 43 GRW+70D5824 observed PSFs (top) and