HAL Id: hal-02913486
https://hal-mines-paristech.archives-ouvertes.fr/hal-02913486
Submitted on 9 Aug 2020HAL is a multi-disciplinary open access archive for the deposit and dissemination of sci-entific research documents, whether they are pub-lished or not. The documents may come from teaching and research institutions in France or abroad, or from public or private research centers.
L’archive ouverte pluridisciplinaire HAL, est destinée au dépôt et à la diffusion de documents scientifiques de niveau recherche, publiés ou non, émanant des établissements d’enseignement et de recherche français ou étrangers, des laboratoires publics ou privés.
single-bubble shrinkage in a borosilicate glass-forming
liquid doped with cerium oxide
Luiz Pereira, Jaroslav Kloužek, Miroslava Vernerová, Annabelle Laplace,
Franck Pigeonneau
To cite this version:
Luiz Pereira, Jaroslav Kloužek, Miroslava Vernerová, Annabelle Laplace, Franck Pigeonneau. Ex-perimental and numerical investigations of an oxygen single-bubble shrinkage in a borosilicate glass-forming liquid doped with cerium oxide. Journal of the American Ceramic Society, Wiley, inPress, 103(12), pp.6736-6745. �10.1111/JACE.17398�. �hal-02913486�
DOI: xxx/xxxx 10.1111/JACE.17398
ORIGINAL ARTICLE
Experimental and numerical investigations of an oxygen
single-bubble shrinkage in a borosilicate glass-forming liquid
doped with cerium oxide
Luiz Pereira
1,2| Jaroslav Kloužek
3,4| Miroslava Vernerová
3,4| Annabelle Laplace
1| Franck
Pigeonneau
21CEA Marcoule, DEN, DE2D, Univ.
Montpellier, Marcoule, France
2MINES ParisTech, PSL Research
University, CEMEF - Centre for material forming CNRS UMR 7635, CS 10207, Claude Daunesse 06904 Sophia Antipolis cedex, France
3Laboratory of Inorganic Materials, Joint
Workplace of the University of Chemistry and Technology Prague, Prague, Czech Republic
4Institute of Rock Structure and Mechanics
of the ASCR, v.v.i., Prague, Czech Republic
Correspondence
∗L. Pereira, CEA Marcoule, DEN, DE2D,
Univ. Montpellier, Marcoule, France, Email: luiz.pereira@cea.fr
Abstract
The shrinkage of an oxygen single-bubble is investigated in a cerium-doped
borosil-icate glass melt at 1150◦C. Nine glass samples are synthesized and investigated,
utilizing three different amounts of Ce2O3 and three different redox ratios
(Ce-(III)/Cetotal). Employing in-situ observation, the single-bubble behavior is recorded
with a camera. For each glass melt, five experiments are performed with different initial bubble radii. The shrinkage rate (𝑑𝑎∕𝑑𝑡) depends strongly on the cerium con-tent as well as the redox ratio. Numerical calculations are also conducted to support the understanding of the bubble shrinkage mechanism in the given cases. The model adequately estimates the experimental data for several cases, and an explanation is proposed for the cases, in which it does not. Moreover, we demonstrate, physically and mathematically, the influence of the initial radius of the bubble on the mass transfer between the rising bubble and the melt. We confirm the utilization of the “modified Péclet number”, which is a dimensionless number that takes into consid-eration the influence of multivalent elements on mass transfer. Finally, we master the bubble shrinkage behavior by normalizing the experimental data employing a characteristic time for the mass transfer (𝜏).
KEYWORDS:
bubble, glass melt, mass transfer, numerical analysis, redox
1
INTRODUCTION
Gas release, occurring during glass melting processes, constitutes an important issue. Different kinds of gas sources can be distinguished in molten glasses, such as those originating from the chemical reactions between the different chemical precursors of the glass and also those resulting from the chemical reactions between dissolved species in the glass melt1. In the latter, the redox reactions of multivalent elements can be highlighted. Multivalent elements have been widely employed in different glass-melting fields to enhance glass properties. The electrical conductivity and chemical durability of phosphate glasses are examples2,3,4,5. Moreover, they have been also employed during the fining of glass, as well as in impurities, such as iron6,7,8. Likewise, radioactive wastes generally contain multivalent elements, such as cerium and iron, and consequently, this kind of gas
release may be observed during nuclear waste vitrification9,10,11,12,13. Oxygen evolution is triggered by the shift in cerium and iron redox equilibrium with increasing temperature (𝑇 )10,14.
Once molecular oxygen is produced by these reactions, bubbles may be formed under certain conditions. The mass transfer and the coalescence of the bubbles in melts have been extensively observed by scientists15,16,17,18,19,20,21,22. The former may result in bubble growth or shrinkage, depending on the gas saturation in the vicinity of the bubble. Experimentally, Greene et al.23,24provided important information, on mass transfer, through high-temperature observations of the shrinkage of an oxygen bubble in different molten glasses. Doremus25, in his turn, theoretically contributed to the understanding of the mass transfer process between a glass-forming liquid and an oxygen bubble, utilizing the previous experimental data. In the 1970s, Žlutický and Němec26commenced the development of an apparatus to observe glass melts, at high temperatures, especially during the fining process. Subsequently, in this same research group, Němec and Kloužek27designed and set up an apparatus, in which a single bubble could be released in a transparent silica crucible, filled with molten glass, and the radius of the bubble (a) could be recorded with time, via camera imaging. More recently, Pigeonneau28,29numerically investigated the shrinkage of an oxygen bubble rising in an iron-doped silicate melt. He concluded that the mass transfer coefficient, considering the redox reaction, increased with the iron content as well as with the reduction of the oxygen partial pressure (𝑃O2).
In this work, we experimentally and numerically investigate the shrinkage of an oxygen bubble in a cerium-doped borosilicate melt, containing different gases (oxygen, nitrogen, carbon dioxide, and argon),12at 𝑇 =1150◦C. The borosilicate composition
is selected because of its application as a glass matrix in nuclear waste conditioning and because of the lack of accurate data, in the literature, on bubble behavior in this type of glass melt. Cerium is selected, as a multivalent element, because of its redox power and possible presence in radioactive wastes. Additionally, the influence of cerium on mass transfer has not been explored thus far. The isothermal temperature (1150◦C) for this study is selected based on the temperature range of nuclear
waste vitrification processes9. Three different amounts of Ce
2O3and three different redox ratios (Ce-(III)/Cetotal), leading to
nine glass samples, were synthesized and investigated. Thus, this study examines a much wider range of compositions and redox states than previously published ones. Further, we assess if the cerium content, like that of iron, according to Pigeonneau29, could enhance mass transfer. The influence of 𝑃O2on mass transfer is also considered in this work.
2
MATERIALS AND EXPERIMENTAL SET-UP
This section describes the glass melt system, which is utilized to investigate mass transfer between an oxygen bubble and the borosilicate melts. First, we present the composition of the glass system and the applied synthesis procedure. Afterward, the physical and chemical characterizations are exhibited, as described herein, to support the interpretation of bubble observa-tion results and to acquire the parameters for the numerical computaobserva-tions. The values generated are obtained within a wide temperature range, and for the studied one (𝑇 =1150◦C), these values are emphasized herein.
2.1
Glass melt
To study the shrinkage of an oxygen bubble in a borosilicate melt with varying Ce2O3amounts (0.5, 1.0, and 1.5 wt%) and redox ratios, borosilicate glass beads, with a size of ∼ 1.5 mm and surface area of ∼ 50 mm2, are mixed with a cerium-IV oxide powder
(CeO2/Aldrich, >99.9%) and melted at three different temperatures to impose the three different redox ratios; leading to nine glass samples. The precursors mentioned here are initially mixed mechanically and thereafter placed in a platinum crucible. They are melted at different temperatures (1200, 1300 and 1400◦C), for different amounts of time (90, 60, and 60 min), respectively.
These conditions are selected based on the characteristic residence time proposed by Pereira et al.12 as well as to minimize borate volatilization. Afterward, they are quenched on a stainless-steel plate. TABLE1shows the nominal composition of the three glass samples with the different cerium loadings.
2.2
Cerium redox state
Potentiometry measurements are conducted to determine 𝑃O2, in the melt, at 𝑇 = 1150◦C. A GS Rapidox II™ analyzer30,
designed and supplied by Glass Service, is employed to obtain the values in TABLE2. Three redox states, namely oxidized (O), intermediate (I), and reduced (R) states are obtained because the melts had been previously synthesized at three different temperatures: 1200, 1300 and 1400◦C, respectively. After obtaining the 𝑃
TABLE 1Glass composition (wt%) for different Ce2O3loading. (Composition is expressed using Ce2O3, but it does not afford any clue about its redox ratio).
Glasses Oxide 0.5 wt% Ce2O3 1.0wt% Ce2O3 1.5wt% Ce2O3 SiO2 58.17 57.87 57.58 B2O3 18.49 18.39 18.30 Na2O 6.97 6.94 6.90 CaO 5.14 5.11 5.09 Al2O3 3.97 3.95 3.93 ZnO 3.23 3.21 3.19 Li2O 2.49 2.48 2.46 ZrO2 0.62 0.61 0.61 K2O 0.21 0.21 0.21 Ce2O3 0.50 1.00 1.50 BaO 0.10 0.10 0.10 TiO2 0.08 0.08 0.08 Fe2O3 0.04 0.04 0.04 Total 100.00 100.00 100.00
redox model, proposed by Pinet et al.10, is applied to determine the cerium speciation of the studied glass (optical basicity, Λ =0.53). TABLE2presents the nine melts, utilized for this study, which are named according to their redox states (O, I, or R) and their Ce2O3 loadings. This table contains the pre-synthesis temperatures of each sample, along with their respective log(𝑃O
2)and Ce-(III) percentage values.
TABLE 2Oxygen partial pressure and the respective Ce-(III) percentage for each studied glass at 1150◦C.
Glass melts pre-synthesis temperature (◦C) log(𝑃
O2)±0.01 % Ce-(III)±1.0 (%) O-0.5 wt% Ce2O3 0.03 52.79 O-1.0 wt% Ce2O3 1200 0.06 52.36 O-1.5 wt% Ce2O3 -0.07 54.23 I-0.5 wt% Ce2O3 -0.66 62.46 I-1.0 wt% Ce2O3 1300 -0.57 61.24 I-1.5 wt% Ce2O3 -0.77 63.93 R-0.5 wt% Ce2O3 -1.19 69.30 R-1.0 wt% Ce2O3 1400 -1.06 67.69 R-1.5 wt% Ce2O3 -1.29 70.51
2.3
Viscosity
Viscosity (𝜂) measurements of the molten glass samples are performed with a Searle coaxial cylinder viscometer12,31. Four different glass melts with different cerium oxide loadings (Ce2O3wt%=0, 0.5, 1.0 and 1.5 wt%) are analyzed and their viscosity values are equal within the allowed experimental error. The results are, thereafter interpolated, utilizing the Vogel-Fulcher-Tammann (VFT)32,33,34law, as follows:
𝜂= 8.39⋅ 10−3exp( 6026.88 𝑇 − 610.16
)
, (1)
TABLE 3Surface tension (𝜎) for melts with different Ce2O3loadings at 1150◦C. Total Ce2O3amount (wt%) 𝜎±0.003 N∕m 0.5 0.244 1.0 0.246 1.5 0.249
2.4
Surface tension
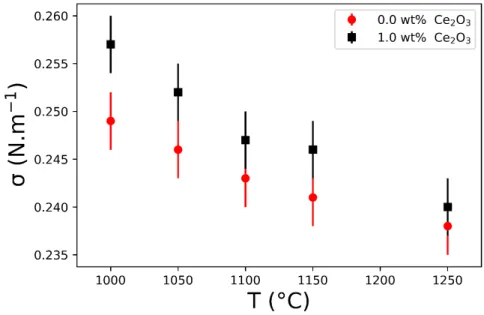
Surface tension (𝜎) measurements between an oxygen bubble and the borosilicate melt are conducted, employing the “maxi-mum bubble pressure method” (MBPM), according to the methodology presented by Yamashita et al.35. The measurements are conducted at 1000-1250◦Cfor the different glass compositions. We performed the 𝜎 measurements of the molten glass
sam-ples without and with 1.0 wt% Ce2O3(FIGURE1). The values for 0.5 wt% are obtained by the interpolation of the previous experimental values. Contrarily, the values for 1.5 wt% are obtained by the extrapolation of them. TABLE3displays the surface tension values for the studied melts (0.5, 1.0, and 1.5 wt% of Ce2O3) at a single bubble observation temperature.
FIGURE 1Surface tension (𝜎) experimentally obtained for melts without and with 1.0 wt% of Ce2O3from 1000 to 1250◦C.
2.5
High-temperature density
High-temperature density (𝜌) measurements are conducted, employing the Archimedean method, which utilized the molten glass, as the immersion fluid; a platinum sphere, as the immersed material; and the A&D GF200 scale. Density measurements are performed at 1000-1300◦C, for glasses with 1.0 wt% and without Ce
2O3 (FIGURE2). As previously for surface tension
measurements, the values for 0.5 and 1.5 wt% Ce2O3are obtained by interpolation and extrapolation, respectively. TABLE4
shows high temperature density values for the studied melts (0.5, 1.0, and 1.5 wt% Ce2O3), at 𝑇 =1150◦C.
3
EXPERIMENTAL APPROACH
Bubble observation in molten glass requires special equipment that can work at high temperatures. As discussed earlier, in-situ observation via camera imaging26,27 is a beneficial technique for obtaining these data. It is a well-established technique,
FIGURE 2High-temperature density (𝜌) experimentally acquired for melts without and with 1.0 wt% of Ce2O3from 1000 to 1300◦C.
TABLE 4High-temperature density (𝜌) for melts with different Ce2O3loadings at 1150◦C.
Total Ce2O3amount (wt%) 𝜌±2 kg∕m3
0.5 2254
1.0 2259
1.5 2263
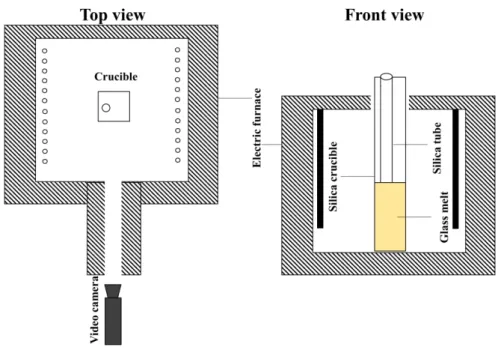
employed to obtain information about glasses and melts at high temperatures36,37,38,39. The apparatus consists of an electrical furnace coupled with a porthole, which geometrically links the glass melt sample to the charge-coupled device (CCD) in the camera (FIGURE3). Prior to the procedure, glass pieces (∼50 g) are placed in a transparent silica crucible (height, 𝐻 =65 mm; thickness, 𝐾 =15 mm; and width, 𝐿 =35 mm), and the assembled apparatus is placed in the observation furnace and heated at 1150◦C. After melting the glass samples (∼180 s), a silica tube, connected to an oxygen gas cylinder, is placed in the melt.
The diffusion of silica from the crucible and tube to the molten glass was calculated, and the value obtained was negligible40. Temperature around the sample is monitored with a thermocouple, and the thermal inhomogeneity does not exceed 5◦C.
At the completion of the experimental setup, an oxygen bubble is inflated and injected into the glass melt through the silica tube. In this study, the initial bubble radii (𝑎0) varied from 0.3 to 1.6 mm. After its release, the bubble rises because of the
buoyancy in the crucible, and the radius is monitored over time, by video camera recordings (FIGURE4). Here, the investigated oxygen bubble rises freely, up to the surface, where it escapes from the melt. The residence time of the bubble depended, mainly on radius and the viscosity of the melt. 41, 42 Moreover, in this work, we observed the radius evolution for around 10 min of the experiments. Five bubbles are produced in each glass melt.
Bubble radius is recorded and computed using the LUCIA imaging software. Afterward, the obtained images are treated with the NIS-Elements®software (Laboratory Imaging, Czech Republic), by counting the number of pixels, representing the bubble,
and comparing them to a known object, which is employed for calibration. The uncertainties of radius are equal to one pixel. Consequently, the absolute uncertainty is ±20 µm.
FIGURE 3Scheme of the top and front views of the high-temperature in-situ observation apparatus.
FIGURE 4 In-situcamera images illustrating bubble shrinkage in three different moments (t1, t2 and t3).
4
MASS TRANSFER MODELING OF A MULTICOMPONENT BUBBLE
A model, for the multicomponent bubble with 𝑁𝑔gaseous species (𝑖), is presented herein. It was developed by Pigeonneau29 and has been applied in soda-lime-silica melts, doped with iron oxide40. This theoretical model considers the mass transfer phenomenon between a free-rising bubble of known composition and a molten glass with well-defined physical properties and chemical equilibria. The temporal behavior of the bubble is determined in terms of its composition, radius, and vertical position (𝑧). The molten glass can also be evaluated, temporarily, in terms of the composition, redox and dissolved gases. As previously described, a similar glass system, has different gaseous species (oxygen, nitrogen, carbon dioxide, and argon)12 but due to the low amount of argon, this one is not considered in the current mass transfer calculations.
As a result of the mass transfer, the number of moles of each gaseous species in the studied bubble changed over time. The time derivative of the number of moles is defined by
𝑑𝑛𝑖
𝑑𝑡 = 2𝜋𝑎 Sh𝑖𝐷𝑖
(
𝐶𝑖∞− 𝐶𝑖𝑆), (2)
where 𝑎 is the bubble radius, Sh𝑖is the Sherwood number, 𝐷𝑖is the diffusion coefficient and 𝐶𝑖∞and 𝐶 𝑠
𝑖 are, respectively, the bulk and the bubble surface molar concentration of a given gas species. Henry’s law can be applied at the surface of the bubble
by:
𝐶𝑖𝑆= 𝐿𝑖𝑃𝑖, (3)
where 𝐿𝑖 is the solubility coefficient and 𝑃𝑖 the partial pressures of 𝑖, inside the bubble. Once the number of moles of each species is determined, and by employing the equilibrium equation of the ideal gas law, along with the hydrostatic and Laplace pressures, the radius can be determined by solving the following equation:
3𝑅𝑇 𝑁𝑔 ∑ 𝑖=1 𝑛𝑖 4𝜋𝑎3 = 𝑃0+ 𝜌𝑔(𝐻 − 𝑧) + 2𝜎 𝑎, (4)
where 𝑅 is the universal gas constant, 𝑇 is the temperature, 𝑃0 is the atmospheric pressure, 𝜌 is the melt density, 𝑔 is the
acceleration due to gravity, 𝐻 the height of the liquid, 𝑧 is the vertical position of the bubble, and 𝜎 is the surface tension between the gaseous and liquid phases.
The Sherwood number Sh𝑖of gaseous species 𝑖 is a dimensionless number which is defined as the ratio of the mass transfer coefficient, with motion, to the motionless one. In the case of the mobile bubble/liquid interface and low Reynolds number flow regime, Clift et al.41presented Sh
𝑖as follows:
Sh𝑖= 1 + (
1 + 0.564Pe2∕3𝑖 )3∕4, (5)
where Pe𝑖, the Péclet number, is defined by
Pe𝑖= 2𝑎𝑉𝑇
𝐷𝑖 , (6)
where 𝑉𝑇 is the bubble terminal rise velocity, which according to the Hadamard–Rybczynski42,43drag force relation is given by:
𝑉𝑇 = 𝑔𝑎
2𝜌
3𝜂 . (7)
Pigeonneau29 proposed the utilization of Pe for non-fining gases such as nitrogen and carbon dioxide. For the fining gases, such as oxygen, which is related to a redox reaction, he proposed the use of a modified Péclet number (Pe′
𝑖). The currently studied molten glass is doped with Ce2O3in a redox reaction, given by
Ce4++ 1 2O
2−⇌Ce3++ 1
4O2. (8)
Pigeonneau29 concluded that by increasing the iron content of iron oxide–doped silicate melt, the mass transfer between the oxygen bubble and the molten glass could be enhanced. Theoretically, this enhancement is facilitated by increasing Pe′
𝑖, which in turn, enhances Sh𝑖. The establishment of this unified expression was obtained by Pigeonneau29who fitted different numerical data for different melt features. Moreover, Pe′
𝑖is defined as a function of two dimensionless numbers; the first is linked to the gas saturation while the second to the equilibrium constant of the chemical reaction. The “modified Péclet number” Pe′
𝑖is given by the following relationship:
Pe′ O2 =PeO2 [ 1 + 𝛼(SaO 2 ) 𝑁Ce], (9)
where 𝛼(SaO2)is defined by
𝛼=(0.328Sa0.375O 2 + 0.781SaO 2 )−1 . (10)
The oxygen saturation, SaO2, is given by:
SaO2= 𝐶O∞ 2 𝐶𝑆 O2 , (11) where 𝐶∞ O2 and 𝐶 𝑆
O2 are the bulk and bubble surface oxygen concentrations, respectively. The dimensionless number, 𝑁Ce, is
defined as follows: 𝑁Ce= 𝐶∞ Ce3+(1 − 𝑅 ∞)Sa1∕4 O2 16𝐶𝑆 O2 , (12)
in which 𝑅∞is the cerium redox state defined by:
𝑅∞= 𝐶∞ Ce3+ 𝐶∞ Ce3++ 𝐶 ∞ Ce4+ . (13)
Here, we apply this described model for the free rising bubble, initially composed of oxygen, and subsequently immersed in Ce2O3-doped borosilicate melt. This theoretical model is compared to the experimental results obtained via the in-situ camera observation technique.
The experimental results of the glass and redox characterizations (𝜂, 𝜎, 𝜌 and % Ce3+), presented in Section3, are employed
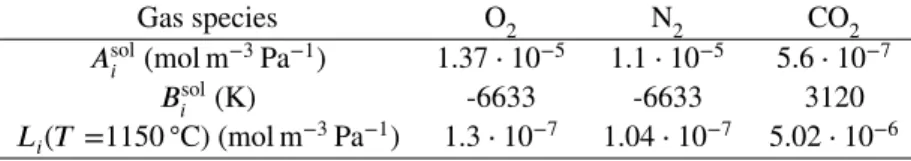
as the parameters for this theoretical description. However, the diffusivities and solubilities of the gases are not obtained experimentally; thus, we adopt the diffusivities and solubilities for the gases in other glass melt systems reported in the literature25,44.
Diffusion coefficients of each gas (O2, N2and CO2) are determined as function of temperature as follows
𝐷𝑖= 𝐴diff𝑖 exp ( −𝐵𝑖diff 𝑇 ) , (14) where 𝐴diff
𝑖 and 𝐵𝑖diffare the diffusion constants. The constants for oxygen are adopted from Doremus25, for a borosilicate melt doped with a multivalent element (arsenic), and the ones for the non-fining gases are adopted from Beerkens44. These constants are displayed in TABLE5.
TABLE 5Constants to determine the diffusion coefficient along with some diffusivity values at 1150◦C.
Gas species O2 N2 CO2
𝐴diff𝑖 (m2s−1) 3.2⋅ 10−5 4.3⋅ 10−5 1.9⋅ 10−5 𝐵𝑖diff(K) 16140 19364 21516 𝐷𝑖(𝑇 =1150◦C) (m2s−1) 3.9 ⋅ 10−10 5.16⋅ 10−11 5.21⋅ 10−12
Henry coefficients for each of the involved species (oxygen, nitrogen, and carbon dioxide) are determined as functions of temperature, as follows: 𝐿𝑖 = 𝐴sol𝑖 exp ( 𝐵𝑖sol 𝑇 ) , (15) where 𝐴sol
𝑖 and 𝐵𝑖solare the constants obtained by Beerkens44and displayed in TABLE6.
TABLE 6Constants to determine the solubility coefficient along with solubility values at 1150◦C.
Gas species O2 N2 CO2
𝐴sol𝑖 (mol m−3Pa−1) 1.37⋅ 10−5 1.1⋅ 10−5 5.6⋅ 10−7
𝐵sol𝑖 (K) -6633 -6633 3120
𝐿𝑖(𝑇 =1150◦C) (mol m−3Pa−1) 1.3⋅ 10−7 1.04⋅ 10−7 5.02⋅ 10−6
5
RESULTS AND DISCUSSIONS
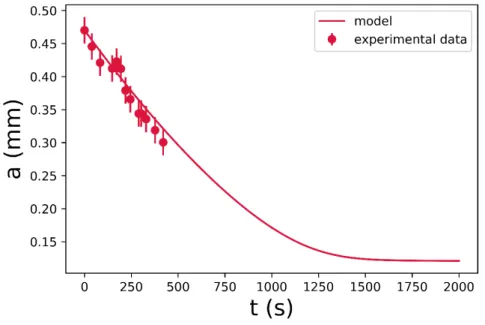
Because of the limitation of the crucible height, along with the applied experimental methodology, the studied regions, in this research, is based on ∼10 min of observation, in each of the experiments. FIGURE5shows the numerical and experimental results of one bubble, immersed in R-1.0 glass melt. It is vital to emphasize that the experimental data ceases when the studied bubble escapes from the molten glass. At the initial stages, the bubble size decreased, almost linearly with time, in both the experimental and numerical data.
FIGURE6shows an overview of the oxygen bubble size, as a function of time, for the nine different melts, at 𝑇 =1150◦C. Five bubbles are investigated for each of these melts. The symbols represent the experimental results while the continuous lines represent the results obtained by numerical computations. Considering the experimental data in isolation, it can be confirmed that increasing the redox ratio of the glass, bubble shrinkage rate (𝑑𝑎∕𝑑𝑡) is enhanced. This can be explained by the increase in
FIGURE 5Numerical and experimental results of a bubble, which was immersed in an R-1.0 glass melt, to demonstrate the studied region for ∼10 min.
the driving force of oxygen mass transfer, which is the difference between its 𝐶𝑠
O2and 𝐶 ∞
O2. Hence, the bubbles in O-melts hardly
shrink while the others, shrink more readily. This enhancement is also observed in terms of the cerium content of the melt: the melts, with high cerium contents, demonstrate higher exchange rates, compared to those with low cerium contents. Qualitatively, Ce-(III) can be considered as an oxygen sinkhole. It consumes oxygen from the bubble and facilitate the absorption of the bubble. These influences are better explained through numerical calculations, which are presented in the following paragraphs.
The most oxidized samples (O-group), shown in FIGURE6, as A), B), and C), exhibit log(𝑃O2) ∼ 0. For these samples,
it is noticeable that the numerical simulation does not adequately represent their bubble shrinkage behavior with time. This mismatch is due to the proximity of the 𝑃O2 of the melt to the 𝑃O2 of the bubble, which the natural logarithmic value is zero
(since it is initially composed of pure oxygen). Hence, slight variations of 𝑃O2, experimentally measured, may completely distort
the numerical output of the bubble evolution, thereby resulting in its growth instead of its shrinkage.
With the exception of the O-samples, the numerical computations applied to I- and R-melts adequately estimates their mass transfer processes and bubble shrinkage rates. Thus, the mathematical law, along with the considered model fitted adequately with the experimental results. Indeed, a comparison of the correlation coefficient (𝑅2), obtained from the linear regression of
both the numerical and experimental data, confirmed that all the investigated bubbles, in the I- and R-melts, exhibited 𝑅2>0.95.
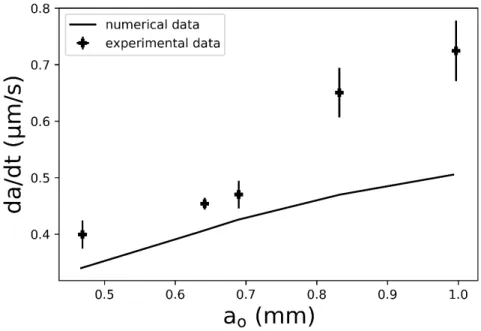
FIGURE 7shows an example of shrinkage rate (𝑑𝑎∕𝑑𝑡), as a function of the initial radius (𝑎0). The values are obtained from the studied region (for up to 10 minutes of the experiment) and da/dt is constant in this domain. This figure is obtained by plotting the slope (𝑑𝑎∕𝑑𝑡) versus the interception (𝑎0) of the liner curve obtained by the regression of both the experimental
(symbols) and theoretical (continuous line) data. For the experimental data, it is interesting to note that the presence of large bubbles generally results in an increased margin for error, because large bubbles exhibit lower residence time and consequently lower the amount of data. By observing FIGURE6, along with FIGURE7, it can be verified that, for the same melt and initial composition of the bubble, the initial bubble radius determines 𝑑𝑎∕𝑑𝑡, which is constant with time, in the studied region. Therefore, large bubbles will generally shrink faster than smaller ones. By increasing the initial radius, terminal rise velocity is also enhanced, and this contributes to the decrease in the chemical boundary layer around the rising bubble, which in turn, enhances the mass transfer. Mathematically, it can be quantified through the increment of Pe, which enhances mass transfer via the increase of Sh𝑖29.
In this work, we apply the assumption29,40that mass transfer, in the presence of a multivalent element, is enhanced. FIGURE8 displays the acquired experimental data (stars), along with two different numerical models (continuous lines). Model A does not consider that the multivalent element enhanced the mass transfer. It, therefore, considers all gases, as non-fining gases and thus considered Pe in the theoretical calculations. Conversely, model B, which is the current model adopted in this study, considers molecular oxygen, as a fining gas, which, therefore adopts Pe′
FIGURE 6Oxygen bubble radius (𝑎) as function of time for the nine studied melts. A) O-0.5 wt% Ce2O3, B) O-1.0 wt% Ce2O3, C) O-1.5 wt% Ce2O3, D) I-0.5 wt% Ce2O3, E) I-1.0 wt% Ce2O3, F) I-1.5 wt% Ce2O3, G) R-0.5 wt% Ce2O3, H) R-1.0 wt% Ce2O3 and I) R-1.5 wt% Ce2O3. Symbols are the experimental results and continuous lines are the numerical simulation ones. turn, enhances mass transfer. It can be clearly seen in FIGURE8that model B estimates within the experimental error while model A underestimated the magnitude of mass transfer. It is important to emphasize that similar behaviors are also observed in the I- and R-melts. Pe′
𝑖considers the redox state of the glass melt, which is quantified by the concentration of the physically dissolved oxygen and is determined to be in equilibrium with the polyvalent elements in the melt (in this case, cerium). The bubble shrinking rate is increased with increasing redox ratio.
Therefore, by observing the radius evolution, acquired experimentally with time, and by considering the two numerical mod-els, it is important to note that the increase in the cerium content could increase the mass transfer coefficient in the borosilicate melt system, just as iron oxide can achieve in a silicate melt. It is demonstrated, therefore, that the application of Pe′
𝑖, proposed by Pigeonneau29, adequately estimated the bubble shrinkage in a different melt system, doped with a different multivalent species. The normalization of a single-bubble behavior, according to Pigeonneau28, enabled us to define the characteristic time for mass transfer (𝜏) as follows:
𝜏= 2𝑎
2 0
ShO2(Pe′O2,0)𝐷O2𝐿O2𝑅𝑇
, (16)
with 𝑎0the initial bubble radius. The Sherwood number ShO2(Pe′O2,0)is determined as a function of the modified Péclet number
in the initial condition. Recall that the 𝐷O2𝐿O2𝑅𝑇 product is the oxygen permeability.
This characteristic time 𝜏 considers the mass transfer, by advection, but also considers the redox reaction of cerium. This characteristic time for the nine melts, possessing three different amounts of Ce2O3, and three different redox states are computed for a typical radius of 1 mm. TABLE7summarizes the numerical values of 𝜏, in h, for these nine samples. As expected, 𝜏 decreases when the amount of cerium increases. Moreover, R-melts exhibited a shrinkage time scale, which is shorter than that of the O groups.
The dimensionless shrinkage rate 𝑑 ̄𝑎∕𝑑𝑡 was defined by Pigeonneau28and is given by
𝑑 ̄𝑎 𝑑 ̄𝑡 = − 1 ̄ 𝑎 𝑁𝑔 ∑ 𝑖=1 Sh𝑖 ̄ 𝜏𝑖 ( 𝑥𝑖−Sa𝑖,0 ) , (17)
FIGURE 7Bubble shrinkage rate (𝑑𝑎∕𝑑𝑡) as function of the initial bubble size (𝑎0) for the sample R-1.0 wt% Ce2O3.
FIGURE 8Bubble radius as function of time obtained experimentally and by two numerical models, one taking into consider-ation Péclet number and the other one considering the modified Péclet number. The displayed results are obtained for bubble E immersed in the sample R-1.0 wt% Ce2O3.
where the bars, over the variables, indicate that they are dimensionless. The driving force, for the bubble evolution over time, is determined by the difference of the molar fraction (𝑥𝑖) and the saturation state (Sa𝑖,0) of each species. To solve this equation, the
exchange rate of each species is also required28. This development is not detailed in the present work. Nevertheless, it should be noted that since advection and redox reaction facilitated the mass transfer, Sh𝑖is expected to behave as a function of ̄𝑎3∕2. Reporting this estimation in Eq. (17), for short durations,√𝑎̄should behave as follows
√
̄
TABLE 7Characteristic time of mass transfer 𝜏 in hour given by eq. (16) for the nine glass-forming melts. glass doped in Ce2O3
Redox state/Ce2O3loading 0.5 % 1.0 % 1.5 %
O 3.24 2.34 1.76
I 2.27 1.62 1.26
R 1.92 1.40 1.08
FIGURE 9√𝑎̄as a function of ̄𝑡, is obtained for all the experiments with the nine glass samples. The blue squares, green
triangles and red pentagons correspond, respectively, to the results obtained for the O-, I- and R-melts. with 𝛽 a constant of integration.
FIGURE9assembles all the data recorded in this work. The square root of the dimensionless radius (√𝑎̄) is plotted, as a
function of the dimensionless time (̄𝑡), which is obtained by dividing the experimental time (𝑡) by 𝜏. A unique behavior appeared clearly: the data are largely scattered, even after a long time. The solid line is a fitted curve, corresponding to Eq. (18) with
𝛽 = 1.25. This result demonstrates the relevance of considering the role of redox reaction in mass transfer. It is vital to emphasize that bubble radius, evolving over time, as aforementioned, is a feature of the mass transfer processes in the presence of advection.
6
CONCLUSION
We investigated the mass transfer of a rising bubble, initially composed of oxygen, in a borosilicate melt, which was doped with different amounts of Ce2O3and had different redox ratios. This study was performed experimentally and numerically. In-situ camera imaging was employed to generate the experimental data. We identified, in terms of the wt % Ce2O3 and 𝑃O2 values,
the cases in which the model adequately estimated the bubble shrinkage, and the ones in which it did not. Further, we explained the possible reasons for the mismatch in the experimental and numerical data for certain samples. The mass transfer increased with the increasing redox ratio of the glass melt as well as with the increase in the cerium content. Moreover, we reported herein that bubble da/dt increased with initial radius because of an increment in Sherwood number. It also validated the application of the modified Péclet number for the glass melt system, studied here. Additionally, we employed a characteristic time for mass
transfer, along with 𝑑 ̄𝑎∕𝑑̄𝑡 to properly understand the behavior of an oxygen bubble in all the studied bubbles under all the different melt conditions.
7
ACKNOWLEDGMENTS
Luiz Pereira is grateful to the Commissariat à l’énergie atomique et aux énergies alternatives (CEA) for his scholarship. The authors acknowledge the University of Chemistry and Technology, Prague (VŠCHT Praha) and the “Institute of Rock Structure and Mechanics of the Czech Academy of Science” for hosting Luiz Pereira during his visit to Prague. Jaroslav Kloužek and Miroslava Vernerová gratefully acknowledge the financial support from the Czech Ministry of Education, Youth and Sports (project No. LTAUSA18075). The authors also thank the Stazione Sperimentale del Vetro for generating high-temperature density and surface tension data.
References
1. Shelby J. E. Introduction to glass science and technology. Cambridge: The Royal Society of Chemistry; 2nd ed. 2005. 2. Abbas L., Bih L., Nadiri A., El Amraoui Y., Mezzane D., Elouadi B. Properties of mixed Li2O and Na2O molybdenum
phosphate glasses. J. Mol. Struct. 2008;876(1):194 - 198.
3. Pereira L. F. P., Bodiang K., Nunes E. H. M., Mear F. O., Delevoye L., Montagne L. Molybdenum Influence on the Mixed-Alkali Effect of Lithium–Sodium Phosphate Glasses. J. Phys. Chem. C. 2018;122(28):15886-15891.
4. Koudelka L., Kupetska O., Kalenda P., Mošner P., Montagne L., Revel B. Crystallization of sodium molybdate-phosphate and tungstate-phosphate glasses. J. Non-Cryst. Solids. 2018;500:42 - 48.
5. Möncke D., Jiusti J., Silva L. D., Rodrigues A. C. M. Long-term stability of laser-induced defects in (fluoride-)phosphate glasses doped with W, Mo, Ta, Nb and Zr ions. J. Non-Cryst. Solids. 2018;498:401 - 414.
6. Best A. Redox behaviour and fining of molten glass. PhD thesisTechnische Universiteit Eindhoven1994. 7. Němec L. Refining in the Glassmelting Process. J. Am. Ceram. Soc. 1977;60(9-10):436–440.
8. Cable M. Kinetics and Mechanisms of Fining Glasses. J. Am. Ceram. Soc. 1966;49(8):436-441.
9. Vernaz E., Gin S., Veyer C. Waste Glass. In: Konings R. J. M., ed. Comprehensive Nuclear Materials, Amsterdam: Elsevier 2012 (pp. 451–483).
10. Pinet O., Phalippou J., Di Nardo C. Modeling the redox equilibrium of the Ce4+/Ce3+ couple in silicate glass by voltammetry. J. Non-Cryst. Solids. 2006;352(50-51):5382–5390.
11. Lee S., Hrma P., Pokorny R., et al. Effect of melter feed foaming on heat flux to the cold cap. J. Nucl. Mater. 2017;496:54 - 65.
12. Pereira L., Podda O., Fayard B., Laplace A., Pigeonneau F. Experimental study of bubble formation in a glass-forming liquid doped with cerium oxide. J. Am. Ceram. Soc. 2020;103:2453–2462.
13. Hujova M., Pokorný R., Kloužek J., et al. Foaming during nuclear waste melter feeds conversion to glass: Application of evolved gas analysis. Int. J. Appl. Glass Sci. 2018;9(4):487–498.
14. Kress V. C., Carmichael I. S. E. The compressibility of silicate liquids containing Fe2O3 and the effect of composition,
temperature, oxygen fugacity and pressure on their redox states. Contrib. Mineral. Petrol. 1991;108(1-2):82–92.
15. Yamada K., Emori H., Nakazawa K. Time-evolution of bubble formation in a viscous liquid. Earth Planets Space. 2008;60(6):661–679.
16. Martel C., Iacono-Marziano G. Timescales of bubble coalescence, outgassing, and foam collapse in decompressed rhyolitic melts. Earth Planet. Sci. Lett. 2015;412:173–185.
17. Martel C., Bureau H. In situ high-pressure and high-temperature bubble growth in silicic melts. Earth Planet. Sci. Lett. 2001;191(1):115 - 127.
18. Cable M., Frade J. R. Diffusion-controlled mass transfer to or from spheres with concentration-dependent diffusivity. Chem.
Eng. Sci.1987;42(11):2525 - 2530.
19. Pigeonneau F. Coupled modelling of redox reactions and glass melt fining processes. Glass Technol.: Eur. J. Glass Sci.
Technol. A.2007;48(2):66-72.
20. Němec L., Vernerova M., Cincibusová P., Jebava M., Kloužek J. The semiempirical model of the multicomponent bubble behaviour in glass melts. Ceramics - Silikaty. 2012;56:367–73.
21. Němec L., Kloužek J. Modelling of glass refining kinetics. Part 1: single bubbles. Ceramics - Silikaty. 2003;47:81-87. 22. Jebava M., Němec L., Kloužek J. Kinetic and equilibrium data of gases in glass melts. Ceramics - Silikaty. 2004;48:121-127. 23. Greene C H, Gaffney R F. Apparatus for measuring the rate of absorption of a bubble in glass. J. Amer. Ceram. Soc.
1959;42:271-275.
24. Greene C. H., Kitano I. Rate of solution of oxygen bubbles in commercial glasses. Glastech. Ber. 1959;32K:V44-V48. 25. Doremus R H. Diffusion of oxygen from contracting bubbles in molten glass. J. Amer. Ceram. Soc. 1960;43:655-661. 26. Žlutický J., Němec L. Monitoring of the Refining Process in Glass Melts During Melting. Glastech Ber. 1977;50(3):57–61. 27. Kloužek J., Němec L. Modelling of glass refining kinetics. Part 2: Bubble distribution models and methods of measurement
of refining properties. Ceramics - Silikaty. 2003;47:155-161.
28. Pigeonneau F. Mechanism of mass transfer between a bubble initially composed of oxygen and molten glass. Int. J. Heat
Mass Transfer.2011;54:1448-1455.
29. Pigeonneau F. Mass transfer of a rising bubble in molten glass with instantaneous oxidation–reduction reaction. Chem. Eng.
Sci.2009;64(13):3120 - 3129.
30. Plessers J., Laimbock P., Faber A.-J., Tonthat T. Rapidox: A new tool for redox measurements in glass samples. In: Ceramic Engineering and Science Proceedings:145–158; 1998.
31. Pinet O., Hollebecque J.-F., Hugon I., et al. Glass ceramic for the vitrification of high level waste with a high molybdenum content. J. Nucl. Mater. 2019;519:121–127.
32. Vogel H. Das Temperaturabhängigkeitsgesetz der Viskosität von Flüssigkeiten. Physik. Z. 1921;22:645–646. 33. Fulcher G. S. Analisis of recent measurements of the viscosity of glasses. J. Am. Ceram. Soc. 1925;8(6):339-355.
34. Tammann G., W. Hesse. Die Abhängigkeit der Viskosität von der Temperatur bie unterkühlten Flüssigkeiten. Z. Anorg.
Allg. Chem.1926;156:245–257.
35. Yamashita M., Suzuki M., Yamanaka H., Takahashi K. Surface tension measurement of glass melts by the maximum bubble pressure method. Glass Sci. Technol. 2000;73(11):337–343.
36. Vernerová M., Němec L., Kloužek J., Hujová M. Gas release phenomena in soda-lime-silica glass. J. Non-Cryst. Solids. 2018;500:158–166.
37. Vernerová M., Cincibusová P., Kloužek J., Maehara T., Němec L. Method of examination of bubble nucleation in glass melts. J. Non-Cryst. Solids. 2015;411:59–67.
38. Pokorný R., Hrma P., Lee S., Klouzek J., Choudhary M. K., Kruger A. A. Modeling batch melting: Roles of heat transfer and reaction kinetics. J. Amer. Cer. Soc. 2020;103:701–718.
39. Vernerová M., Kloužek J., Němec L. Reaction of soda–lime–silica glass melt with water vapour at melting temperatures. J.
Non-Cryst. Solids.2015;416:21 - 30.
40. Pigeonneau F., Martin D., Mario O. Shrinkage of oxygen bubble rising in a molten glass. Chem. Eng. Sci. 2010;65:3158-3168.
41. Clift R., Grace J. R., Weber M. E. Bubbles, Drops, and Particles. New York: Academic Press; 1978.
42. Hadamard J. Mouvement permanent lent d’une sphère liquide et visqueuse dans un liquide visqueux. C. R. Acad. Sci. Paris. 1911;152:1735-1738.
43. Rybczynski W. Uber die fortschreitende bewegun einer flussingen kugel in einem zaben medium. Bull. de l’Acad. des Sci.
de Cracovie, série A.1911;1:40-46.
44. Beerkens R. G. C. Analysis of advanced and fast fining processes for glass melts. In: Advances in Fusion and Processing of Glass III New York: American Ceramic Society 2004 (pp. 3-24).
How to cite this article:Pereira, et al. (2020), Experimental and numerical investigations of an oxygen single-bubble shrinkage in a borosilicate glass-forming liquid doped with cerium oxide, J. Amer. Ceram. Soc., 10.1111/JACE.17398.